1. Introduction
Theory choice is one of the most important problems in philosophy of science. Following Kuhn (Reference Kuhn1962), the second half of the twentieth century was marked by the insight that rational theory choice must depend to some extent on the actions of others. Why and to what extent the actions of others should matter in theory choice is the central question in the literature on the division of cognitive labor.Footnote 1 Whereas many felt Kuhn himself had gone too far by describing theory choice as all but a social matter, Philip Kitcher (Reference Kitcher1990, Reference Kitcher1993) realized that the importance of the actions of others could not entirely be dismissed, if only for the need of a community to diversify the epistemic risk resulting from a tension between individual and collective rationality in science. Suppose two mutually exclusive theories compete to find the structure of DNA with a respective probability of success of p 1 = 70% and p 2 = 30%.Footnote 2 Each scientist individually picking the best theory results in a suboptimal division of labor because the collective would run a 30% risk that the structure of DNA is never found. Kitcher’s contribution to the literature was not a particular mathematical result but showed that if scientists take into account the actions of others there is a wide range of assumptions under which cognitive diversity results. Kitcher treats a theory as a standard for the division of cognitive labor within which the labor of individual scientists is distributed. Theories are like assembly lines that produce scientific results. The utility of these contributions then depends both on the size of the utility of the end result and the share of that utility that goes to each individual scientist.
To arrive at his result, Kitcher exploited the tension resulting from the fact that the actions of others influence both the size and the share of the reward in opposite ways. Regardless of the specific production function, for Kitcher the size of the utility p of what the theory produces increases with adoption as it converges on its intrinsic potential.Footnote 3 But the share of that value to which an individual is entitled decreases with adoption because there are more scientists to share with. Epistemic diversity results from the tension between both. An epistemically diverse community is one in which the share n of labor allocated to the best of two theories is smaller than the size of the community N, or more formally, p 1n + p 2(N−n) > p 1n. As agents adopt a theory there will often be a point at which for the next agent the increase in size no longer offsets the decrease in share, resulting in a diverse epistemic community. Kitcher thus showed that, under a large range of circumstances, communities where scientists take into account each other’s actions are epistemically better off than communities where they do not. However, the circumstances considered by Kitcher do not involve any change. Epistemic diversity only results synchronically.
Subsequent contributions have done a partial analysis of the dynamic behavior of share and size by analyzing how one changes given a change in the other. These resulted in conflicting answers to the question whether such an approach is robust diachronically. Moreover, these analyses were incapable of providing a fully dynamic account, one in which theories are no longer given but created as a function of the organization of labor in the model itself. Without adaptation, both accounts would result in either monopoly or extreme diversity. It is only by transcending this self-imposed restriction to the context of justification that an epistemically desirable diachronic organization of cognitive labor can result. New theories are made from the same labor that is used to develop existing theories, and if none of this labor is ever allocated to create new alternatives, then no new theories will ever be created, and long-term scientific progress is impossible.
The goal of this article is to argue how scientific communities possibly can divide labor in such a way as to preserve epistemic diversity diachronically and create new theories, avoiding lock-in or extreme diversity. This is done by unifying both partial dynamic accounts. Section 2 argues that both accounts are not rivals but model complementary aspects of any organization of labor. Section 3 unifies these dynamic accounts and shows that this results in a fully dynamic account in which theories are not given but created as a function of the organization of labor in the model itself. An agent-based model is built in section 4 to explore the resulting dynamics, and section 5 derives normative implications for how cognitive labor ought to be organized.
2. Partial Dynamics: Competition or Coordination
The insight that the organization of labor increases productivity marked the birth of modern economics. Adam Smith (Reference Smith1776/2003) uses the example of a pin factory to explain how the production of a complicated product such as a pin can be increased by dividing the complicated task of producing a pin into several smaller tasks and distributing the available workforce over these smaller tasks. The pin factory illustrates the fact that any organization of labor has two essential components: a standard that divides a complicated task into smaller subtasks and contributions that are distributed over these parts.
Distribution and division of labor are interrelated but different problems. The division of labor into smaller tasks is a condition of possibility for the subsequent distribution of labor over these smaller tasks. But there are many possible ways to divide a complicated task. So before labor can be distributed, the workers must first agree on what to produce and how to divide the production process. This is a coordination problem. When a number of workers have agreed on how to divide labor, their labor can then be distributed as efficiently as possible over the separate tasks. This is an allocation problem to be solved through competition. In sum, coordination and competition are two essential aspects of any organization of labor. A condition of possibility for any efficient distribution of labor is prior coordination on a standard for the division of labor. They determine the size and the share, respectively, of the utility for each individual worker of making a contribution to a standard. The extent of coordination among workers determines to what extent the intrinsic potential of the standard is realized and thus the size of the utility to be shared. These contributions compete with other contributions to that standard, determining the share of that utility that will go to the individual contributor.
Philip Kitcher set the stage for the investigation of the organization of cognitive labor because he was one of the first to conceive of theories as standards for the division of cognitive labor. However, his analysis was a static one. The contributions that adopters of a theory make do not affect the share remaining for future adopters or the size of the intrinsic value of the theory. Subsequent contributions have investigated these extensions separately. They treated the organization of labor either as a coordination problem, investigating the dynamics of the size of the reward given a fixed share, or as an allocation problem, investigating the dynamics of the share of the reward given its size.
2.1. Coordination
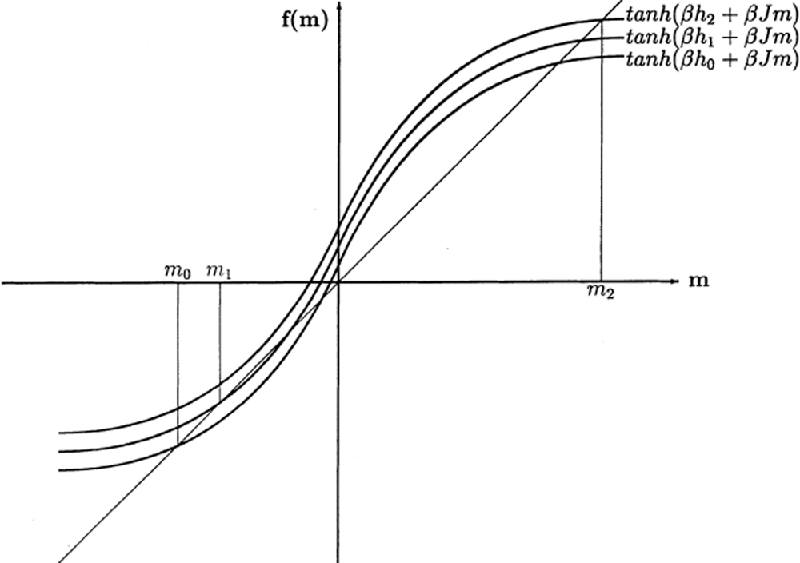
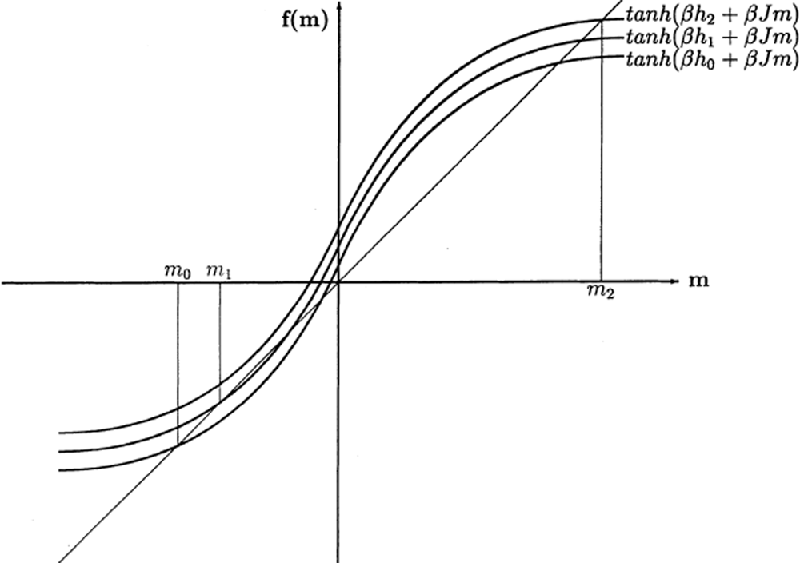
Kitcher’s model assumes that the size of theories increases with adoption, and he showed how it could nevertheless be avoided that all agents locked in to the same theory. But Brock and Durlauf (Reference Brock and Durlauf1999) investigated the robustness of this result in the face of a changing intrinsic value. It is, after all, only natural to assume that the amount of evidential support for a theory changes as scientists contribute to that theory. Brock and Durlauf have shown that if the size of the utility of a theory increases with adoption by other scientists, then theory change becomes nonlinear and path dependent: the same change in evidence will have different effects on the adoption of a theory, depending on the previous number of adopters (see fig. 1). Just as Arthur (Reference Arthur1989) has shown for the adoption of technological standards, the community has a tendency to lock in to a (potentially suboptimal) standard. Brock and Durlauf therefore warn that Kitcher’s diversity result might not be robust through time. “Our analysis of the progressiveness of science suggests that the role of social factors is more complex than is often recognized. From the analysis of stability, it is clear that social factors can impede the acceptance of a new, scientifically superior theory” (Brock and Durlauf Reference Brock and Durlauf1999, 124).
Nonlinearity of theory choice under increasing returns to adoption: the increase in evidence from h 0 to h 1 causes a shift in theory choice from m 0 to m 1; the same increase of evidence from h 1 to h 2 causes a disproportional shift in theory choice from m 1 to m 2. Source: Brock and Durlauf (Reference Brock and Durlauf1999, 122).
2.2. Competition
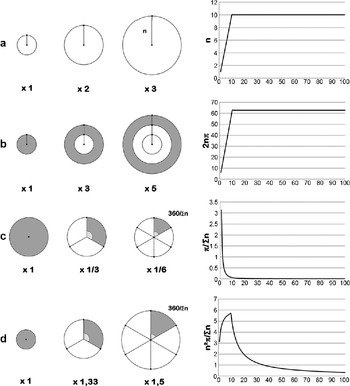
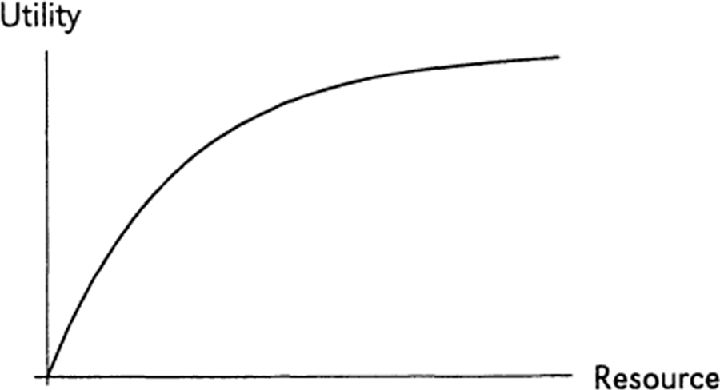
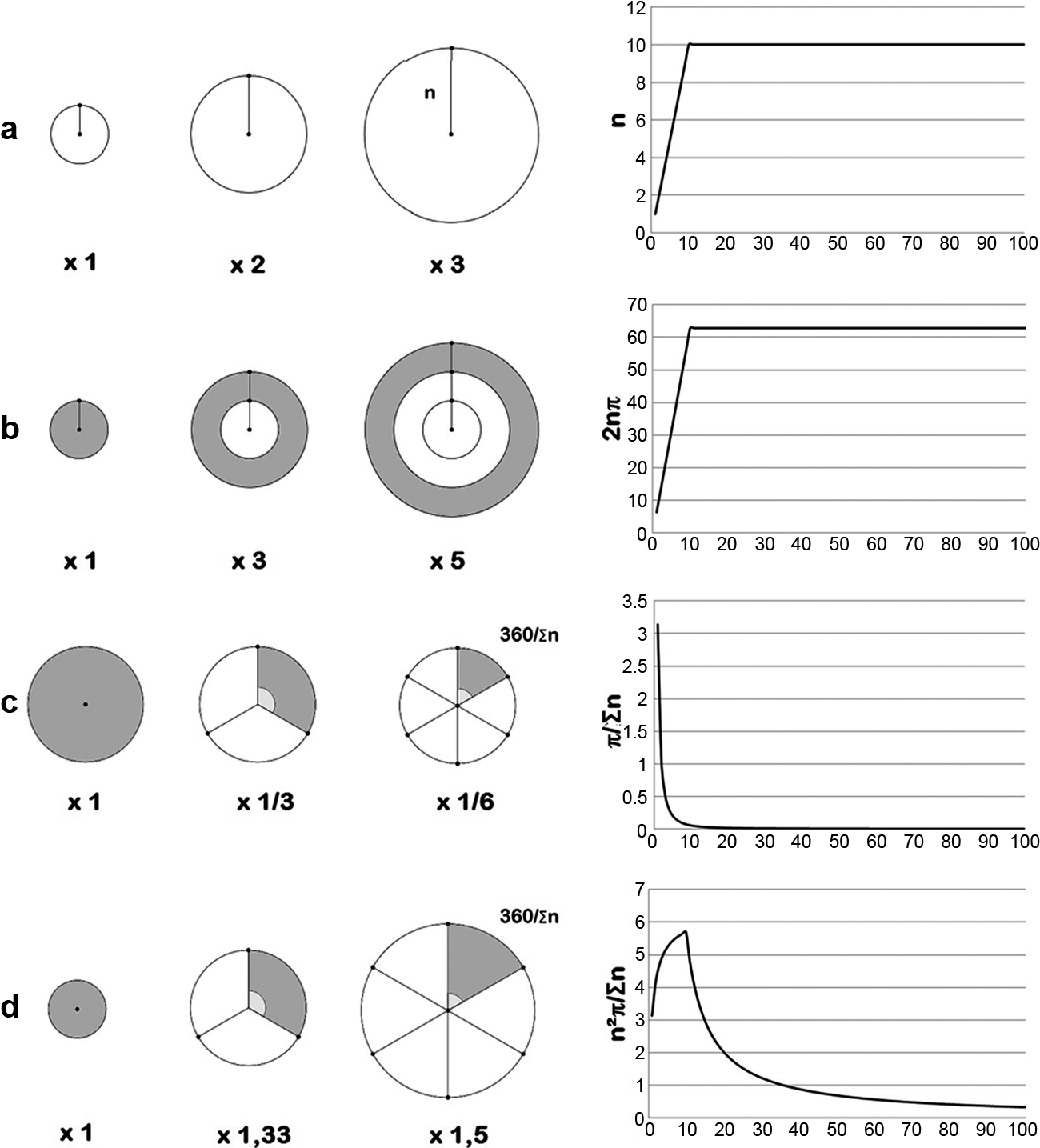
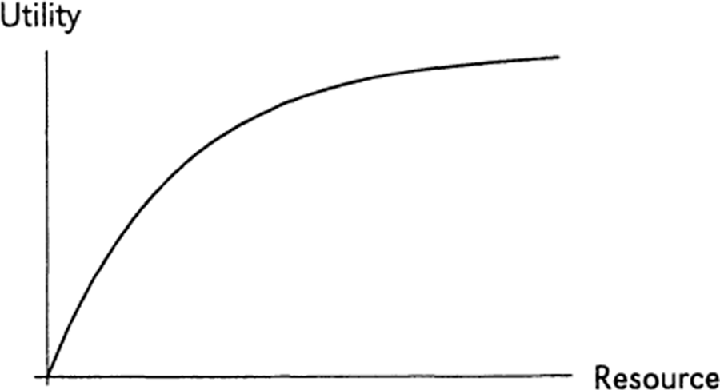
Kitcher’s model assumes a simple reward scheme by which all scientists of the successful method get an equal share of the size of the reward. But in practice reward is not equal but goes disproportionately to the first scientists to make a discovery. This is the so-called priority rule in science. The utility of a contribution then decreases not with its current adopters but with the sum of the contributions of those adopters through time (see fig. 2c). Strevens (Reference Strevens2003) uses this framework characterized by decreasing returns to production within a theory to show that the “priority rule” is not irrational, as is often thought, but that in typical cases of theory choice an individual reward scheme based on the priority rule results in a collective distribution of labor that is more desirable than less extreme reward schemes. Strevens assumes that the utility of scientific contributions to a theory typically decreases as more contributions are made because the less difficult, more interesting questions are the first to receive contributions and after some time only the less interesting, more difficult questions remain. In other words, as scientists adopt a theory, the reward for finding a solution will tend to decrease while the cost of finding answers will tend to increase. This results in decreasing marginal returns to production (see fig. 3). The incentive structure of the priority rule is rational because the resulting competition for priority fosters an efficient allocation of labor that can be shown, at least for some cases, to be optimal.
Left: Increase in adoption through time n t1 = 1, n t2 = 2, n t3 = 3 increases the utility of a theory (size of the surface) but decreases the utility of a contribution to that theory (share of the surface): b, evolution of size given share; c, evolution of share given size; d, coevolution of size and share. Right: Resulting utility of a contribution to a theory over 100 steps for n rising by one to and remaining at N = 10.
Decreasing returns to production. Source: Strevens (Reference Strevens2003, 71).
2.3. Limits
By treating the organization of labor as one or the other problem, these models succeeded in making Kitcher’s model dynamic but did so at the cost of losing the mutual dependence between competition and coordination, or size and share. Coordination on a standard for the division of labor is a condition of possibility for any subsequent distribution of labor. But the partial dynamics of Brock and Durlauf and Strevens address the two essential dimensions of any organization of labor separately. The limits of their separate analyses (and the power of their unification) becomes clear when considering their reliance on the restriction to the context of justification. Both Strevens and Brock and Durlauf assume that theories are given. But the construction of new theories is done with the same labor that is used for the development of existing theories. And if none of this labor is ever allocated to the construction of new theories, then science cannot progress. So a fully dynamic account of the organization of labor must provide normative guidance on how to balance the exploration of new theories against the exploitation of existing theories. It can easily be shown that both accounts result in neither a desirable nor a realistic organization of cognitive labor, as soon as scientists are given the power to create their own theories.
Brock and Durlauf themselves warn that Kitcher’s static result of epistemic diversity is undermined dynamically because Kitcher’s assumptions of the benefits of social coordination are shown to result in monopolistic tendencies dynamically. Even if scientists could in principle create their own theories, a community driven solely by the desire to specialize would tend to lock in to a single and potentially suboptimal theory. By contrast, if scientists are only competing for innovation, Strevens in turn cannot explain how scientists could possibly resist the temptation to create their own theory at every opportunity. The restriction to given theories affords Strevens to leave this question unanswered. With exogenous theories, agents have no choice but to contribute to an existing theory. With only given theories to contribute to, scientists are forced by assumption to work on a theory someone else created. In sum, dynamic analyses of the organization of cognitive labor suggest that the epistemic benefits of dividing labor over multiple scientists are not robust over time.
Communities risk getting stuck in either a monopoly in which there is no more innovation or a situation in which there are as many theories as there are scientists that lack specialization. Larry Laudan claims this is a general problem for dynamic models of science: “Students of the development of science, whether sociologists or philosophers, have alternatively been preoccupied with explaining consensus in science or with highlighting disagreement and divergence. Those contrasting approaches would be harmless if all they represented were differences of emphasis or interest. … What creates the tension is that neither approach has shown itself to have the explanatory resources for dealing with both” (Reference Laudan1984, 2). The remainder of this article develops the idea that competition and coordination are two sides of the same coin and therefore that both accounts can indeed be unified. The added value of this unification is the power to transcend the context of justification.Footnote 4
3. A Unified Framework: Exploitation and Exploration
If scientists are given the power to create new theories, Strevens’s exclusive focus on competition for novelty entails too much exploration of new theories. By contrast Brock and Durlauf’s emphasis on coordination highlights only the benefits of exploitation of existing theories. But there is also a relation between exploration and exploitation: coordination is a condition of possibility for competition. From this perspective, both accounts are not rivals but two sides of the same coin. Adoption, determining the size of the reward, is a condition of possibility for production, which determines the share of the reward. In this fully dynamic model, share and size are not investigated independently, rather they coevolve (see fig. 2d). This relation constitutes the key to unification because it allows bringing these opposing forces to bear on each other, canceling out each other’s problems. Brock and Durlauf can solve Strevens’s problem of extreme diversity by introducing an incentive to exploit; if the size of the reward rises with adoption (see fig. 2b), then it can become rational to exploit existing theories instead of continuously creating new theories. For his part, Strevens can solve Brock and Durlauf’s problem of lock-in by introducing an incentive to explore; if the individual share of the reward decreases with production (see fig. 2c), then it can become rational to explore new theories even if all other scientists adopt the same existing theory.
It will be shown in the next section that, when brought together, exploration and exploitation are capable of keeping each other in check, resulting in a dynamic balance that will ensure epistemic diversity through time. Their unification incentivizes scientists simultaneously to coordinate and to compete: scientists coordinate to increase the utility of the theory, but they compete with the other adopters of that theory for priority. As a result, scientists are no sheep in a herd, as feared by Brock and Durlauf, but they are no lone wolves either. On this unified account, they are team players who compete to coordinate and coordinate to compete. They compete to be on the team and coordinate within that team to compete with other teams. Coordination makes possible the emergence of new standards for the division of labor, and it is within this endogenously created possibility space that labor is subsequently distributed. Together, the two essential forces of coordination and competition exhaust the possibility space of any organization of labor: the exploitation of the actual and the exploration of the possible.
4. Agent-Based Model
This article aims to show that the unification of competition and coordination results in an epistemically desirable balance between the exploitation of existing theories and the exploration of new theories. Aggregate patterns emerging from the interactions of individual agents can be established using the technique of agent-based modeling (Railsback and Grimm Reference Railsback and Grimm2011). Consider a community of N(a 1, … , a N) scientists on a two-dimensional grid of size L, with N = L 2 agents. Each turn, each scientist chooses to make a contribution C(c 1, … , cN) to a theory S(s 1, … , s M) proportional to the expected utility of a contribution to that theory. Following the previous sections, the expected utility of a contribution to a theory is a function of the size of the utility of the theory resulting from adoption and the share of that utility that goes to the individual scientist resulting from production.
The “adoption” A of a theory s is the sum of the number of scientists who contribute to it at time t:

The “production” P within a theory s is the sum of contributions to that theory. Assuming scientists make one contribution to a theory each time they adopt that theory, production within a theory is nothing but the sum of adopters through time:

The utility of a contribution to a theory is proportional to adoption and inversely proportional to production. The parameter  denotes the output elasticity of coordination. This value is a constant determined by the available technology:Footnote 5

Together the incentive to explore and the incentive to exploit determine the utility of a contribution to a theory. Exploitation consists in an allocation of scientific labor to an existing theory. The more scientists exploit the same theory, the higher the benefit of specialization because scientists can specialize in narrower subproblems and specialized tools can be developed. As a consequence, the benefits of exploitation are a function of the number of adopters of a theory. Exploration consists in an allocation of scientific labor to a new theory. The fewer contributions made to a theory, the higher the innovative value of contributing to that theory. The benefit of exploration is the inverse of the number of contributions made to a theory. The relation between adoption and production then captures the tension between exploitation and exploration. The more other scientists adopt a theory, the higher the incentive to exploit that theory. But the more contributions these adopters make to that theory, the higher the incentive to explore new theories. As such, exploitation necessarily leads to exploration and vice versa.
Finally, the expected utility of a future contribution to a theory is

As promised, the combination of exploration and exploitation allows for transcending the context of justification. A nonzero utility can be assigned to the creation of a new theory. The number of theories is now no longer given but a function of the organization of labor in the model itself. A new theory has no adoption (A = 0) and no production (P = 0), resulting in a fixed utility of 1 regardless of  . The probability that a scientist creates a new theory will therefore vary in a manner inversely proportional to the sum of the utility of all theories already being adopted. The lower the utility of the existing theories, the higher the probability a new one is created, thus self-regulating the system into a balance between the exploitation of existing theories and the exploration of new theories. In pseudocode, the model runs as follows.Footnote 6
| SET up: |
| Two-dimensional grid of size N = L 2 |
| Let each patch be a scientist |
| Let the color of each patch represent the theory to which that scientist currently contributes |
| Create N scientists |
| All scientists contribute to the same theory. |
| RUN: |
| Ask each scientist to choose a theory to contribute to proportional to the expected utility of that contribution (eq. [4]) |
| All scientists make their contribution; their color changes accordingly. |
4.1. Observations
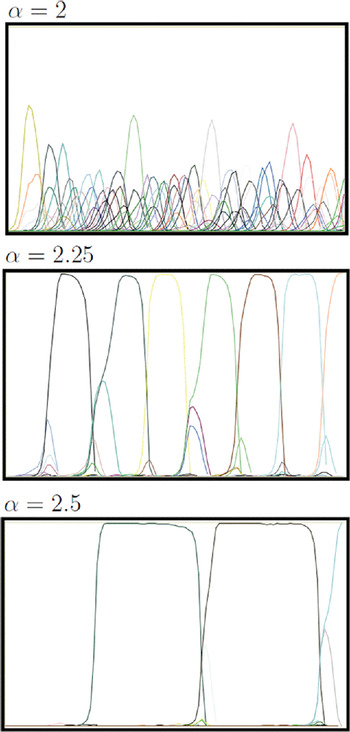
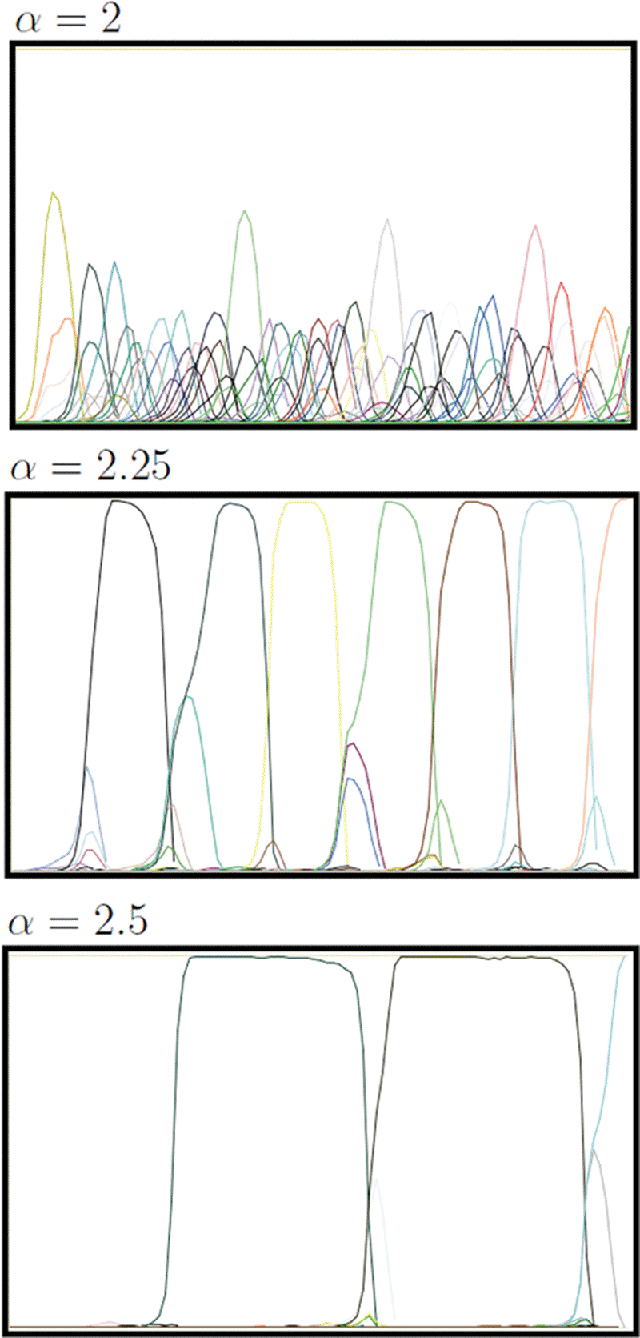
The resulting organization of cognitive labor through time can be visualized by plotting the market share of each theory represented by differently shaded lines, as done in figure 4 for various  . Already some observations can be made.
• Initially only a single theory existed; all other theories were created endogenously. Novel theories are created only as existing alternatives are exhausted.
Figure 4.Evolution of market share of standards over 100 ticks for various
 .
• Although there is no limit to the number of possible theories that can be created and there is competition for innovation (Strevens), scientists sometimes exploit existing theories rather than explore new ones.
• Although a consensus can persist and there are substantial benefits to coordination (Brock and Durlauf), the individuals driving the model have the capacity to unilaterally initiate theory change and escape lock-in. Thus, epistemic diversity can be saved through time.
 .
4.2. Robustness
Competition resulting in the creation of new theories and coordination resulting in the exploitation of existing theories keep each other in check. The community self-organizes to find an epistemically desirable balance, that is, one that avoids locking in to a potentially suboptimal theory. The system cycles between the exploitation of existing theories and the exploration of new theories. To establish the robustness of this result, it must be shown that this diversity is robust through time and against changes in  . For this purpose, it suffices to show that the incentive to explore will in the limit always be greater than the incentive to exploit. It is straightforward to see why this must always be the case. The incentive to explore rises with production to a theory, and production can increase indefinitely. But the incentive to exploit rises with adoption and is therefore necessarily limited by the size of the community. In the limit, production is infinite while adoption will always be finite. Hence, in the long run the incentive to explore will always be greater than the incentive to exploit. In terms of equation (4), in the limit the numerator will always be smaller than the denominator, hence making exploration of a new theory more probable than exploitation. As a consequence, no matter how large
 , the community N, or the intrinsic value of the theory, no theory can remain dominant forever. The epistemic diversity resulting from this unified model is therefore extremely robust.
5. Normative Implications
The fundamental normative question when dividing cognitive labor is to what extent agents ought to take into account the actions of others. This question typically reduces to the specification of a normative balance between the rational and the social: “leaders” choose that theory which they deem intrinsically superior, and “followers” choose that theory which others choose. But both types make only contributions to existing theories, and no labor is ever allocated to the creation of new theories. The transcendence of the context of justification makes it possible to shift the question instead to finding a normative balance between the actual and the possible: “exploiters” exploit existing theories, and “explorers” explore new theories. The goal in this section is to find the ratio of exploiters and explorers that is required to achieve a desirable balance between them. A desirable balance allows for specialization but systematically avoids lock-in.Footnote 7 In the previous section, a model was introduced that demonstrates how possibly the interactions of scientists balancing exploration and exploitation could result in such a desirable collective organization of labor. In this section, the incentive structure implicit in that model will be made explicit.
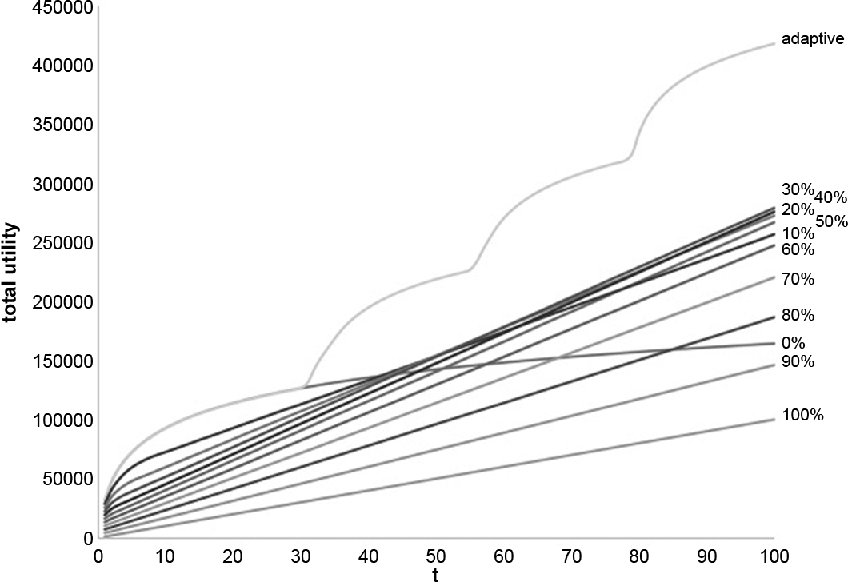
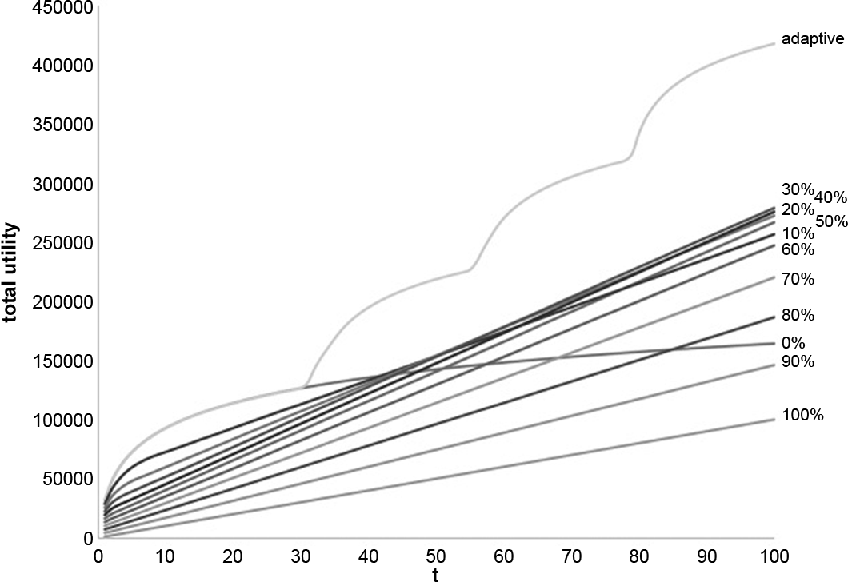
In the model proposed in the previous section, the ratio between explorers and exploiters is not fixed but adaptive. The coevolution of coordination and competition results in a self-regulated balance between the incentive to exploit and the incentive to explore. Figure 5 shows for 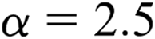 that the total utility in a system with such an adaptive ratio is greater than the total utility created by any fixed proportion of explorers from 0% to 100%. A system without explorers (0%) does well initially but is unsustainable in the long term. A system consisting only of explorers (100%) can keep on growing due to continuous innovation, but with as many theories as there are scientists it cannot reap the benefits of specialization. Combinations of both do better, but the adaptive strategy is superior. This is because it not only combines the benefits of specialization deriving from exploitation with the benefits of innovation deriving from exploration but has the ability to adaptively shift between them as the circumstances require it.
Comparison of total utility with an adaptive versus fixed ratio of explorers for 1,000 agents over 100 steps with 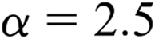 .
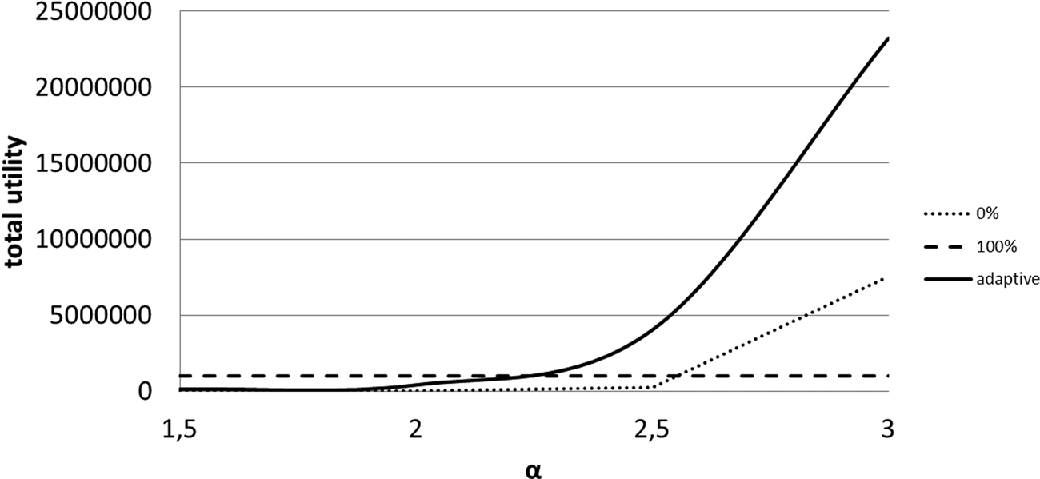
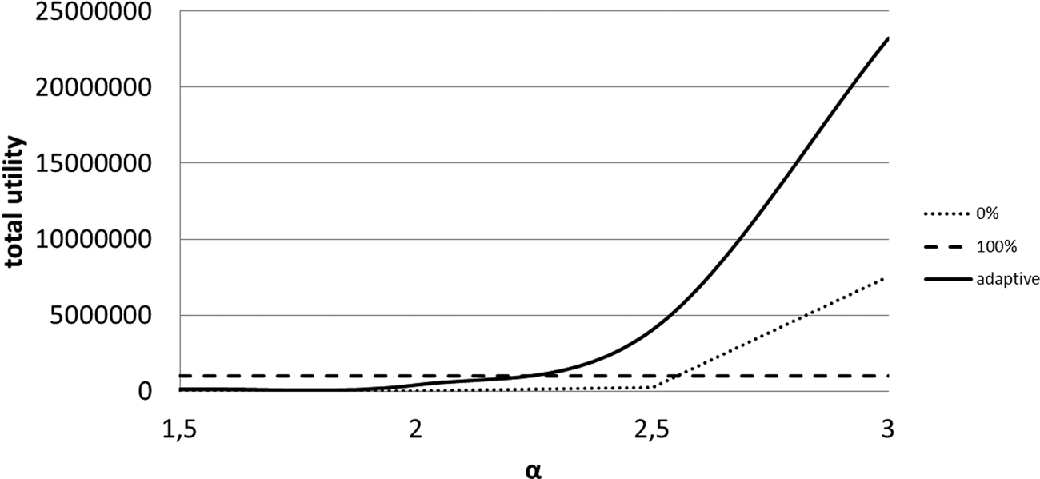
The superiority of the adaptive strategy is, however, not universal. Robustness analysis in figure 6 shows that the adaptive strategy is only superior if there are sufficient benefits to dividing labor, that is, if  is sufficiently large. If
 is too small, communities derive greater benefit from full exploration than from an adaptive strategy. This possibly explains why fields that have not been able (yet) to develop the epistemic technology to make a division of labor possible or worthwhile (textbooks, standard methodologies, formalism, specialized tools and data, etc.) have a substantially different disciplinary structure from those that have.
Total utility as a function of  after 1,000 steps for 1,000 agents.
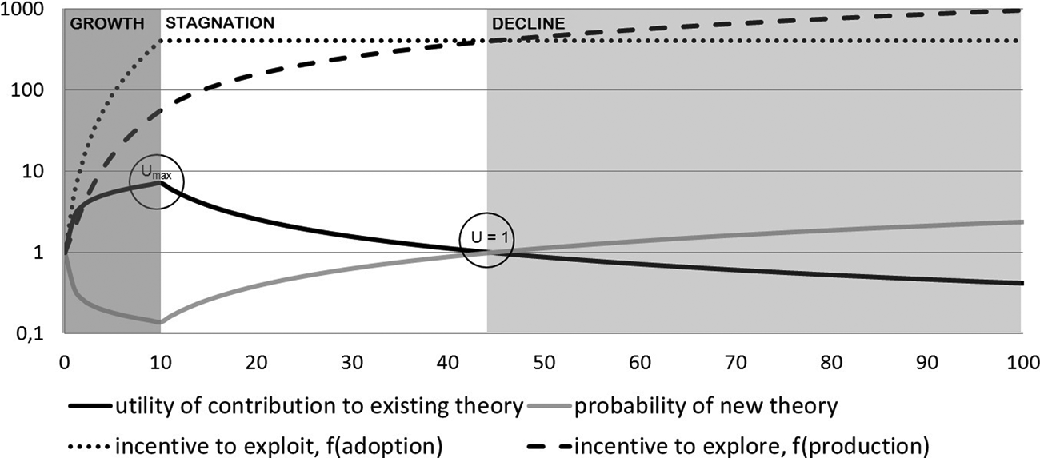
For larger values of  , to achieve a desirable organization of labor, agents must adapt their behavior to the circumstances. The incentive structure for individual scientists is continuously changing endogenously in order to maintain a self-regulated balance between the exploration of new theories and the exploitation of new theories. Kitcher already argued that individually rational theory choice depends on the actions of others. In this model, it also depends on the previous states of the system. The same choice will have different consequences depending on the actions of others through time. But although rational theory choice depends on social and historical factors, the agent-based model presented in the previous section revealed that these circumstances that determine the incentive structure exhibit a very robust cyclical pattern. It is against this general feature that normative implications of the model can be formulated. To bring out this cycle as clearly as possible, take a simple example of the typical life of a theory. The solid line in figure 7 represents the evolution of the utility of a theory. For simplicity, in this example the number of adopters rises with increments of 1 until all agents (N = 10) adopt the same theory. This is sufficient to calculate the expected utility of a contribution to the theory, consisting of the numerator (the incentive to exploit) and the denominator (the incentive to explore), and the probability that a new theory will be created given that no other theories exist.
Three-phased “life” of a theory over 100 time steps.
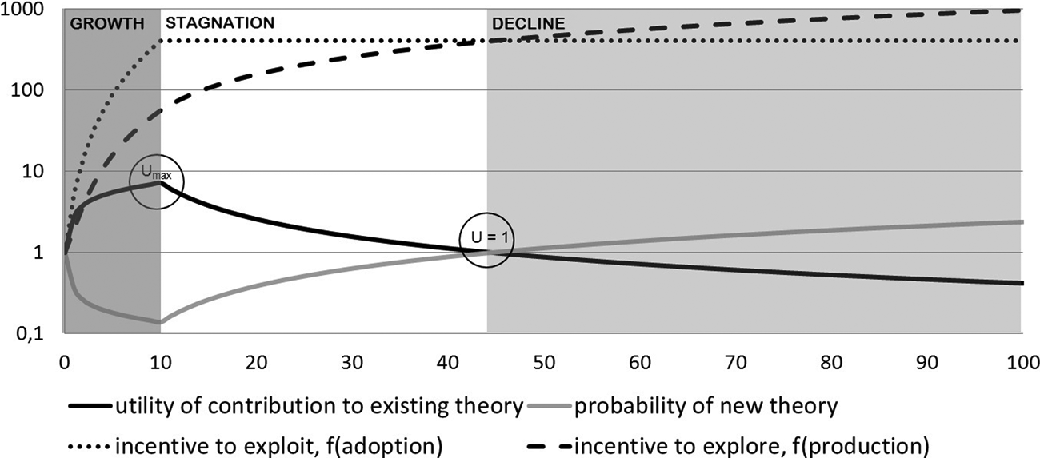
A necessary three-phase cycle of growth, stagnation, and decline emerges, marked by different shades of gray (see fig. 7). The three phases are separated by two points: the point at which the expected utility to a contribution reaches its maximal value (U max) and the point at which it reaches the value 1 (U = 1). During the growth phase, the expected utility of a contribution to the existing theory increases as more scientists adopt the theory and production has only just begun. Adoption is self-reinforcing because every new adopter increases the probability of adoption by others, and the exhaustion of the theory resulting from production is not sufficient to offset it. At the end of this phase the comparative utility of a contribution to the existing theory is at its highest, and the probability that new theories will be created is at its lowest. But adoption-led growth cannot continue forever because of the finite size of the community.
The stagnation phase begins when the increase in adoption stops but production by adopters continues. The utility of a contribution to the existing theory decreases but remains superior because of the benefits of high adoption. Scientists breaking away from the pack will be “tilting at windmills” because their new theories offer contributions of lower utility, making it difficult to convince others to join them and start reaping the benefits of specialization together. A turning point is reached when sooner or later the necessarily decreasing utility of contributing to the existing theory becomes smaller than 1 and those breaking away from the pack will be able to motivate adopters of the existing theory to join them with contributions of higher utility.
Every adopter gained for the new theory is one lost for the existing theory. This initiates the decline phase because breaking away from the pack is no longer dampened but reinforced. It is only a matter of time before one of the new theories gains prominence and replaces the existing theory. Increases in  , N, or the intrinsic value of the theory will only lengthen the duration of each phase, but as argued in the previous section the three-phase pattern itself is extremely robust. Each of these phases is characterized by a different incentive structure for the individuals contributing to it. This incentive structure and its evolution carries normative weight because it has been shown to result in a collectively desirable organization of labor.
6. Conclusion
Philip Kitcher argued that social factors can foster epistemic diversity. The more adopters, the more scientists to divide labor with, and hence higher productivity, but also the more contributions to compete with. However, dynamic analyses were, so far, inconclusive about the robustness of this result through time, and neither was able to transcend the assumption of exogenous theories. Brock and Durlauf (Reference Brock and Durlauf1999) analyzed how adoption determines the size of the reward through time, and Strevens (Reference Strevens2003) analyzed how production by those adopters through time changes the share of the reward for future contributions.
The model introduced in this article restores a dynamic balance by exploiting the fact that adoption and production pull in opposite directions and thereby have the ability to keep each other in check through time. The added value of this unification is the ability to transcend the assumption of exogenous theories and investigate collective theory choice not as a balance between the rational and the social but between the actual and the possible. In this model, scientists make their own choices, but not within the circumstances of their choosing. The possibility space for theory choice is not given but created collectively. The choices of others, past and current, determine the consequences of each choice and together constitute the possibility space for future choices. Scientists in such an environment cannot operate as lone wolves or sheep in a herd. It is only by acting as team players that a desirable collective balance is obtained that avoids lock-in or extreme diversity through time.