Influenza viruses cause significant but potentially preventable morbidity and mortality. Influenza epidemics were associated with more than 450,000 deaths in the United States in the 10-year span of 1989–1999.Reference Thompson, Shay and Weintraub1 According to the World Health Organization2 it is responsible for 250,000–500,000 mortalities a year globally. Vaccination remains the most effective method for preventing infection.Reference Cox3 During the 2009 influenza A (H1N1) pandemic, there was an observed increased mortality and resource consumption in morbidly obese individuals.4–Reference Van Kerkhove, Vandemaele and Shinde7 In addition, obese individuals are at increased risk for hospitalization during seasonal influenza.Reference Kwong, Campitelli and Rosella8 West Virginia has the second highest rate of adult obesity in the nation, at 32.5%.9 A prior study demonstrated that obesity was a predictor of poor immunogenic response to hepatitis B vaccination.Reference Weber, Rutala and Samsa10
Normal ranges of protection measured by hemagglutination inhibition (HAI) assay are titers of 1:40.Reference Potter and Oxford11 An effective response (seroconversion) to the influenza vaccination is typically defined as a 4-fold increase in antibody titer. Another measure to show effectiveness is the functionality of the antibodies once formed, measured by the micro-neutralization method.
The current study was designed to measure influenza antibody titers before and after vaccination in obese and nonobese healthcare workers (HCW) to determine whether postvaccine titers are in the protective range and to determine the functionality of the antibodies.
Methods
This was a prospective observational study of influenza vaccination response. Obese and nonobese HCWs had a prevaccination serum specimen drawn, received the recommended 2011/2012 influenza vaccine, and had a 4-week follow-up serum specimen drawn to determine HAI antibody response.
This study was performed at West Virginia University Hospitals (Morgantown) during their 2011 annual influenza vaccination campaign.
All HCWs were asked to participate in this study during this time and incentivized with a $35 gift card to complete the study. The only exclusion criterion was receipt of the vaccine by the intranasal route. HCWs were enrolled on a first come, first served basis until 100 workers were enrolled into each of 2 groups consisting of nonobese HCWs with a body mass index (BMI; calculated as weight in kilograms divided by height in meters squared) less than 30 and obese HCWs with a BMI greater than or equal to 30.
Demographic and health assessment information was obtained through a questionnaire. The data included on this questionnaire were contact number, age, sex, height, weight, previous year vaccinations, history of influenza in the previous year, diabetes, chronic renal failure, malignancy, liver failure, other comorbidities, chronic steroid use, and other immunosuppressive medications. Height, weight, and an arm circumference were measured before blood collection. Prevaccination blood collection was performed and then influenza vaccine was administered. The HCWs were instructed to return 4 weeks after their vaccination for a second blood collection, after which each received a $35 gift card.
HAI and micro-neutralization assays against A/California/7/09 (H1N1), A/Perth/16/09 (H3N2), and B/Brisbane/60/08 were performed on the serum samples collected on days 0 and 28–35 as described. The geometric mean titers (GMT) and geometric mean ratio were calculated in the pre- and postvaccination samples for each cohort. Seroconversion was defined as either a postvaccination rate of at least 1:40 with an undetectable (<1:8) prevaccination titer or at least a 4-fold increase in titer from pre- to postvaccine HAI. Seroprotection rate was defined as the percentage of HCWs with a postvaccination titer of at least 1:40.Reference Carr, Allison and Van De Velde12
The sample size was determined by the primary objective of seroconversion. On the basis of prior studies, using a seroconversion rate of 80% in the general population to show a 10% decrease in seroconversion for obese HCWs needed a sample size of 155 for a power of 80% with an alpha of 0.05. With acknowledgment of the possibility of the lack of retention of some HCWs, 200 total HCWs were enrolled.
HAI antibody titers were described as geometric mean. The Fisher exact test or the χ2 test was used for comparison of HAI antibody titers and categorical variables. Continuous variables were analyzed using the t test.
Results
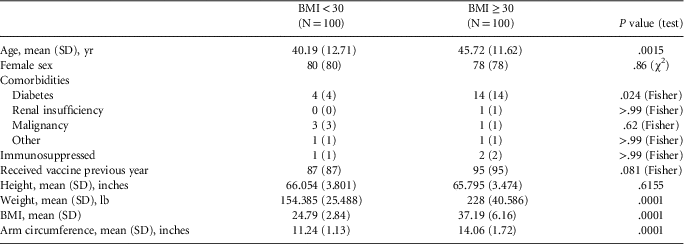
There was 95% retention of subjects with 190 of the 200 enrolled people completing the study. Regarding the patient characteristics, there was a statistically greater number of diabetics in the obese group (Table 1). Ten HCWs did not complete the study.
Baseline Clinical Characteristics of Healthcare Workers

Note. All data are number (percentage) unless otherwise indicated. BMI, body mass index (calculated as weight in kilograms divided by height in meters squared).
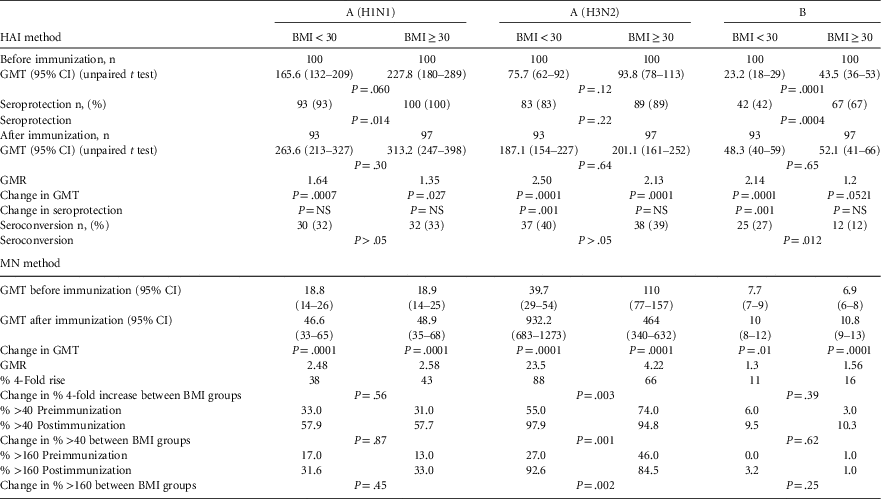
Pre- and postimmunization titers and the immunogenicity of HCW are shown in Table 2. Before immunization, there were more HCWs with seroprotection in the obese group for all 3 groups, with H1N1 and B being statistically higher. After immunization, postantibody titers were similar and very high in the H1N1 and H3N2. The influenza B postantibody titers were similar and fewer HCWs were protected. Overall, the change in titers measured by the GMT showed increases in all 3 groups with a lower response in the obese. The GMT to H1N1 demonstrated a statistically significant rise for the nonobese (1.64, P=.0007) and obese (1.35, P=.027). There was a statistically significant increase in the GMT to H3N2 for both groups (nonobese, 2.50, P=.0001; and obese, 2.13, P=.0001). There was a statistically significant increase to B in the nonobese (2.14, P=.0001) but not in the obese (1.2, P=.0521). The change in seroprotection between pre- and postimmunization phases for H1N1 was not statistically different for the obese and nonobese groups. There was a statistically significant increase with H3N2 with the nonobese group (83/100 [83%] vs 93/93 [100%], P=.001) but not with the obese group (89/100 [89%] vs 96/97 [99%], P=.5). There was a statistically significant increase with B with the nonobese group (42/100 [42%] vs 61/93 [66%], P=.001) but not with the obese group (67/100 [67%] vs 69/97 [71%], P=.5). Seroconversion was not statistically different between the nonobese and obese groups for H1N1 groups.
Pre- and Postimmunization Titers and Immunogenicity of Healthcare Workers
Note. BMI, body mass index (calculated as weight in kilograms divided by height in meters squared); GMR, geometric mean ratio; GMT, geometric mean titers; HAI, hemagglutination inhibition; NS, not significant.
Overall, the changes in micro-neutralization titers measured by the GMT all showed statistically significant increases. Comparing the obese and nonobese groups, there was no difference in rates of 4-fold increases in H1N1 or B titers. There was a statistically significant difference in the rate of 4-fold increase in H3N2 titers for nonobese compared with the obese group (88% [82/93] vs 66% [64/97], respectively; P=.003). There was no difference in the percent of sera achieving titer (%>40 post- after immunization) from micro-neutralization methods between the 2 groups (Table 2).
In an ad hoc analysis we found that the obese group, compared with the nonobese group, had a statistically greater number of HCWs who had a 4-fold decrease in titers from before to after immunization with H1N1 and H3N2, as shown in Table 3.
Comparison of Titers Declining by 4-Fold Postvaccination

Note. BMI, body mass index (calculated as weight in kilograms divided by height in meters squared).
Discussion
From the results of this study, it appears that HCWs in our institution are protected from influenza A (H1N1 and H3N2) at greater than 80% before vaccination and 99% after vaccination regardless of weight. This can be partially attributed to the combined 91% of HCWs who received the vaccine the year before. With these initial high rates it is hard to delineate the response differences between the 2 groups. There was a significant increase in seroprotection in response to influenza B vaccine for nonobese but not obese HCWs, but the higher initial rate of seroprotection of the obese HCWs confounds this observation.
Historically, the seroconversion rates have been in the range of 42% to 62% after the receipt of the influenza A vaccine.Reference Goodwin, Vinoud and Simonsen13 Our rates were lower, but this is attributed to the initially high antibody titer rates, especially to the influenza A H1N1 and H3N2 strains. Seroconversion rates for influenza B have been reported to be between 35% and 58%, compared with our study that showed 27% in the nonobese group and 12% in the obese group.Reference Goodwin, Vinoud and Simonsen13
Coleman and colleaguesReference Coleman, Talbot and Crimin14 presented an abstract that suggested that obesity was not independently associated with a lower post–influenza vaccination seroprotection against the 2008–2009 vaccine components. The authors specifically looked at patients who were 50 years or older with a BMI of 30 or greater (obese) or with a BMI of less than 30 (nonobese). Nonobese patients, compared with obese patients, had a lower baseline GMT to the 3 components (H1N1, 10.4 vs 12.1; H3N2, 15 vs 5.3; and B, 51.8 vs 56.5) and a subsequent higher seroconversion rate (H1N1, 28% vs 28%; H3N2, 62% vs 73%; and B, 28% vs 34%) than our data showed. Of note, they did demonstrate a much lower rate of seroprotection for the influenza A strains but not the influenza B (H1N1, 43% vs 47%; H3N2, 76% vs 82%; and B, 95% vs 94%), compared with our study.
In an ad hoc analysis of the data, an interesting trend emerged with obese HCWs having a significantly higher rate of 4-fold declining titers in the H1N1 and H3N2 groups. This generates many questions—for example, in the obese population what factors are causing this dramatic decrease in antibody titers in some HCWs who already had a titer of at least 40?
Sheridan and colleaguesReference Sheridan, Paich and Handy15 reported that the pre- and postvaccination antibody titers for the 3 vaccine strains studied were not significantly different between the obese and nonobese participants. They did, however, report that there was a significantly higher increase to the influenza B component in obese versus nonobese participants. Interestingly, similar to our results, they reported that there was a difference between the 2 groups at the 12-month follow-up with the obese participants showing a greater number of at least 4-fold decreases in HAI titers.
Conclusion
There were no significant differences between immunity to influenza between obese and nonobese HCWs after immunization. There are some data suggesting the immunization response may be less in some obese HCWs.
Acknowledgments
Financial support. American Society of Health-System Pharmacists Foundation (Fostering Young Investigators Research Grant to M.S.).
Potential conflicts of interest. All authors report no conflicts of interest relevant to this article.