


1. Introduction
Knowledge about the Earth’s past climate is crucial for comprehending the global climate change that we face today. Ice cores play a major role in this task, since they allow the reconstruction of several climate variables (e.g. temperature, accumulation and air composition). The air composition can be directly obtained from air trapped during the firn/ice transition, making ice cores unique among the palaeoclimate archives.
The bubble distribution found in ice cores is believed to be the only preserved record of the ice microstructure at the firn/ice transition, since the grain-boundary network and the crystallographic texture (fabric) are expected to change with depth, due to continual grain-boundary migration and fabric formation. For example, Reference Spencer, Alley and FitzpatrickSpencer and others (2006) argue that the number of bubbles per unit volume does not change during the ice compression process, allowing us to estimate the grain size at the firn/ice transition, using the finding of Reference GowGow (1968) that the ratio of air bubbles and ice grains per unit volume at the firn/ice transition is a constant, called the ‘Gow number’. Since grain growth at the firn/ice transition is controlled mainly by accumulation and temperature, the air-bubble number density may yield a proxy for either accumulation or temperature, if the other is given. According to Reference Raynaud, Lipenkov, Lemieux-Dudon, Duval, Loutre and LhommeRaynaud and others (2007), the total amount of air entrapped in the ice is a possible proxy for the incident solar radiation. Therefore, an exact reconstruction of this total air content, which is also determined by the processes at the firn/ice transition, could yield a precise ‘clock’ ticking in the ice. Reference Alley and FitzpatrickAlley and Fitzpatrick (1999) show that the presence of highly elongated bubbles indicates that a critical strain rate has been exceeded in the ice sheet at some time. Thus, besides climate information, bubbles may also provide insight into the local deformation history of natural ice.
To date, most studies of air-bubble distributions in ice cores have been carried out using either optical microscopes and manual counting (Reference Lipenkov and HondohLipenkov, 2000) or automated image acquisition (Reference KipfstuhlKipfstuhl and others, 2006) and low-level image processing requiring painstaking user intervention. The great amount of work and time needed to process large sets of images, such as those available for the European Project for Ice Coring in Antarctica (EPICA) deep ice cores from Dome C (EDC) and Dronning Maud Land (EDML) (Reference KipfstuhlKipfstuhl, 2007), has prevented thorough studies of such image data. Instead, statistical sampling or heuristic selection has been used to decrease the size of the datasets to be processed.
In this work, we present profiles of average bubble size and bubble number for the entire EDML and EDC cores, and distributions of bubble sizes at selected depths. This analysis is performed on the large datasets of high-resolution photomicrographs of fresh ice sections produced via microstructure mapping (Reference KipfstuhlKipfstuhl and others, 2006; Reference KipfstuhlKipfstuhl, 2007), and is made possible through a new software framework that automatically registers images of overlapping micrographs and merges them into a mosaic. This registration and automatic mosaic generation is necessary to avoid bias in the measurements of position, orientation, shape (elliptical approximation) and size of individual bubbles.
Previous studies (Reference Lipenkov and HondohLipenkov, 2000; Reference KipfstuhlKipfstuhl and others, 2006) have used manual selection of data subsets and semi-manual evaluation of microstructures. This selection and analysis process may introduce statistical artefacts through human bias. Using a microscope with a built-in scale to measure the semi-major axes of an almost circular, ellipse-shaped bubble is prone to minuscule changes in the alignment of the scale and the bubble. In our approach, we eliminate the risk of such artefacts by analysing the complete dataset in an automated, deterministic framework. For example, we fit ellipses to the entire outline of an identified bubble in order to obtain the parameters of the approximating ellipses. The way each individual component is processed is exactly the same for every bubble, which increases repeatability and comparability of the results gained with this method.
In this contribution, profiles of bubble size and bubble number from the EDC and EDML cores are compared with data from the Vostok (Antarctica) core presented by Reference Lipenkov and HondohLipenkov (2000). In both the EDC and EDML cores, we can identify a particular class of bubbles, that Lipenkov termed ‘microbubbles’. These are distinguished from normal bubbles by their smaller sizes, <50 μm, and are believed to form in the first few metres, close to the surface. Additionally, we use the bubble profiles to estimate the porosity at the firn/ice transition, which is the depth where bubbles close off and the air content in the ice is established. Evidence is shown that the bubble distribution at a certain depth can be projected back to estimate the porosity at the firn/ice transition.
2. Edml and Edc Air-Bubble Image Data
The images underlying our analysis stem from the second EDC core (EDC99) drilled in 1999–2005, and from the EDML core drilled in 2001–06 (Table 1; EPICA Community Members, 2004, 2006). In order to avoid post-drilling bubble formation due to core relaxation, micrographs of fresh ice sections were taken shortly after drilling, directly at the drill sites, during the field seasons 2000/01 (EDC) and 2001/02 and 2002/03 (EDML). As such, the recorded thick sections cover the entire bubbly ice zone of both cores (depth range 90–1200 m) in 10 m increments. Each section was prepared according to the standard methods for microstructure mapping presented by Reference KipfstuhlKipfstuhl and others (2006), sections were 45 mm wide and 90 mm along the core axis, while the thickness varied between 4.5 and 5.5 mm.
Drilling-site characteristics (Reference PetitPetit and others, 1999; EPICA Community Members, 2004, 2006)

From every section, two sets of photomicrographs were produced. The first set shows a general view of the ice microstructure, including air bubbles, clathrate hydrates, grain and subgrain boundaries, slip bands and micro-inclusions. It was created with the conventional technique of microstructure mapping (μSM) described by Reference KipfstuhlKipfstuhl and others (2006). A second set of micrographs showing exclusively the outline of all air bubbles in the sample was produced using a modified version of the μSM method as follows. As in the original μSM method, each section was scanned with an optical microscope equipped with a charge-coupled device (CCD) camera and a software-controlled xy-stage. However, for the bubble-optimized μSM we mounted the camera on a bulk extension and used a 50 mm macro-objective to produce a much larger depth of field. The combination of this large depth of field with an intense light source (images were taken in transmission) obliterates all microstructural features other than air bubbles, the latter revealed as highly absorbing/refracting objects with sharp, dark outlines (Fig. 1).
Thick-section image taken with a large depth of field, showing all air bubbles in the sample volume. This micrograph shows several clusters of two overlapping bubble images, created by bubbles at different depths inside the sample.

A single micrograph covers an area of 3.0 mm × 1.8 mm with a resolution of ∼5 μm per pixel. We use a 0.5 mm overlap of neighbouring micrographs to facilitate reconstruction of the full-resolution mosaic image of the complete section, which with these settings consists of ∼750 overlapping micrographs.
3. Image-Processing Framework
Individual micrographs do not usually contain more than several tens of bubbles. This is nowhere near enough to yield statistically significant results. In order to improve the statistics and to obtain meaningful results, a large number of micrographs from every sample must be analysed. The automated detection and registration of bubble-like features on individual images was presented by Reference Honkanen, Saarenrinne, Stoor and NiinimäkiHonkanen and others (2005). In our application, the task is made more difficult by the overlapping regions of neighbouring images and the potential errors of overlooking or double-counting of bubbles in these areas. To solve this problem, we developed a suitable procedure for assembling individual micrographs into a single mosaic image containing the entire bubble distribution of the ice sample.
The creation of mosaic images from individual micrographs is complicated by parallax effects. These effects are caused by the image acquisition in which the samples are moved on the xy-stage by the same order of magnitude as the sample thickness and the optical depth of field. Since a telecentric set-up was not practical, the apparent displacement of bubbles in the images depends on depth. This depth-dependent displacement changes the relative position of bubbles in the overlapping region of neighbouring images. To avoid mistaking the same bubble for two distinct ones, we developed a robust algorithm to identify individual bubbles and match them between images. This matching is based on a measure for the similarity of two bubbles. We use the area correlation coefficient proposed by Reference Shen, Song, Iguchi and YamamotoShen and others (2000) to identify the two bubbles: let A and B be two sets of points in the plane with respective areas A A and A B. The area correlation coefficient is defined as

This measure incorporates changes in shape, position, size and orientation into one scale-invariant, stable threshold. It should be noted that taking the images without overlap would not help to overcome this problem, since there would still be bubbles from different depths in neighbouring micrographs, intersecting in one but not the other image due to parallax shifts.
In regions with large bubbles and high number densities, the probability of two or more bubbles from different depths in one micrograph overlapping is of the order of several per cent. For instance, by counting the EDC dataset from 212 m depth manually we found that ∼30% of the bubbles belonged to clusters of several overlapping bubble images (Fig. 2a). These clusters were created by bubbles at different depths, whose images overlap (for simplicity, henceforth we condense the expression ‘bubble images’ into ‘bubbles’, the meaning becoming evident from the context). The probability of two bubbles overlapping depends on their sizes and is proportional to the sum of their radii squared. Hence, ignoring those bubble clusters would lead to a systematic underestimation of the number of bigger bubbles. Additionally, whether a bubble belongs to a cluster or not depends on the apparent relative position of bubbles, which can change for bubbles from different depths on neighbouring images. It is evident that segmentation of bubble clusters is essential for matching individual bubbles between overlapping micrographs.
(a) Processing of single images: 1. thresholding; 2. closing and connected-components analysis; 3. detection of perimeter and feature area; 4. thresholding on curvature of perimeter curve; 5a. registration of single bubble and fitting of ellipse to estimate orientation of bubble; 5b. segmentation of perimeter and fitting of ellipses to individual arcs. (b) Overall structure of mosaic-reconstruction algorithm.

Another important reason to process the entire dataset, as opposed to selecting individual images, is that artefacts may be generated during the image-acquisition process. For example, in our framework we have to deal with the misalignment of the axes of the CCD chip and the sample: although the individual ice samples are aligned precisely on the glass plates and the xy-positioner, the xy-axis of the camera is difficult to align. From single images, distinguishing between a preferred bubble orientation and a misalignment of the camera axis is impossible. However, by matching neighbouring images, it is possible to deduce the direction of motion of the xy-stage (corresponding to the axes of the glass plate and the sample) relative to the image’s axis from the CCD’s alignment. This is just the vector between two identical (e.g. upper-left) image corners. The sample/camera misalignment can then be corrected for by subtracting the computed angle offset.
Our bubble-detection algorithm assumes partially overlapping, ellipse-shaped bubbles. Thus we analyse all datasets in the depth range 140–1200 m. For shallower depths, the assumption of ellipse-shaped bubbles breaks down and many irregularly shaped bubbles are classified as artefacts. This leads to a significant bias in the computed number of bubbles. Other variables that describe an average over the bubble ensemble are much more robust against this type of error (e.g. the average bubble eccentricity, which we discuss below). For depths >1200 m, the clathration process is practically complete, leaving virtually no air bubbles to be detected (i.e. all bubbles have been converted into air hydrates).
Processing of individual images
Due to the imperfect matching of the focal plane and the sample surface, the mapping of physical length scales to image coordinates may be different in the x- and y-directions. This is why a geometric calibration of the image data is necessary. Following this calibration step, all subsequent data will have the unit of length-scale in the physical coordinate frame.
To be able to match neighbouring images correctly, individual bubbles on single images need to be identified first. Bubbles act as lenses: depending on their depths, they will either refract the light away from the microscope or concentrate the incident light in the form of caustics in the centre of dark bubble images. This effect can be clearly seen in Figure 1. The implementation of the individual image processing follows Reference Honkanen, Saarenrinne, Stoor and NiinimäkiHonkanen and others (2005) and is described below.
The method we use to fit ellipses to scattered data points minimizes the sum of the squared algebraic distances of the sample points to the general quadratic equation ax 2 + bxy + cy 2 + d = 0, subject to the constraint 4ac − b 2 = 1. It always returns an ellipse and can be calculated by solving one generalized eigensystem. This approach is described in detail by Reference Fitzgibbon, Pilu and FisherFitzgibbon and others (1999). The processing of single images is schematized in Figure 2a. To compensate for changes of illumination, a global threshold is determined for each single image as described by Reference Ridler and CalvardRidler and Calvard (1978). Pixels above the threshold are discarded as belonging to the background. Sometimes caustics can cross a bubble’s perimeter and therefore alter the shape of the bubble, as would be inferred by analysing the dark pixels only. To compensate for this effect, we apply a closing operation on the segmented dark pixels, which closes gaps up to five pixels between neighbouring dark pixel segments.
The resulting binary image is labelled using a connected-components analysis. Each connected component is processed in the following manner:
-
1. The perimeter of the component is found and parameterized in the clockwise direction.
-
2. The pixels belonging to the component are found by fillingthe perimeter using a flood-fill algorithm (including light pixels due to caustics).
-
3. Possible connection points are extracted by applying a negative threshold on the curvature of the perimeter curve (i.e. searching sharp left turns) and clustering these connection point candidates.
-
4. The perimeter is divided by the connection points in different arcs. Depending on the number of resulting arcs, the component is processed in one of the following ways:
-
(a) For perimeters with more than five arcs, the whole component is treated as an artefact, since overlapping of more than three bubbles is significantly less probable than two or three bubbles overlapping. Nevertheless, at shallow depths close to the firn/ice transition, the bubbles display very irregular shapes and the overlap of more than three bubbles occurs more frequently. This is due to the large, elongated shape of the former pore channels, which are altered subsequently by break-up of very elongated bubbles. This leads to a significant misclassification of irregularly shaped and overlapping bubbles for depths <200 m. At these depths, however, the entire assumption of ellipse-shaped bubbles breaks down and this framework should not be applied. At depths >200 m, where diffusion through the gas phase has rounded off the broken-up bubbles, the overlapping of four or more bubbles is negligible. This aspect is discussed empirically in section 4.
-
(b) An ellipse is fitted to the perimeter if one connection point or less is found. If the area-correlation coefficient, c AB from Equation (1), of the fitted ellipse and the original component is above a threshold λ single, the component is considered as a single bubble and registered with its perimeter and area, and the orientation and half-axes are defined by the fitted ellipse. If it is below the threshold, the component is discarded.
-
(c) Otherwise, an ellipse is fitted through every arc using the algorithm proposed by Reference Fitzgibbon, Pilu and FisherFitzgibbon and others (1999).
Depending on how well the ellipses approximate the arc segments, the ellipses are assumed to be a good match for the original bubble, or the arc segments are discarded. As a measure of the goodness of the ellipse fit, c AB from Equation (1) is used for the ellipse and for the filled convex hull of the arc in addition to the threshold of λ arc.
-
-
5. To determine whether different arcs belong to the same bubble, the resulting ellipses are compared using their area correlation coefficient, c AB, with a threshold of ν. If two or more arcs belong to the same bubble, the corresponding ellipses are discarded and a new ellipse is fitted through the points of all corresponding arcs.
-
6. All remaining ellipses are registered as bubbles with their area, A bubble, perimeter, L, half-axes, a and b, and orientation, θ.
Overall structure of the algorithm
Figure 2b shows the overall structure of the bubble-detection and mosaic-reconstruction algorithm.
-
1. Edge images are removed if a significant portion of the images in a border row or column (>80%) shows mostly black pixels (the ice section moved away from the camera).
-
2. Average displacement of neighbouring images is determined. Random images are selected and the relative displacement from their neighbours is determined by maximizing the cross-correlation of the overlapping image parts. This is repeated until 20 horizontal and 20 vertical neighbours are processed. From the calculated displacements, outliers are removed and the remaining displacements are averaged.
-
3. Each row of micrographs is successively processed in the following way. Bubbles in the individual micrographs are detected. Then, for each pair of horizontal neighbours, bubbles in the overlapping area are marked as possible matches whenever their distance in the overlapping area is below a certain threshold, η. If the area correlation coefficient, c AB, of two match candidates is above ν the two bubble images are considered to be different images of the same bubble and one of them is erased. Vertical matches are detected in the same manner between two successive rows after both rows have been processed to remove double images of horizontal neighbours. Again, for each match of two bubble images, one copy is removed. This ensures that even bubbles present on four images (overlapping corners) are processed correctly. The processing of the individual images is done in parallel on as many computing cores as the computer has to offer, using the OpenMP library for multi-core parallel computing.
-
4. The complete mosaic image is saved. The data of the bubble distribution itself are saved in ASCII text files that contain each bubble’s position, (x, y), perimeter length, L, cross-sectional area, A bubble, projected length of the two half-axes, a and b, and the orientation angle, θ, between the short half-axis and the image’s vertical axis.
The different thresholds are calibrated by visual assessment: During data processing, a large mosaic image is generated in which all the registered ellipses are drawn. This allows a quick visual examination of the quality of the data processing. We tried different threshold values for the EDML datasets from 204, 405 and 900 m and the EDC dataset from 206, 346 and 800 m. We tested values in the following ranges: λ single = 0.5–0.9, λ arc = 0.4–0.8, ν = 0.6–0.9, η = 50–150 pixels. In these ranges the results were insensitive to the exact value of each parameter and we chose the following values for the batch-processing of all datasets: λ single = 0.7, λ arc = 0.7, ν = 0.8, η = 50 pixels.
4. Air Bubbles in the Edc and Edml Ice Cores
The framework described above was applied to thick-section images from the EDML and EDC ice cores. Depending on the depth and exact dimensions of the images, ∼1000–11 000 bubbles could be detected in individual thick-section mosaics. The statistical error due to misclassification was estimated by counting misclassified features in images by hand for EDC datasets from 137, 204 and 426 m and for EDML datasets from 165, 206, 424, 805 and 1215 m. The highest misclassification rate, of 24.4%, was found in the sample from EDC at 137 m, where the assumption of ellipse-shaped bubbles is violated and many bubbles are part of clusters of more than three bubbles. At depths >200 m the misclassification rate was <5% and showed no further dependence on depth or coring site. Practically all errors were caused by the misclassification of bubbles as artefacts, i.e. overlooking bubbles. A graph of the omission rate, i.e. the relative number of overlooked bubbles, for all manually processed datasets is shown in Figure 3. The opposite case, i.e. the classification of artefacts or other non-bubble features as bubbles, was <0.5% in these datasets and therefore can be neglected. This is due to the very restrictive assumption of ellipse-shaped bubbles and the irregular shape of practically all artefacts. We only used datasets from depths >200 m for the inference of quantities such as bubble number and porosity profiles, which rely on the absolute number of recognized bubbles.
Omission error rate vs depth. The relative number of bubbles that are overlooked by our registration algorithm, due to irregular shape or clustering of more than three bubbles, was determined by manually counting overlooked bubbles in randomly selected 2000 × 2000 pixel sections of the reconstructed mosaic images. This procedure was performed for EDC samples from 137, 204 and 426 m depths and EDML samples from 165, 206, 424, 805 and 1215 m depths.

Another source of error was the overexposure of about half the images during the image-acquisition process. This led to an apparent decrease in bubble size, affecting estimates of bubble volume and porosity. We estimated the error due to overexposure by artificially overexposing the correctly exposed datasets. We matched their histograms with the histograms of the nearest (on the depth scale) overexposed datasets. Comparing the porosity estimates from the original and the artificially overexposed datasets gave us an average error of 0.5% due to overexposure.
The time needed to process each dataset was 8–14 min (average 11 min) on a quadcore central processing unit (CPU; intel core2quad 6600, 4 × 2.6 GHz) and 17–32 min (average 22 min) on a single CPU notebook (intel centrino 1.7 GHz). The fast run-times of our framework allow data processing parallel to the preparation of the samples at the drilling site. This not only gives researchers the opportunity of having a first glance at their data in situ, but also makes our tool a vital prerequisite for gaining feedback about sample preparation and image acquisition, which could be implemented directly in the field.
Bubble size and number: comparison with data from the Vostok ice core
Reference Lipenkov and HondohLipenkov (2000) conducted a thorough study of air bubbles in the Vostok ice core by surveying ice samples manually, using a microscope with a built-in scale. In this subsection we analyse some statistical properties recovered from the EDC and EDML cores, and compare them with Reference Lipenkov and HondohLipenkov’s (2000) results from Vostok. As the EDC and Vostok sites are similar in terms of temperature and accumulation (Table 1), one would expect a closer similarity between these two sites than between either of them and EDML.
Bubble-size distributions: microbubbles in EDC and EDML cores
We determine the size of a bubble by its equivalent radius, r, defined as the radius of a disc with the same area as the bubble image,
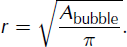
The distribution density function of the equivalent bubble radius is plotted for each dataset in Figure 4. For simplicity, henceforth we call each of these functions a ‘bubble-size distribution’. To facilitate comparison with Reference Lipenkov and HondohLipenkov’s (2000) Vostok data, we present these distributions on a logarithmic scale of bubble radii, with logarithmic bin sizes.
Evolution of bubble-size distribution with depth (indicated along with age) in EDC and EDML cores.

The bimodal size distributions observed in shallow-depth samples from the EDC core (e.g. 137 m depth in Fig. 4) are very similar to those found in the Vostok core at shallow depths (Reference Lipenkov and HondohLipenkov, 2000). The peak at smaller bubble sizes corresponds to what Lipenkov calls ‘microbubbles’, while the peak at larger sizes corresponds to ‘normal’ bubbles. We can also observe this distinction between microbubbles and normal bubbles at shallow depths in the EDML core (e.g. 165 m depth in Fig. 4), where, although the bimodal character of the size distributions is lost, the microbubbles create a long tail towards smaller bubbles.
Similar to Vostok, in the EDC and EDML cores the overall shape of the bubble-size distributions changes with depth, as the normal bubbles tend to compress faster than the microbubbles. With depth, this makes it increasingly difficult to separate the microbubble distribution from the normal bubbles (e.g. EDC 426 m and EDML 424 m in Fig. 4).
The origin of microbubbles in polar ice is still unclear. Our observations of snow crystals and firn samples (S. Kipfstuhl, unpublished data) indicate that they might have already formed in the snowpack or in shallow firn layers. Some microbubbles are observed in firn samples (although their observation is often hindered by the pores). Their average size at the pore close-off depth is much smaller than the mean pore size. As discussed above, at shallow depths microbubbles tend to compress more slowly than normal bubbles (suggesting that, during pore close-off, microbubbles may contain gas at higher pressure than normal bubbles). However, a detailed description of the mechanism of microbubble formation is lacking.
Mean bubble-size profiles
Figure 5a shows the average value of the equivalent bubble radius, r, as a function of depth. As expected, the core with the highest mean annual temperature (EDML) exhibits the largest bubbles, while the bubbles are smallest in the Vostok core. In all three cores (EDML, EDC and Vostok), the bubble sizes decrease with depth.
(a) Mean of the equivalent bubble radius, r. Below 600 m no EDC image data were available at the time of image processing. (b) Specific number profiles of EDC and EDML compared to data from Vostok (Reference Lipenkov and HondohLipenkov, 2000). (c) EDC and EDML specific number profiles compared to SD data presented by EPICA Community Members (2004).

There are two main reasons for the decrease in average bubble size with depth. One is the overburden pressure which increases with depth. The second is the climatic transition from the warm Holocene to the cold last glacial period (LGP) between 10 and 20 ka BP. During this period the temperature dropped by ∼10 K and the concentration of impurities increased 10- to 100-fold (EPICA Community Members, 2004, 2006). The climatic transition occurs in Vostok and EDC between 300 and 500 m depth and in the EDML core between 700 and 1000 m.
In the EDML core, the Holocene/LGP transition coincides with the beginning of the bubble/hydrate transition zone, ∼750 m depth, and consequently the climate-driven change is disturbed by the transformation of bubbles into clathrate hydrates.
Bubble-number profiles
In Figure 5b we compare the Vostok, EDC and EDML profiles of the specific number of bubbles (i.e. number of bubbles per unit mass of bubbly ice) as a function of age. The main source of error in the bubble-number measurements stems from uncertainties in the thickness of the sections, which varied from 4.5 to 5.5 mm. For each sample we assumed an error of 0.5 mm in the thickness measurements, which dominates the systematic errors of misclassification (∼5% omission, no additions) and overexposure (0.5%). Samples without thickness information were discarded.
The significantly higher number of bubbles in the Holocene ice of the EDC core compared to the EDML core agrees with the model of Reference Spencer, Alley and FitzpatrickSpencer and others (2006) regarding the differences in temperature and accumulation between the EDC and EDML sites, as shown in Table 1.
The Vostok core displays an overall higher specific number. Although this may be related to the systematic omission of irregularly shaped bubbles, this omission was quantified to be <5% for depths >200 m and is therefore dominated by the large error bars resulting from the thickness measurements. The higher specific bubble number in Vostok also coincides with a smaller mean bubble size, as would be expected from changes in specific bubble number due to different climate parameters at the firn/ice transition (Reference Spencer, Alley and FitzpatrickSpencer and others, 2006). This points towards a physical reason for the difference in specific bubble number between Vostok and the EPICA cores.
As explained above, the apparent increase in the number of bubbles within the first 200 m, corresponding to 2.5 ka in EDML and 5.9 ka in EDC, is caused by the many irregularly shaped bubbles and large bubble clusters at shallow depths, which are often misclassified as artefacts by our algorithm. However, the increase in the bubble number of EDML from 360 to 560 g − 1 between 10 and 18 ka has a climatic cause: it reflects a change in grain size at the firn/ice transition which is caused by changes in temperature, accumulation and impurity content contemporaneous with the transition from the LGP to the Holocene. Figure 5c compares a temperature proxy (deuterium isotope fraction) from the EDC core with the bubble-number density profile of EDML and EDC. According to Reference Lipenkov and HondohLipenkov (2000) and Reference Spencer, Alley and FitzpatrickSpencer and others (2006), a rise in the number density during the LGP can be attributed either to a decrease in temperature or an increase in accumulation rate. Since the snow accumulation in Antarctica during the LGP was significantly lower than today, the temperature decrease in that period may have counteracted this effect to produce an increase in the number density at EDML. However, this simple model is, strictly speaking, valid only for modern climatic conditions with relatively low impurity contents compared to the LGP. Also unknown is the effect of the temperature gradient metamorphism or a change in the form of precipitation. Diamond dust may have contributed to the accumulation much more than it does today. Furthermore, wind erosion and redistribution of aged snow crystals may be more important. The changed climatic conditions during the LGP, which are not well known, may explain why the behaviour of the number of bubbles is different at Dome C. Only a better mechanistic understanding of the formation of the bubbles can explain the differences between the cores.
Finally, the rapid decrease in the bubble-number density at EDML below 22.4 ka, corresponding to 1000 m depth, is due to the conversion of air bubbles into clathrate hydrates, which starts at 700 m but accelerates rapidly at depths >800 m, where the dissociation pressure of air is reached.
Eccentricity, orientation and estimation of porosity at the firn/ice transition
The eccentricity distributions of all datasets (EDC and EDML, all depths) show a noticeable deviation of the bubble outlines from circles (Fig. 6). For every dataset, >80% of the fitted ellipses with long and short half-axes, a and b, show numerical eccentricity

a greater than 0.3, which is equivalent to an aspect ratio >1.05. This means that we have a range of volume estimates between V max = 4/3πa 2 b and V min = 4/3πb 2 a for the bubble volume, depending on the choice of the third half-axis, which corresponds to a variation of at least 5%.
Eccentricity and orientation distribution for the EDC 204 m sample. The distributions are typical for all samples from 200 to 500 m in both cores.

The two-dimensional (2-D) bubble-orientation distribution density was determined for all EDC and EDML datasets. The 2-D orientation of a bubble is defined as the angle between the bubble’s short half-axis and the ice-core axis. At every depth the orientation distribution clearly peaked around 0°, indicating that almost all bubbles are nearly horizontally elongated. Unfortunately, we cannot quantitatively correlate this elongation with the local ice flow, since we do not have information about the length of the third half-axis of the three-dimensional bubble.
We retrieved the porosity profiles shown in Figure 7. The error bars represent the uncertainty in the thickness of the ice samples, which we assumed to be 0.5 mm. This yields a relative error ranging from 8% to 12%, depending on the thickness of the sample. This dominates the errors due to misclassification (5%) and overexposure (0.5%).
Porosity profiles of the EDML and EDC ice cores. A crude, approximative model for porosity evolution with depth was fitted:
 . The free parameters, P
c, were inferred to range between P
min = 8.62% and P
max = 10.48% for the EDC core and between P
min = 10.56% and P
max = 12.61% for the EDML core.

As a first approximation we determine the porosity, P c, at the firn/ice transition (close-off depth) using a simple linear model. By this we want to illustrate the use of data generated with our software framework to infer quantities such as porosity or air content from microstructural properties of the ice. (More sophisticated models of bubbly ice densification are given by Reference Salamatin, Lipenkov and DuvalSalamatin and others (1997) and Reference Ikeda-Fukazawa, Hondoh, Fukumura, Fukazawa and MaeIkeda-Fukazawa and others (2001), but they are too complicated for our illustrative purpose.)
The pressure of air enclosed in the total volume, V c, of an ensemble of air bubbles at the firn/ice transition is the atmospheric pressure, p c, at the close-off depth. Below the firn/ice transition we assume that the bubbles at a depth z below the ice surface compress under the action of the overburden pressure:

where
 is the average density of polar ice, g = 9.81 m s−
2 is the gravitational acceleration and p
0 is the atmospheric pressure at the ice surface. We used p
0 = 645 hPa for EDC and p
0 = 672 hPa for EDML. Those values were projected to the firn/ice transition 100 m below the surface using the barometric formula with the site parameters shown in Table 1. This gave values of p
c = 653 hPa for EDC and p
c = 682 hPa for EDML. Since the ice load increases continually with depth and the creep of ice into the bubbles is very slow, there exists a pressure lag between the embedded bubbles (with pressure p
b) and the ice matrix:

Studies of the Vostok ice core (Reference Lipenkov and HondohLipenkov, 2000) indicate that below 250 m the bubble pressure can be described by Equation (5) using a constant pressure lag of 0.15 ± 0.10 MPa. In contrast, Reference Gow and MeeseGow and Meese (2007) did not observe a pressure lag in the Siple Dome (Antarctica) core below depths of 300 m. As Siple Dome is 20–30°C warmer than Dronning Maud Land, Dome C or Vostok, we assume a pressure lag as derived for Vostok. On the one hand, colder ice may show such a pressure lag and, on the other, the difference in the absolute pressure inside the air bubbles as predicted by the two models is only ∼3% for a depth of 500 m. Although the relative error in Reference Lipenkov and HondohLipenkov’s (2000) value is relatively large (due to the difficulty of direct pressure measurements in bubbly ice) we decided to use the given mean value of p lag = 0.15 MPa in our model. Thus, under this assumption, Equations (4) and (5) yield a simple linear relation between bubble pressure and depth.
Considering again the bubble ensemble with total volume, V c, at the firn/ice transition, the ideal gas law gives us the following relation for the total volume, V b(z), of the air bubbles at depth z below the snow surface:

Finally, assuming that ice is incompressible and the change in the ice volume fraction caused by compression of the bubbles is negligible (this simplification causes an error not greater than a few per cent), we can divide Equation (6) by the total bubbly ice volume and obtain the following approximate relation for porosity, P(z), as a function of depth:

Thus, we can use the porosity values, P(z), derived from air-bubble data of the EDC and EDML cores in the depth range 200–500 m to estimate the close-off porosities, P c, in the past.
Based on this simple model, we recovered past close-off porosities between P min = 8.62% and P max = 10.48% for the EDC core and between P min = 10.56% and P max = 12.61% for the EDML core. These values agree to within 10% of the value presented by Reference Freitag, Kipfstuhl and LamprechtFreitag and others (2005), which was determined from measurements using X-ray microcomputer tomography. The good agreement of this simple model makes us confident that more sophisticated models of bubbly ice compression may provide reliable estimates of the past close-off porosity. This should be further analysed by applying more sophisticated models to our data and using our framework to obtain similar profiles of future ice cores.
Conclusions
We have introduced a new software framework for the automatic processing and analysis of digital photomicrographs of thick ice-core sections exhibiting bubble-like features. The software can construct mosaic images of partly overlapping micrographs and extract a wide variety of information about bubble shapes and distributions. The advantage of our approach is the ease and efficient evaluation of large amounts of image data, eliminating the risk of introducing bias by manual selection of data subsets. Within a few minutes the software can process a dataset of many hundreds of micrographs on a standard computer. This offers the possibility for on-site processing and entire depth coverage of the microstructural information contained in air-bubble ensembles.
The first application on available thick-section micrographs proved the applicability of our framework to studies of air bubbles within the EDC and EDML ice cores. We were able to show the presence of microbubbles in both the EDML and EDC cores. By plotting the bubble-size distribution for different depths we could observe the qualitative changes in the distribution of normal bubbles and micro-bubbles with depth.
While the bubble-size profiles for EDML and EDC followed our expectations, and were similar to data from the Vostok core, the number density profile of the EDC core did not show the increase at the LGP/Holocene transition that we expected according to Reference Spencer, Alley and FitzpatrickSpencer and others (2006). In the EDML core the number density increased over the LGP/Holocene transition from 360 to 560 g − 1. This behaviour was not found in the EDC core.
In addition, we estimated the porosity of the samples based on our 2-D data of the bubble distribution. The obtained porosity profiles were used to infer the porosity at the firn/ice transition employing a simple linear model describing densification of bubbly ice. The deduced porosity values at the firn/ice transition were found to range from 8.62% to 10.48% for the EDC core and from 10.56% to 12.61 % for the EDML core. These encouraging results show that, in principle, the measured ice porosity can be projected back to infer the former porosity at the firn/ice transition. Dedicated application of this attempt, however, requires a more sophisticated model of the densification process of bubbly glacier ice.
Acknowledgements
We thank I. Weikusat for insightful discussions on ice microstructure and D. Kondermann for invaluable advice on digital image processing and some very helpful code snippets. V.B., J.F., S.K. and S.H.F. acknowledge support from the German Research Foundation (DFG) through grant FA 840/1-1 of the Priority Program SPP-1158. This work is a contribution to the European Project for Ice Coring in Antarctica (EPICA), a joint European Science Foundation/European Commission scientific programme, funded by the European Union and by national contributions from Belgium, Denmark, France, Germany, Italy, the Netherlands, Norway, Sweden, Switzerland and the United Kingdom. The main logistical support was provided by Institut Polaire Français–Emile Victor (IPEV) and Programma Nazionale di Richerche in Antartide (PNRA) (at Dome C) and the Alfred Wegener Institute (at Dronning Maud Land). This is EPICA publication No. 248.



