





1. Introduction
As the global average temperature increases, with its dramatic effects, attention to climate change is growing year after year. Scientists and NGOs are not the only ones urging a definitive stop to greenhouse gas (GHG) emissions. Since 2015, several governments have declared their intention to embrace a more sustainable course for the planet, society, and the economy, after the ratification of the UN 2030 Agenda for Sustainable Development and the Paris Agreement on Climate Change. Furthermore, with regard to climate change-related disasters, for example, in the EU, the cost was around 738 billion euros (2023 prices) in terms of economic losses of assets, in the period 1980–2023 (European Environment Agency, 2024). Climate scientists maintain that extreme events due to climate change are increasing in both frequency and intensity, with all the associated risks (IPCC, Reference Masson-Delmotte, Zhai, Pörtner, Roberts, Skea, Shukla, Pirani, Moufouma-Okia, Péan, Pidcock, Connors, Matthews, Chen, Zhou, Gomis, Lonnoy, Maycock, Tignor and Waterfield2018). Adaptation, then, is fundamental too.
Mitigating climate change represents an inside-out perspective on a company's commitments to reduce its impact on the natural environment, while adaptation represents the response a company implements to actual or expected changes in the natural environment, taking an outside-in perspective (Schmidt et al., Reference Schmidt, Bergmann, Hillmann and Guenther2018). Recent research calls for implementing both mitigation and adaptation measures (AMs) as part of a comprehensive climate change strategy in order to achieve a competitive advantage and sustained success (Beermann, Reference Beermann2011; Linnenluecke & Griffiths, Reference Linnenluecke and Griffiths2010; Monika et al., Reference Monika, Kirchgeorg, Griffiths, Linnenluecke and Günther2011). In other words, companies, by recognizing their embeddedness in ecological ecosystems, should aim to maintain ecosystem functions and services (Winn & Pogutz, Reference Winn and Pogutz2013), thereby avoiding compromising the business operations that depend on these functions and services. Then, in this way, industrial resilience will be achieved. However, when studying organizational resilience, management academics, for the most part, either focus on the ability of an organization to handle and recover from the negative effects of external shocks, such as economic or technological jolts rather than natural disasters (Mithani et al., Reference Mithani, Gopalakrishnan and Santoro2021), or, when focusing on the negative effects of climate-related physical events, consider it a desired outcome of adaptation responses (Unter et al., Reference Unter, Park and Rivera2024; Villano et al., Reference Villano, Colli, Martellozzo and Lombardi2026).
According to organizational and strategic literature on corporate responses to climate change, mitigation and adaptation have two strategic intents (Todaro et al., Reference Todaro, Testa, Daddi and Iraldo2021) and, therefore, have mainly been discussed as two separate topics (Schmidt et al., Reference Schmidt, Bergmann, Hillmann and Guenther2018). Academics have found that the main contextual antecedents of a company's climate mitigation are usually regulatory and market changes, technological changes, and, lastly, ecosystem changes induced by climate change (Kouloukoui et al., Reference Kouloukoui, de Marcellis-Warin, Armellini, Warin and Torres2021), while the main contextual antecedents of a company’s climate adaptation are usually ecosystem changes induced by climate change (Gasbarro et al., Reference Gasbarro, Rizzi and Frey2016; Xia, Reference Xia2025). Studies on a comprehensive climate change strategy are scarce, especially those that apply a resilience-theory lens (Unter et al., Reference Unter, Park and Rivera2024).
This study, then, aims to identify the most important drivers of corporate responses to climate change, considering both mitigation and adaptation responses, taken separately and together, and to compare different kinds of contextual drivers. By analyzing a sample of 5,910 companies that responded to the Carbon Disclosure Project (CDP) questionnaire in 2021 using logistic regression, we found that companies that perceive climate-related physical risks are more likely to define a low-carbon transition plan (LCTP), adaptation measures (AMs), or both. Other climate-related risks (e.g., technology risk) are also drivers of AMs and of a comprehensive climate strategy. This might suggest that companies recognize their dependence on natural ecosystems and are adopting comprehensive climate risk management when defining both mitigation and AMs. Therefore, we support the idea of reconsidering organization theory toward a mitigation and adaptation resilience-based view, and we propose a conceptual framework to interpret the business response to climate change.
This paper has the following structure: the study hypotheses are based on a theoretical framework and a review of the literature about the causes of business responses to climate change, which are presented in the next section. After that, we outline the methodology, showing the source of the data, the measurements adopted, and the model used, and we present the results. We then discuss our findings. Finally, as we approach the conclusion, we provide theoretical and policy recommendations.
2. Theoretical background
2.1. The drivers of business mitigation of climate change
Mitigation of climate change can be defined as: ‘human intervention to reduce the sources or enhance the sinks of greenhouse gases (GHGs)’ (IPCC, 2014a). Therefore, climate change mitigation refers to efforts by actors to reduce their impact on the natural environment. For organizations, this encompasses all measures taken to limit GHG emissions (Weinhofer & Busch, Reference Weinhofer and Busch2013) or to compensate for them (Kolk & Pinkse, Reference Kolk and Pinkse2004). The reduction of GHG emissions is often included in eco-efficiency efforts aimed at reducing a business’s environmental impact while achieving energy and resource efficiency and cost reductions (Jouni & Seager, Reference Jouni and Seager2008). Management academics studying climate change mitigation responses found that the main contextual antecedents of this kind of response are institutional pressures, such as regulatory, market, technological, and ecosystem changes, which, in turn, may represent either risks or opportunities for companies (Gasbarro et al., Reference Gasbarro, Iraldo and Daddi2017). Several studies have investigated the role of regulatory pressure in the adoption of mitigation strategies, yielding mixed results. The introduction of climate policies that regulate product or process emissions usually triggers changes in business practices to achieve regulatory compliance (Dhanda et al., Reference Dhanda, Sarkis and Dhavale2022). Okereke (Reference Okereke2007) reported that UK FTSE 100 firms recognized the role of existing national and international regulations in driving their carbon management. Investigating the drivers of the adoption of a low-carbon strategy in Canadian oil and gas firms, de Abreu et al. (Reference de Abreu, Webb, Araújo and Cavalcante2021) found that command-and-control policies have a decisive influence on corporate choices. Studying European high-emitting industries, Littlewood et al. (Reference Littlewood, Decelis, Hillenbrand and Holt2018) showed that low-carbon regulations exert pressure to adopt mitigation measures. However, other studies have shown that regulations are less effective at pushing companies to adopt mitigation strategies. For instance, Matthias and Baumgartner (Reference Matthias and Baumgartner2018) showed that in the automotive industry, climate regulations are not associated with a higher corporate mitigation response. This result is also supported by Daddi et al. (Reference Daddi, Bleischwitz, Maria Todaro, Gusmerotti and De Giacomo2020), who highlighted the ineffectiveness of coercive regulatory pressures in driving the adoption of proactive mitigation strategies. These differences can be due to the different sectors and variables investigated (e.g., mitigation measures). On the one hand, some sectors receive closer regulatory scrutiny due to their contribution to global warming, such as oil and gas (Heede, Reference Heede2014). On the other hand, climate mitigation encompasses several measures, ranging from low levels of climate action (e.g., setting a limited low-carbon target) to high levels (e.g., setting a carbon-neutrality target).
Market changes appear to strongly influence climate change mitigation strategies (Cadez et al., Reference Cadez, Czerny and Letmathe2019). Customer demand could shift toward climate-friendly products, and if there is a major market transition, companies may want to reconsider their carbon management practices, regardless of their ethics (Hoffman, Reference Hoffman2005). Competition dynamics prompt companies to adopt mitigation measures through imitation or conformity to industry standards (Daddi et al., Reference Daddi, Bleischwitz, Maria Todaro, Gusmerotti and De Giacomo2020). Another important driver of a company’s mitigation response to climate change is technological change, as it is the primary means of achieving significant carbon and cost reductions (Okereke, Reference Okereke2007).
Regarding the physical risks posed by climate change, Tashman and Rivera (Reference Tashman and Rivera2016) found that ecological uncertainty in the US ski industry did not drive mitigation practices. However, recent studies have shown that mitigation responses can also be driven by the risk of resource scarcity (de Abreu et al., Reference de Abreu, Webb, Araújo and Cavalcante2021).
Therefore, we suggest the following hypotheses:
Hypothesis 1. The implementation of a climate change mitigation strategy is driven by the corporate perception of regulatory risk.
Hypothesis 2. The implementation of a climate change mitigation strategy is driven by the corporate perception of physical risk.
Hypothesis 3. The implementation of a climate change mitigation strategy is driven by the corporate perception of other climate-related risks.
2.2. The drivers of organizational adaptation to climate change
According to the IPCC (2014b), adaptation to climate change can be defined as ‘the process of adjustment to actual or expected climate and its effects to moderate or avoid harm or exploit beneficial opportunities’. This definition encompasses all measures aimed at addressing the impacts of climate-related physical events (e.g., extreme weather events, droughts, heatwaves, and cold waves) and the resulting changes in the natural environment.
However, the concept of adaptation is not new in organizational literature, and it has been widely debated in the past (Benischke et al., Reference Benischke, D'Ippolito, Sharma and Wickert2025). It encompasses the organizational changes in response to changing environments. The main theoretical frameworks (e.g., contingency theory, institutional theory, and the theory of organizational learning) suggest that organizational structures should align with external environments, including competitive, macroeconomic, and political contexts, to achieve higher performance or organizational survival (Singh et al., Reference Singh, House and Tucker1986).
Previous debates about organizational adaptation assume that the natural environment is stable and does not affect organizational life (Monika et al., Reference Monika, Kirchgeorg, Griffiths, Linnenluecke and Günther2011). The business environment usually encompasses regulatory, economic, cultural, socio-demographic, and technological conditions, overlooking the natural context and its changes; therefore, adaptation in such contexts implies implementing measures to fit, for instance, through cost savings, lobbying, or investing in technological innovation or sustainability reporting (Linnenluecke et al., Reference Linnenluecke, Griffiths and Winn2013). Another assumption made in the organizational literature is that once a discontinuity affects the business environment and once an organization has dealt with this change (e.g., Meyer, Reference Meyer1982; Tushman & Anderson, Reference Tushman and Anderson1986), the business environment returns to a new stable equilibrium (Linnenluecke & Griffiths, Reference Linnenluecke and Griffiths2010). However, climate change cannot be compared to the changes related to the business environment that have been studied in organizational literature because it is expected to have greater spatial scope and temporal scale, ‘discontinuous’ characteristics, unpredictability, irreversibility, and destructive impacts on the natural environments (Monika et al., Reference Monika, Kirchgeorg, Griffiths, Linnenluecke and Günther2011) on which the socioeconomic systems rely (Frey et al., Reference Frey, Gusmerotti and Pogutz2017; Winn & Pogutz, Reference Winn and Pogutz2013). This means, for instance, that after a climate-related extreme weather event, organizations may not rely on climate or weather stability because further events may occur, leading to large-scale destruction and consequences for the organization’s ability to recover and survive (Linnenluecke & Griffiths, Reference Linnenluecke and Griffiths2010). Companies’ AMs to climate change encompass risk assessment, technical solutions, risk sharing and shifting, disaster relief and continuity, reducing geographical exposure, portfolio diversification, and cooperation (Pinkse & Gasbarro, Reference Pinkse and Gasbarro2019).
Many authors have tried to shed light on the antecedents of business adaptation to climate change, especially on internal factors, such as awareness and vulnerability (Gasbarro & Pinkse, Reference Gasbarro and Pinkse2016; Hoffmann et al., Reference Hoffmann, Sprengel, Ziegler, Kolb and Abegg2009); organizational capabilities (Busch, Reference Busch2011); the capacity to adapt and the reliance on the impacted business (Hoffmann et al., Reference Hoffmann, Sprengel, Ziegler, Kolb and Abegg2009); managerial cognition and emotions (Bleda & Pinkse, Reference Bleda and Pinkse2023); previous experience with climate events (Pinkse & Gasbarro, Reference Pinkse and Gasbarro2019); and environmental attitudes and climate change knowledge (Josephine & Linnenluecke, Reference Josephine and Linnenluecke2016).
The studies on business adaptation to climate change share a common assumption. That adaptation is mainly implemented in response to present or future changes in the natural environment (Linnenluecke et al., Reference Linnenluecke, Griffiths and Winn2012). For example, the study by Tashman and Rivera (Reference Tashman and Rivera2016) on the US ski industry revealed that companies managed ecological uncertainty (i.e., uncertainty about snowpack levels) through AMs that increased natural resource consumption. However, it was shown that AMs are driven not only by climate-related physical changes but also by other contextual factors, such as expected changes in markets and policy conditions (Danese & De Marchi, Reference Danese and De Marchi2024; Frans et al., Reference Frans, Hertin and Gann2006). For example, if, as is expected and as a consequence of the warmer temperatures at higher latitudes, tropical diseases expand into these areas, the demand for pharmaceutical products will increase (Packard & Reinhardt, Reference Packard and Reinhardt2000). A rise in temperature usually results in increased demand for water and electricity during the summer, which drives adaptation responses from water and electric utilities (Gasbarro et al., Reference Gasbarro, Rizzi and Frey2016). In addition, regulatory changes aimed at restricting natural resource consumption may be introduced in response to resource scarcity, which, in turn, would affect siting and long-term investment decisions (Gasbarro et al., Reference Gasbarro, Rizzi and Frey2016). However, it has been shown that regulatory pressures may be less effective at triggering adaptation than competitive dynamics (Daddi et al., Reference Daddi, Bleischwitz, Maria Todaro, Gusmerotti and De Giacomo2020).
Therefore, we suggest the following hypotheses:
Hypothesis 4. The implementation of a climate change adaptation strategy is driven by the corporate perception of regulatory risk.
Hypothesis 5. The implementation of a climate change adaptation strategy is driven by the corporate perception of physical risk.
Hypothesis 6. The implementation of a climate change adaptation strategy is driven by the corporate perception of other climate-related risks.
2.3. The drivers of a comprehensive organizational climate change response
According to recent research, to gain a competitive edge and maintain success, both mitigation and AMs must be implemented (Beermann, Reference Beermann2011; Monika et al., Reference Monika, Kirchgeorg, Griffiths, Linnenluecke and Günther2011). Mitigation measures aim to limit the probability of occurrence (and intensity), while AMs are meant to moderate or avoid harm (Swart & Raes, Reference Swart and Raes2007).
Hence, mitigation is fundamental to reducing pressure on the natural system, which, in turn, would reduce pressure on the human system and buy time for adaptation (IPCC, 2001). But since climate change is already occurring, mitigation efforts can only limit these changes and affect the extent, timing, and pace of adaptation; adaptation is therefore fundamental, even though it will not be possible to avoid all damage (IPCC, 2014b). One could argue that a single company can make only a limited contribution to curbing global GHG emissions; however, companies are directly and indirectly responsible for their GHG emissions, which are sometimes even higher than those of some countries (Heede, Reference Heede2014; Patenaude, Reference Patenaude2011). This implies that they are important players in tackling climate change. For example, in 2010, the GHG emissions of the mining group Rio Tinto were at a level similar to New Zealand’s, whereas ExxonMobil’s emissions exceeded those of Belgium (Patenaude, Reference Patenaude2010). In addition, the industry sector’s direct and indirect global emissions (without considering the energy sector) account for around 32% of total global emissions (IPCC, Reference Edenhofer, Pichs-Madruga, Sokona, Farahani, Kadner, Seyboth, Adler, Baum, Brunner, Eickemeier, Kriemann, Savolainen, Schlömer, von Stechow, Zwickel and Minx2014c).
Regarding climate change disasters, these accounted for 83% of economic losses and 91,455 deaths in the EU (EU-28) from 1980 to 2017 (European Environment Agency, 2019). Economic losses also affect the private sector, so adaptation is crucial. Some studies have shown that certain sectors are more dependent on ecosystem services affected by climate change; therefore, they face severe limitations in adaptation, so mitigation seems to be the best way to avoid the collapse of ecosystems (Clément & Rivera, Reference Clément and Rivera2017). Neither mitigation nor adaptation, taken separately, is sufficient to address the climate risk. They are, rather, two complementary measures of climate risk management (Frey & Gasbarro, Reference Frey, Gasbarro, Filho, Azeiteiro, Azul, Brandli, Özuyar and Wall2019; IPCC, Reference Field, Barros, Dokken, Mach, Mastrandrea, Bilir, Chatterjee, Ebi, Estrada, Genova, Girma, Kissel, Levy, MacCracken, Mastrandrea and White2014d; Swart & Raes, Reference Swart and Raes2007) when companies take an inside-out and outside-in perspective on the ecosystem on which they depend. Mitigation can be considered as indirect loss prevention, while adaptation is direct loss prevention (Verheyen, Reference Verheyen2005). According to Allie et al. (Reference Allie, Turner, Gladstone and Hole2019, p. 21), ‘[a]ppropriate protection and management of ecosystems could serve as a form of insurance against future climate change risks.’ Hence, mitigation and adaptation responses can be seen as two sides of the same coin because they share the general aim of addressing the same problem: changes in the natural environment on which companies rely (Olausson, Reference Olausson2009). However, studies on business responses to climate change, both in terms of mitigation and in terms of adaptation, are rather scarce. Kouloukoui et al. (Reference Kouloukoui, de Marcellis-Warin, Armellini, Warin and Torres2021), with an analysis of CDP responses from French, US, and Brazilian multinational companies, showed that climate regulation influences climate risk management, without a specific focus on other contextual drivers.
Therefore, we hypothesize that a comprehensive response to climate change has the same drivers as the two responses considered separately.
Hence, we suggest the following hypotheses:
Hypothesis 7. The implementation of a comprehensive business response to climate change is driven by the corporate perception of regulatory risk.
Hypothesis 8. The implementation of a comprehensive business response to climate change is driven by the corporate perception of physical risk.
Hypothesis 9. The implementation of a comprehensive business response to climate change is driven by the corporate perception of other climate-related risks.
3. Methodology
3.1. Data and measures
We obtained a company’s perception of climate-related risks from the CDP survey conducted in 2021. The CDP surveys companies, municipalities, countries, and regions on their climate-related risks and opportunities management, water security, and deforestation, and, since 2002, has become a leader in the global environmental disclosure system. CDP databases are widely used as sources of information on a company's climate change disclosure.
A total of 5,910 companies responded to this survey. To investigate the drivers of corporate responses to climate change in terms of risk, we relied on both closed questions and open questions. Specifically, question C2.2a, ‘Which risk types are considered in your organization's climate-related risk assessments – Relevance and inclusion’, was used to derive the risk type, which determines the following variables in our model: Acute physical risk; Chronic physical risk; Current regulation risk; Emerging regulation risk; Legal risk; Market risk; Reputation risk; and Technology risk. These were then nested into three main groups: Regulatory risk (including Current regulation risk and/or Emerging regulation risk); Physical risk (including Acute physical risk and/or Chronic physical risk); and Other climate-related risks (including at least one of the following risks: Legal; Market; Reputation; Technology) following the approach of Gasbarro et al. (Reference Gasbarro, Iraldo and Daddi2017).
The question C3.1, ‘Have climate-related risks and opportunities influenced your organization’s strategy and/or financial planning?’ was used to derive the implementation of mitigation measures. Among the three items: ‘Yes’, ‘No’, and ‘Yes, and we have developed a low-carbon transition plan’, we used only the last one, and the corresponding variable is the LCTP in our model. There are no questions in the questionnaire related to AMs; therefore, we performed text mining using the NVivo software package to identify the themes related to AMs in the following open question: C3.4a, ‘Provide any additional information on how climate-related risks and opportunities have influenced your strategy and financial planning (optional).’ The theme related to water (e.g., water scarcity) was identified through NVivo auto-coding, and the researchers also looked for the presence of the words ‘adaptation’, ‘continuity’, and ‘resilience’. After random checks of the texts to check whether the words referred to the implementation of AMs, the researchers created a variable named AMs, where at least one of the words ‘water’, ‘adaptation’, ‘continuity’, or ‘resilience’ was observed. A new variable, LCTP and AMs, was created to identify whether companies have planned both mitigation and AMs.
We also included control variables, such as the sector and the geographic area. Specifically, the companies responding to the CDP 2021 survey operate in the following sectors: Apparel; Biotech, health care and pharma; Food, beverage, and agriculture; Fossil fuels; Hospitality; Infrastructure; Manufacturing; Materials; Power generation; Retail; Services; and Transportation services. The geographic areas where these companies are located cover all five continents (i.e., Africa, the Americas, Asia, Europe, and Oceania).
All variables in our sample have been dummy-coded: 1 if the variable was present, 0 otherwise.
3.2. Model
We initially used a cross-tabulation and then a binary logistic regression (BLR) with a random intercept to evaluate our hypotheses. The companies were nested at risk and regional levels. In our models, the dependent variables are, respectively: LCTP; AM; and LCTP and AM. The independent variables are all eight risk types and the nested risks. The control variables are the sector and the geographic area at the nested level.
3.3. Data description
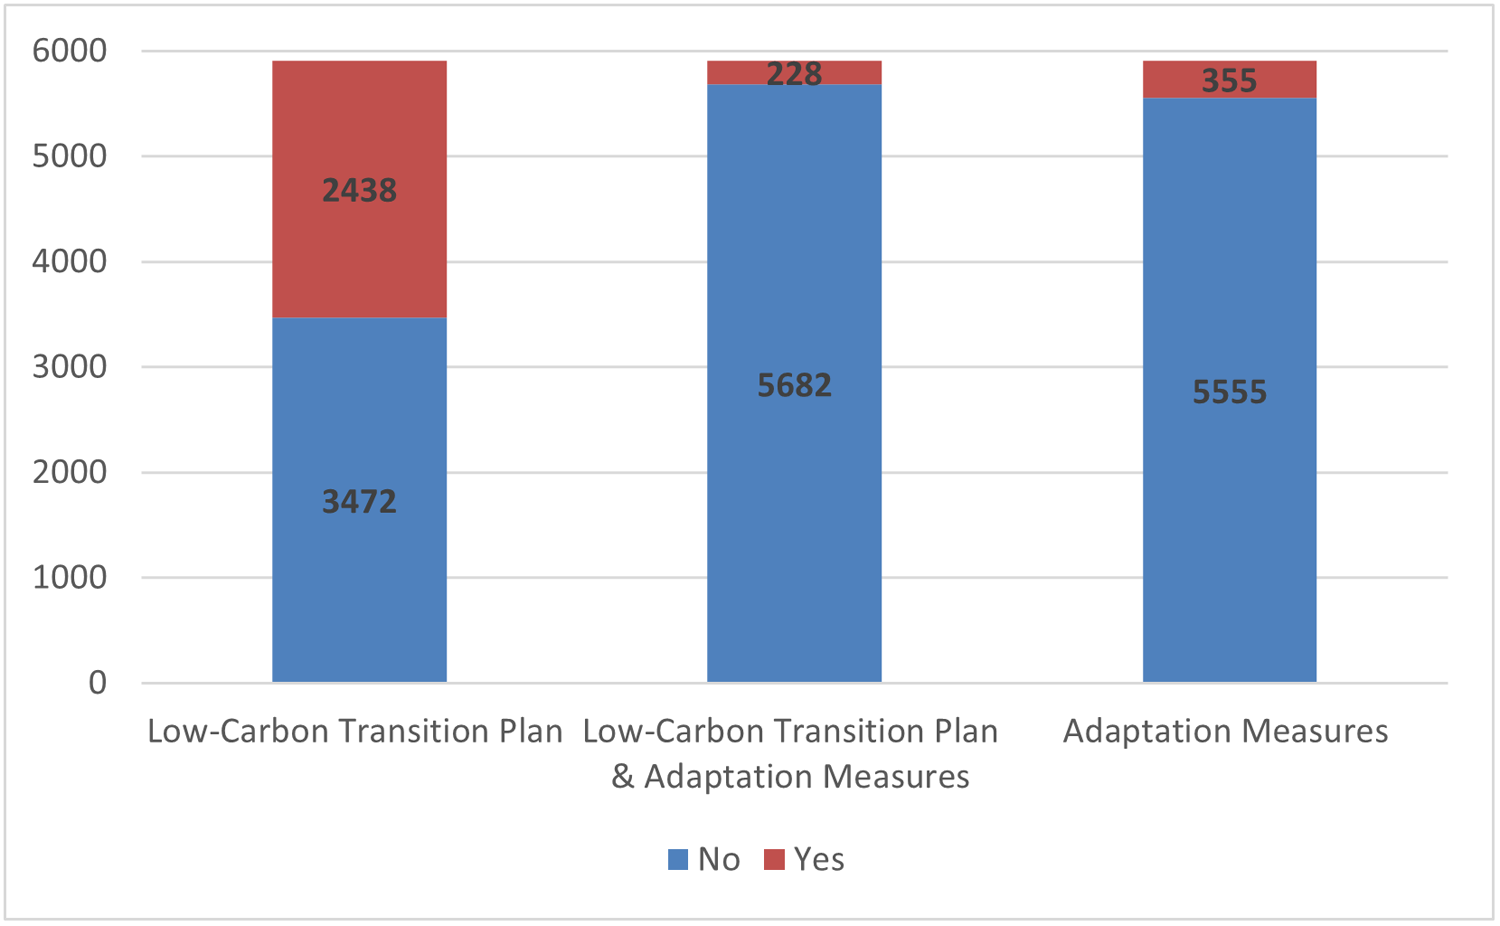
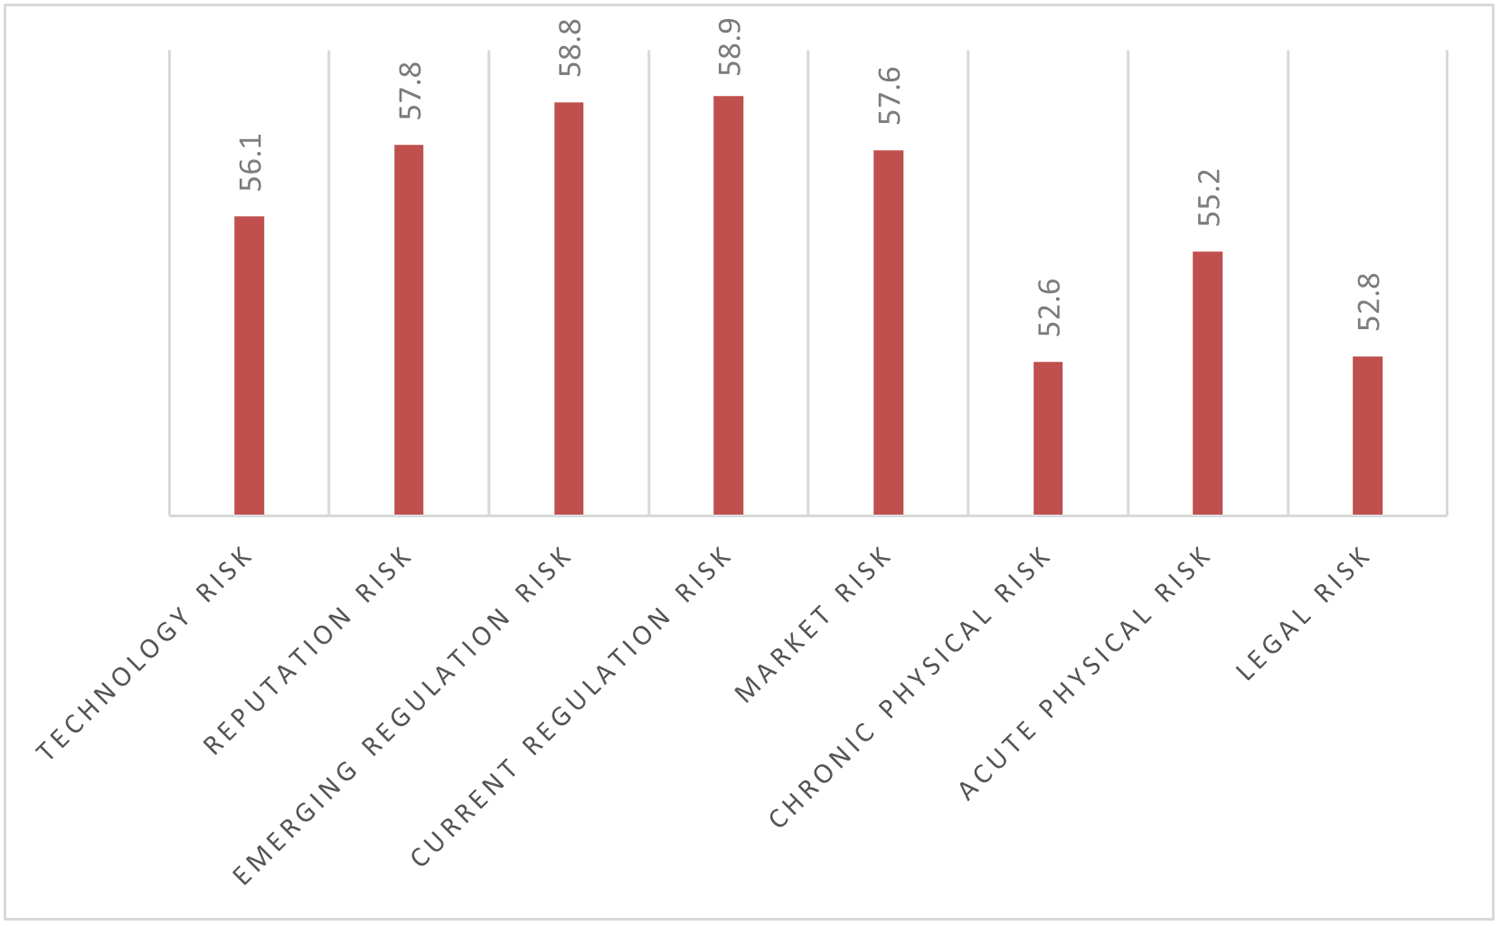
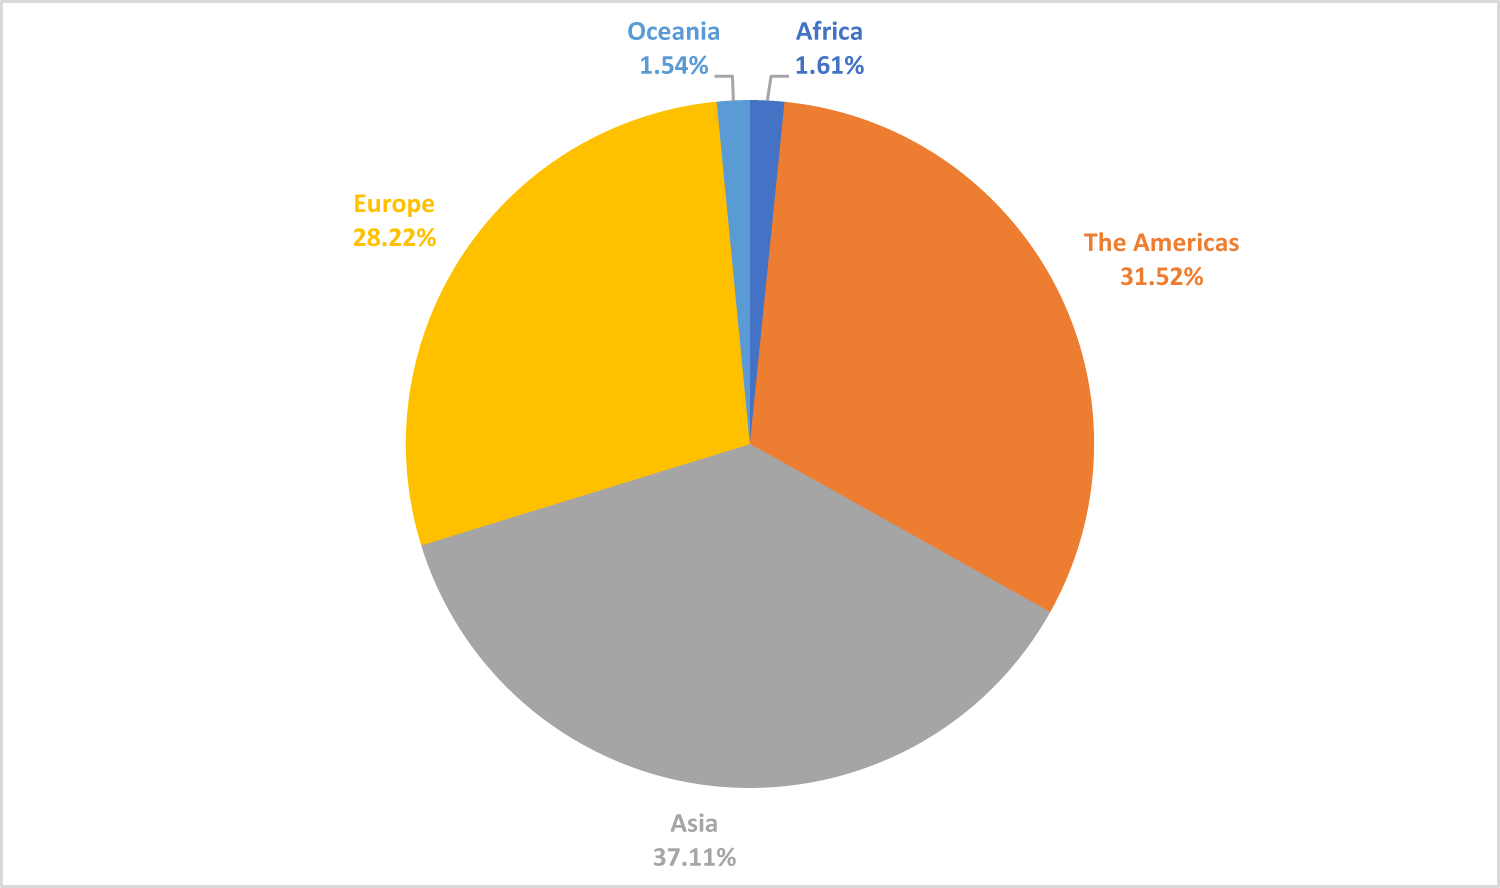
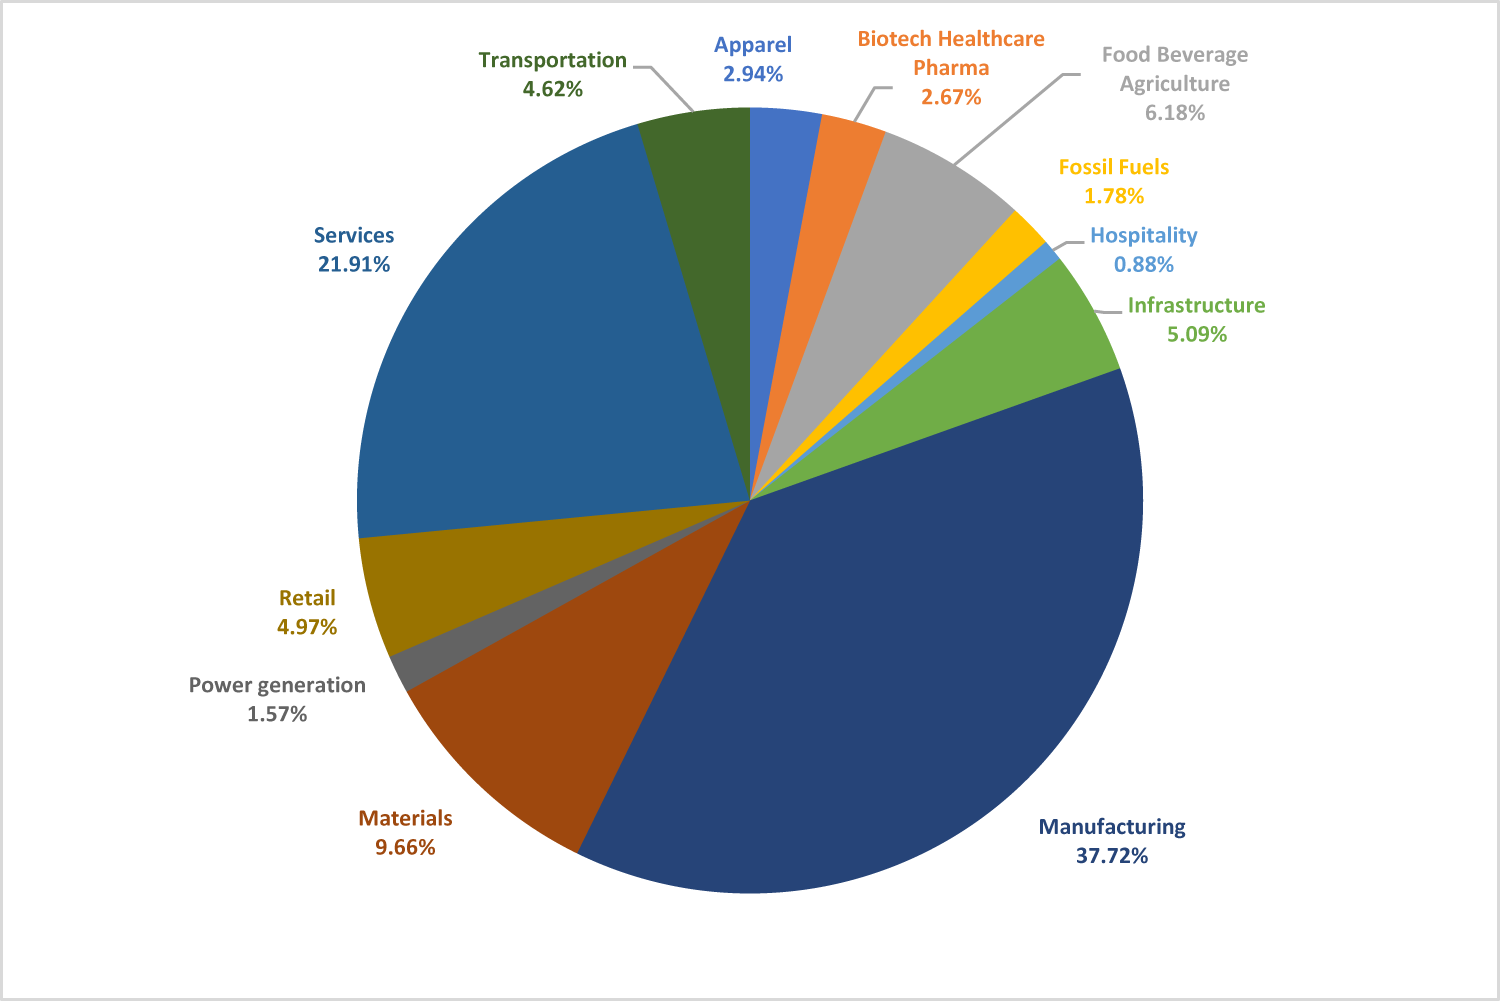
As shown in Figure 1, most companies do not have a LCTP (3,472; 58.7%), AMs (5,555; 94%), or both (5,682; 96.1%). Of the sample, 41.3% have defined a LCTP (2,438), 6% have implemented AMs (355), and 3.9% have defined both LCTP and AMs (228). Regarding the independent variables, most companies perceive Other climate-related risks (60.2%), Regulatory risk (60.1%), or Physical risk (55.9%). In particular, as shown in Figure 2, Current regulation risk is perceived more frequently in our sample (58.9%), while Chronic physical risk is perceived less frequently (52.6%). In our sample, 37.1% of respondents are headquartered in Asia, 31.5% in the Americas, 28.2% in Europe, and the remaining are in Africa (1.6%) and Oceania (1.5%; Figure 3). Most companies operate in the Manufacturing (37.7%) and Services (21.9%) sectors (Figure 4).
Frequencies of climate measures.

Percentage of companies by risk type.

Percentage of companies by continent.

Percentage of companies by sector.

Figure 4 Long description
Percentage of companies by Sector. Manufacturing, 37.72 percent. Services, 21.91 percent. Materials, 9.66 percent. Food Beverage Agriculture, 6.18 percent. Infrastructure, 5.09 percent. Retail, 4.97 percent. Transportation, 4.62 percent. Apparel, 2.94 percent. Biotech Healthcare Pharma, 2.67 percent. Fossil Fuels, 1.78 percent. Power generation, 1.57 percent. Hospitality, 0.88 percent.
4. Results
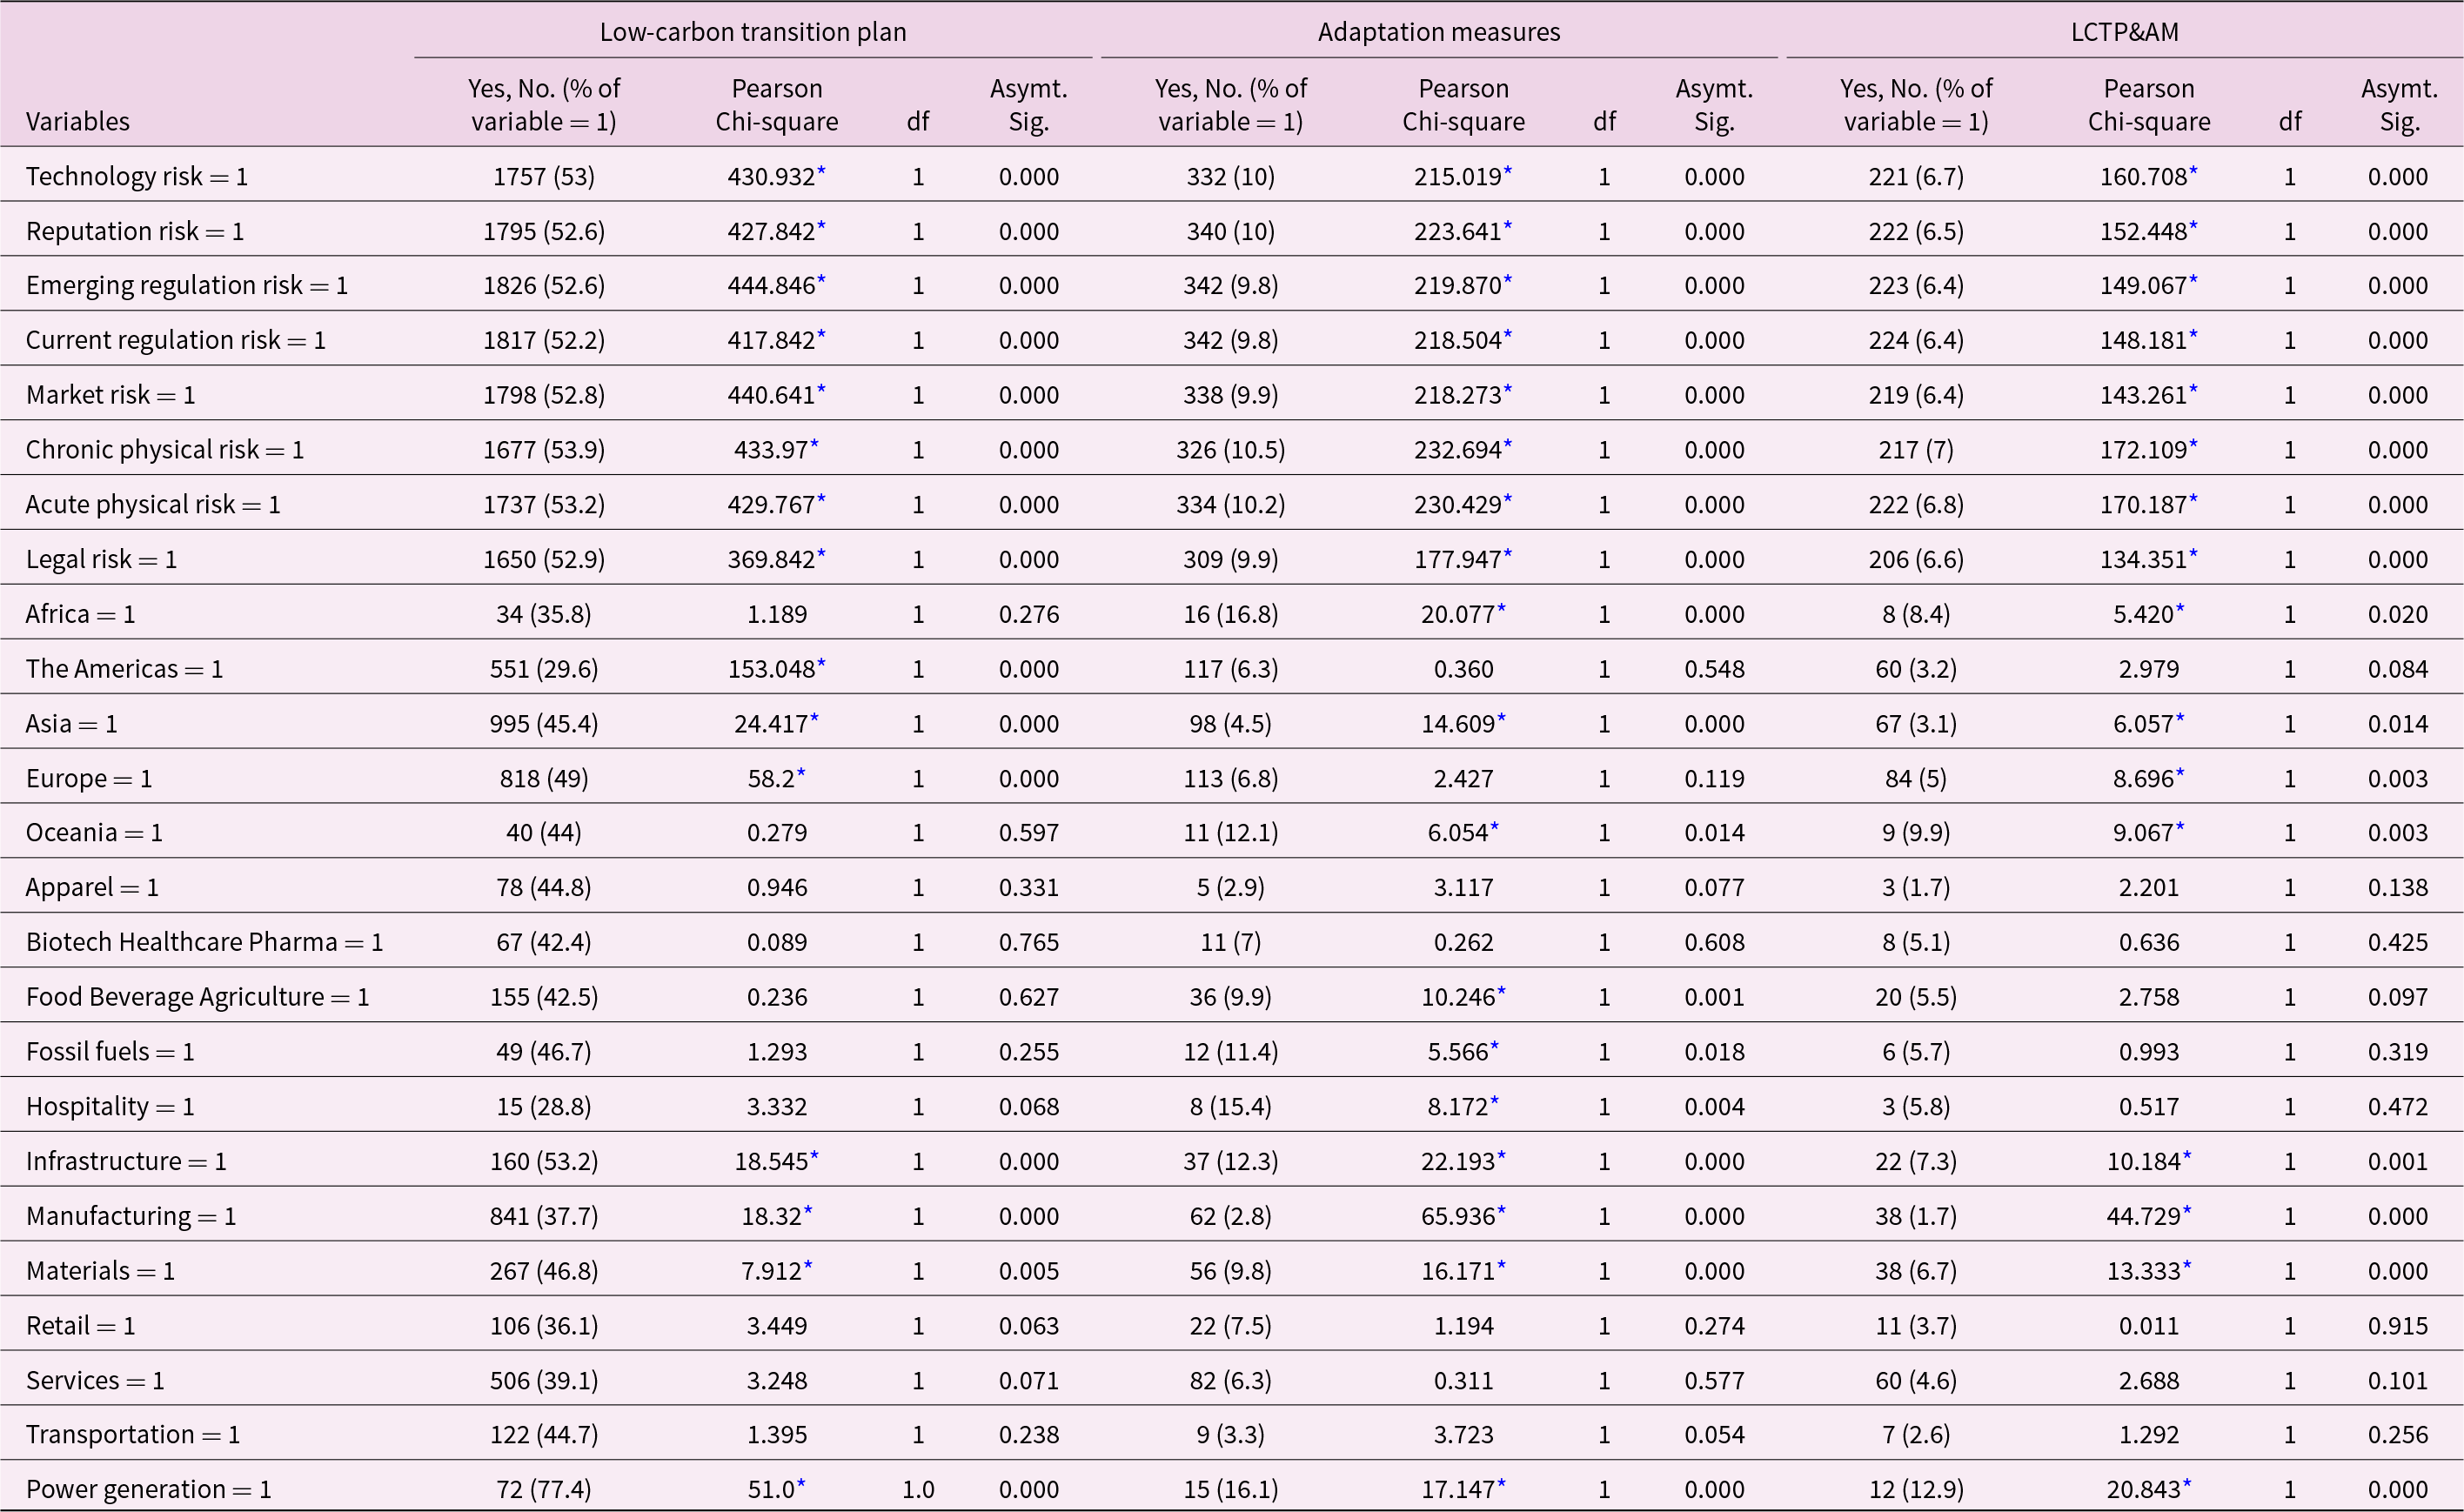
Table 1 presents the results of cross-tabulations of the dependent variables by risks, regions, and sectors. All risks are associated with the three climate-related strategies (p < 0.05). However, not all regions or sectors are associated with all strategies. The control variables without significant associations with the independent variables were not included in the BLR models. The Americas, Asia, Europe, Infrastructure, Manufacturing, Materials, and Power generation are associated with the definition of LCTP (p < 0.05). Africa, Asia, Oceania, Food beverage and agriculture, Fossil fuels, Hospitality, Infrastructure, Manufacturing, Materials, and Power generation are associated with the definition of AM (p < 0.05). Africa, Asia, Europe, Oceania, Infrastructure, Manufacturing, Materials, and Power generation are associated with the definition of LCTP and AM (p < 0.05). We conducted further analysis to determine whether certain variables have greater predictive power.
Type of strategy by variable – no. firms (percentage) and cross-tabulation

Table 1 Long description
Table 1 displays cross-tabulation, frequency distributions, and Chi-square tests of association for three climate-related strategies: Low-Carbon Transition Plan (LCTP), Adaptation Measures (AM), and both combined (LCTP&AM). The table is organized into three main variable categories: 1) Climate-Related Risks, which include individual risk categories (Technology, Reputation, Emerging regulation, Current regulation, Market, Chronic physical, Acute physical, and Legal risks); 2) Geographical Regions, which include breakdown by region (Africa, the Americas, Asia, Europe, and Oceania); and 3) Industrial Sectors, which include breakdown by industry (e.g., Power Generation, Manufacturing, Infrastructure, Materials, Food Beverage Agriculture, Fossil Fuels, Hospitality). For each category and strategy, the table reports firm counts, group-level percentages by strategy, Chi-square statistics (Chi-square), degrees of freedom (df), and p-values indicating statistical significance.
* p < 0.05.
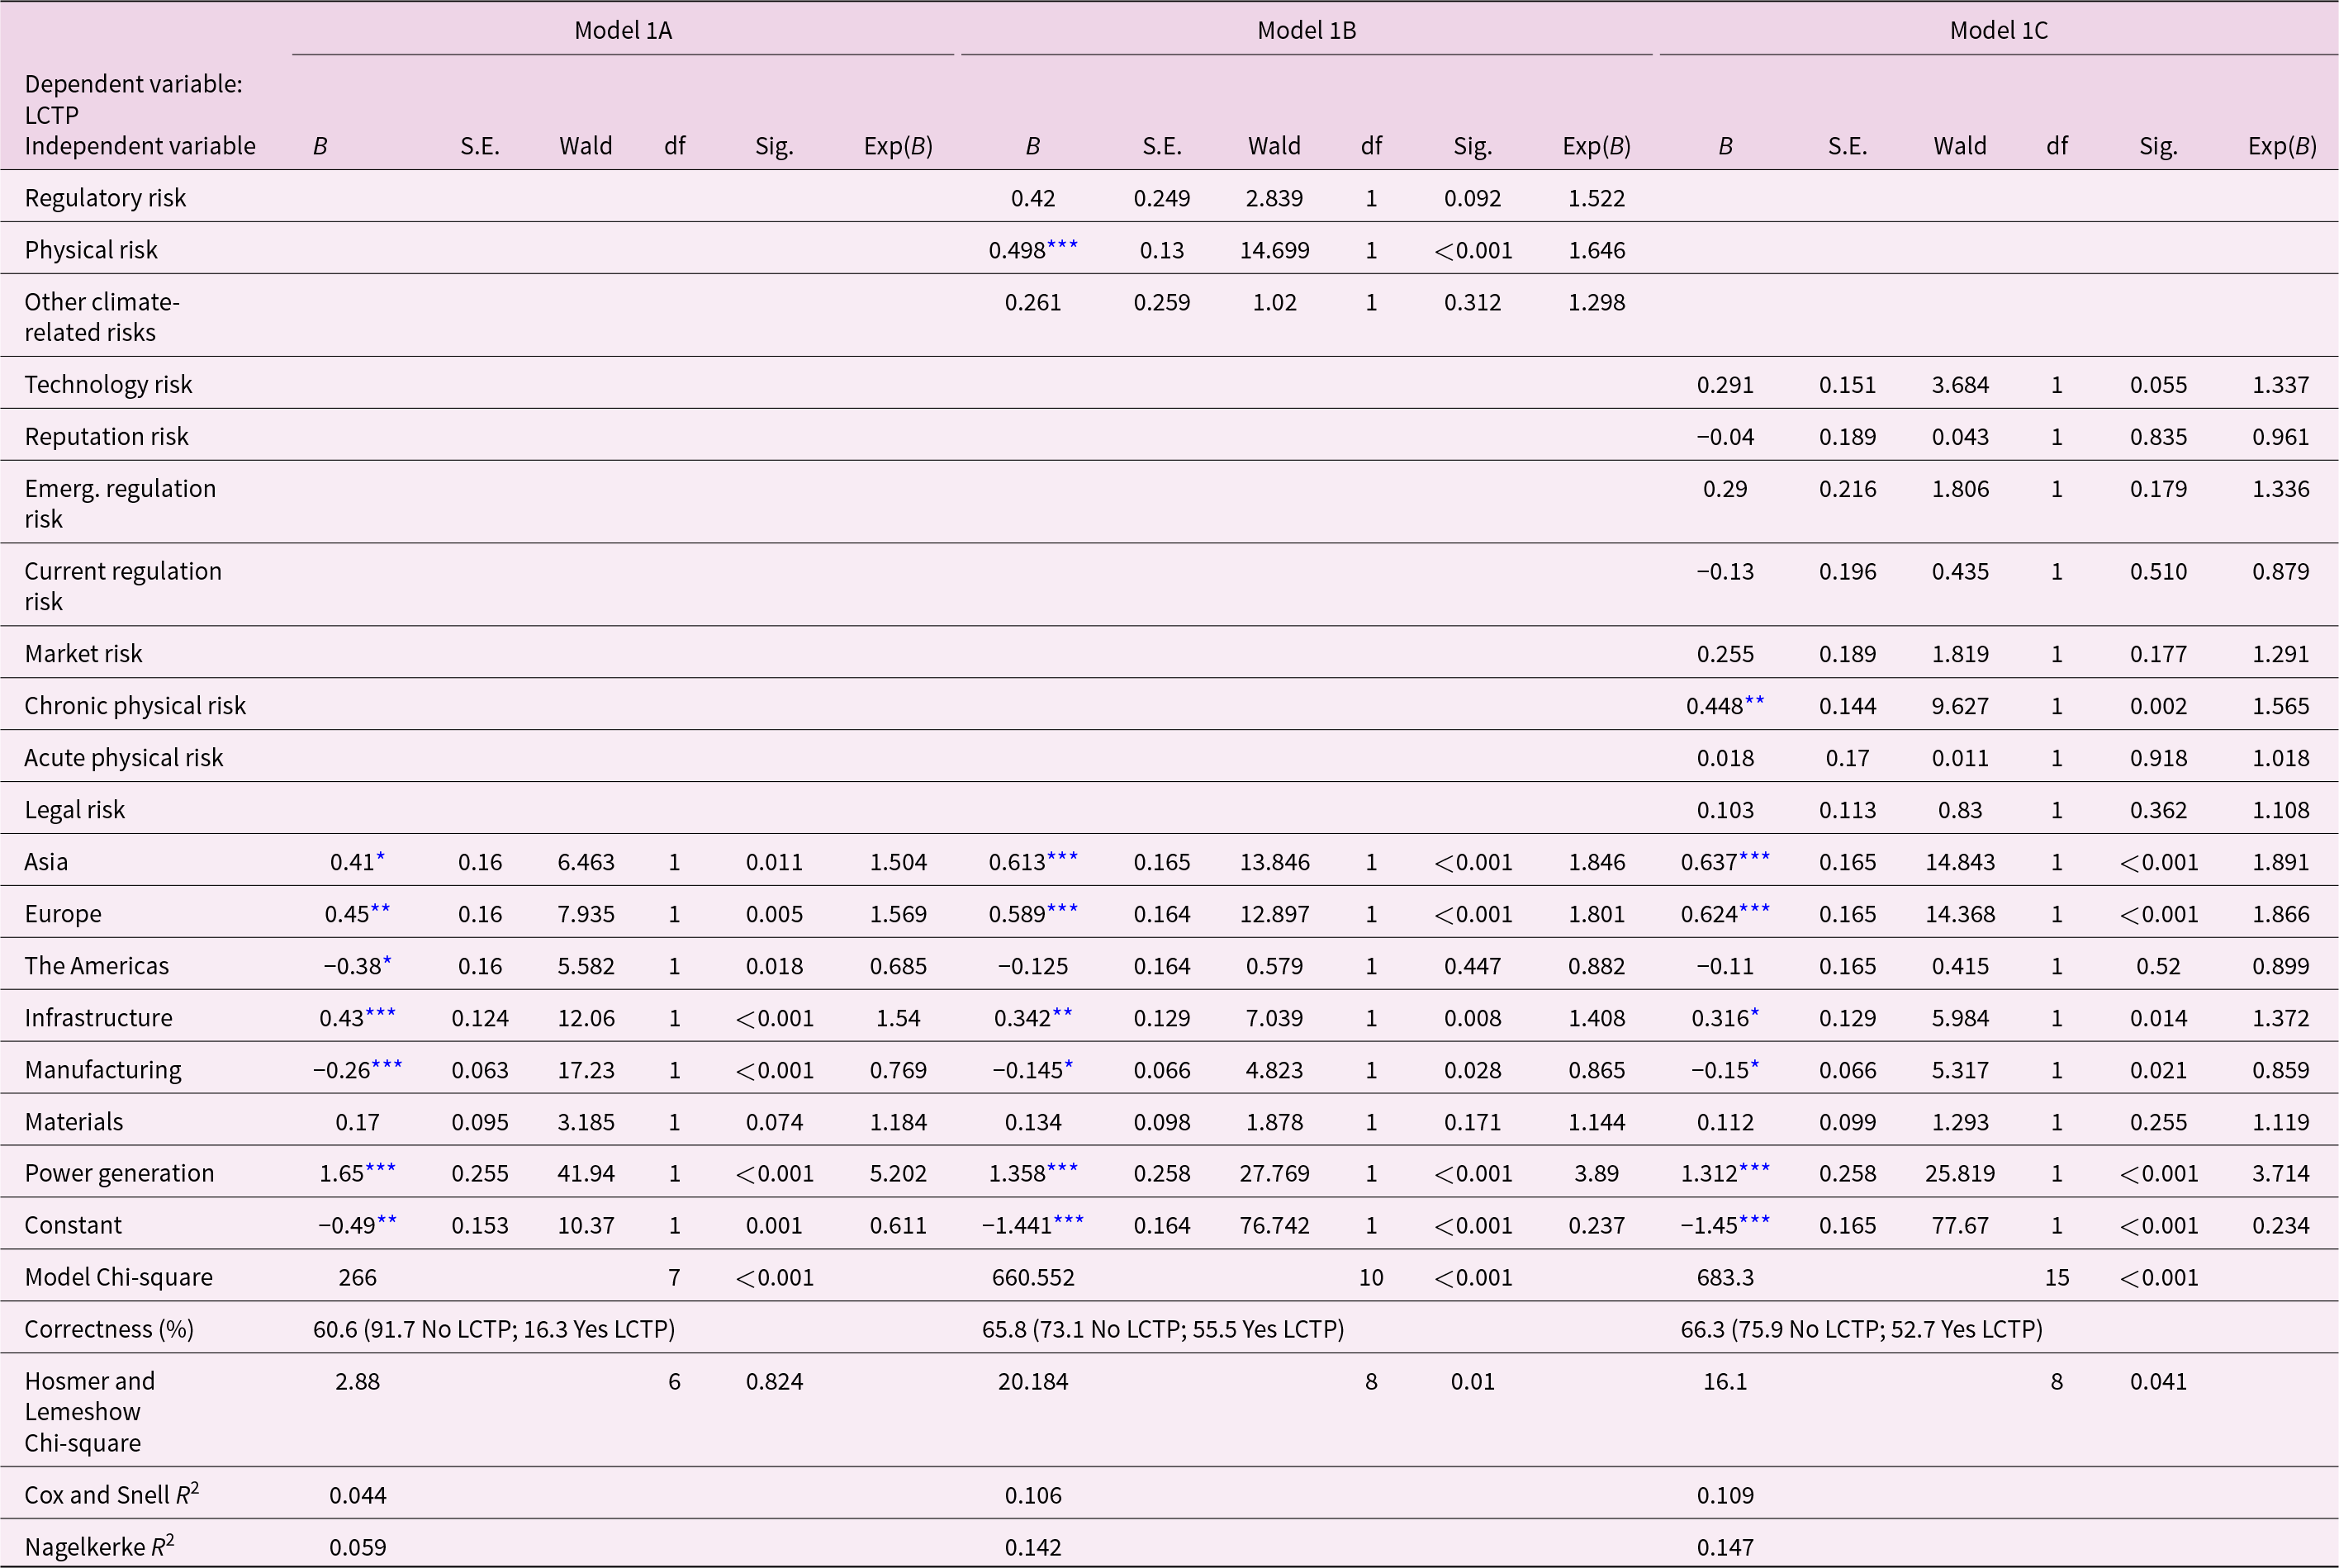
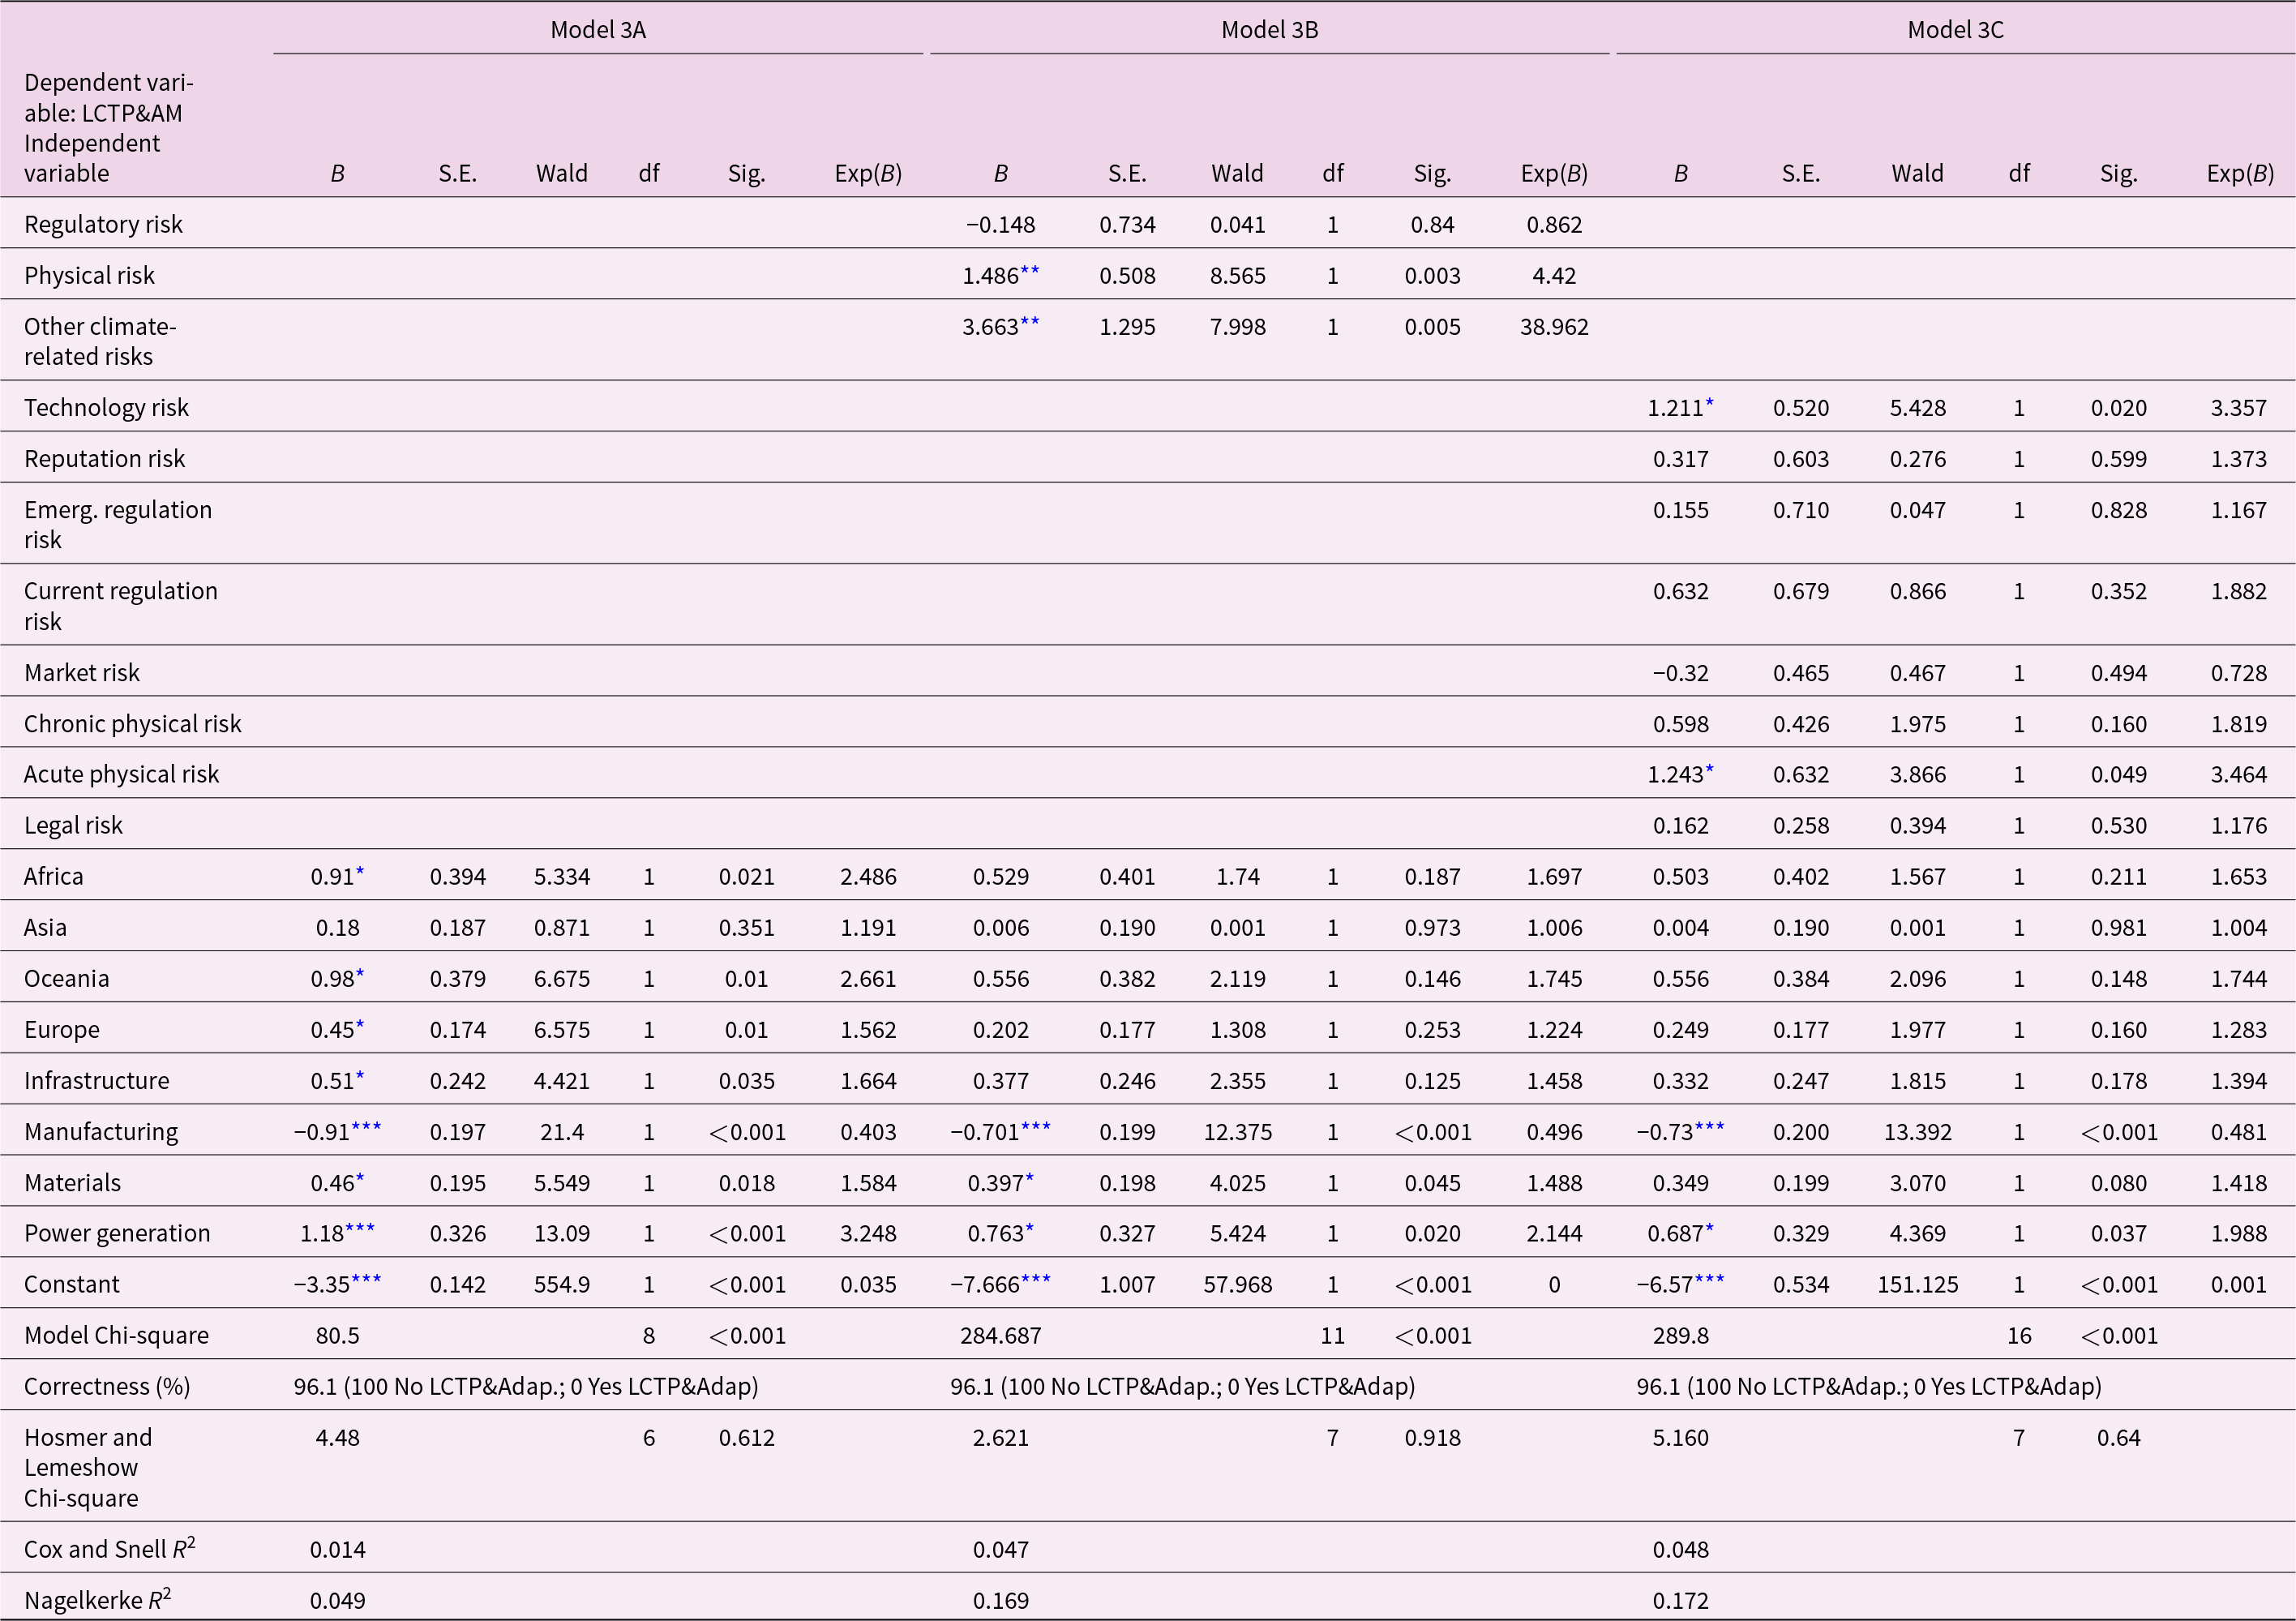
The results of BLR are displayed in Tables 2–4. Models 1A, 1B, and 1C encompass the BLR of the LCTP. Models 2A, 2B, and 2C encompass the BLR of AMs. Models 3A, 3B, and 3C encompass the BLR of LCTP and AMs. Models 1A, 2A, and 3A only include the control variables for each climate strategy. Models 1B, 2B, and 3B add the nested risks. Models 1C, 2C, and 3C substitute the nested risks with specific risks for each climate strategy.
Binary logistic regression of low-carbon transition plan (LCTP)

Table 2 Long description
Table 2 presents binary logistic regression estimates across three model specifications (Model 1A, Model 1B, and Model 1C) predicting whether organizations develop a Low-Carbon Transition Plan (LCTP). The table is structured to compare predictor variables across three models. Model 1A includes only baseline control variables (geographical regions and industrial sectors). Model 1B adds broad nested climate-risk categories to the control variables. Model 1C substitutes nested risks with specific climate-risk categories. For each predictor, the table reports regression coefficients (β), standard errors, Wald Chi-square statistics (χ2), and statistical significance levels (p-values). The bottom section reports model goodness-of-fit statistics, including Cox and Snell R2 and Nagelkerke R2, Hosmer–Lemeshow test results (χ2, df, p-value), and overall classification accuracy percentages.
* p < 0.05; **p < 0.01; and ***p < 0.001.
Binary logistic regression of adaptation measures (AM)

Table 3 Long description
Table 3 presents binary logistic regression estimates across three model specifications (Model 2A, Model 2B, and Model 2C) predicting whether organizations develop Adaptation Measures (AM). The table is structured to compare predictor variables across the three models. Model 2A includes baseline control variables (geographical regions and industrial sectors). Model 2B adds broad nested climate-risk categories (Physical risk, Regulatory risk, and Other climate-related risks) to the control variables. Model 2C substitutes nested risks with specific disaggregated climate-risk categories. For each predictor, the table reports regression coefficients (β), standard errors, Wald Chi-square statistics (χ2), and statistical significance levels (p-values). The bottom section reports model goodness-of-fit statistics, including Cox and Snell R2 and Nagelkerke R2, Hosmer–Lemeshow test results (χ2, df, p-value), and overall classification accuracy percentages.
* p < 0.05; **p < 0.01; and ***p < 0.001.
Binary logistic regression of low-carbon transition plan and adaptation measures (LCTP&AM)

Table 4 Long description
Table 4 presents binary logistic regression estimates across three model specifications (Model 3A, Model 3B, and Model 3C) predicting whether organizations develop a combined strategy of Low-Carbon Transition Plans and Adaptation Measures (LCTP&AM). The table is structured to compare predictor variables across the three models. Model 3A includes baseline control variables (geographical regions and industrial sectors). Model 3B adds broad nested climate-risk categories (Physical risk, Regulatory risk, and Other climate-related risks) to the control variables. Model 3C substitutes nested risks with specific disaggregated climate-risk categories. For each predictor, the table reports regression coefficients (β), standard errors, Wald Chi-square statistics (χ2), and statistical significance levels (p-values). The bottom section reports model goodness-of-fit statistics, including Cox and Snell R2 and Nagelkerke R2, Hosmer–Lemeshow test results (χ2, df, p-value), and overall classification accuracy percentages.
* p < 0.05; **p < 0.01; and ***p < 0.001.
Model 1A makes accurate predictions for 60.6% of the data (Cox and Snell R 2 = 0.044, and Nagelkerke R 2 = 0.059). According to the Hosmer and Lemeshow test, there is no significant difference between the dependent variable's actual and predicted values (χ2 [df = 6] = 2.875, p > 0.05). With the exception of Materials, all the control variables are significant predictors of LCTP, i.e., the Americas, Asia, Europe, Infrastructure, Manufacturing, and Power generation sectors. Interestingly, Manufacturing and the Americas have a negative coefficient, indicating that companies in this sector or in the American regions are less likely to develop a LCTP.
Model 1B has a better fit (Cox and Snell R 2 = 0.106 and Nagelkerke R 2 = 0.142) and makes accurate predictions for 65.8% of the values. However, the Hosmer and Lemeshow test is significant (p < 0.05). The Wald test indicates that, among the nested risks, only one variable is a significant predictor of whether companies define a LCTP: ‘Physical risk’ (β = 0.498, Wald χ2 [df = 1] = 14.699, p < 0.001). The positive coefficient implies that the companies that perceive physical risk are more likely to define a LCTP. Unlike in the previous model, the Americas are not a significant predictor.
The substitution of nested risks with specific risks in Model 1C shows similar results. It makes accurate predictions for 66.3% of the values (Cox and Snell R 2 = 0.109; Nagelkerke R 2 = 0.147). The Hosmer and Lemeshow test is significant (p < 0.05). The Wald test indicates that among the specific risks, just one variable is a significant predictor of whether companies define a LCTP or not: ‘Chronic physical risk’ (β = 0.448, Wald χ2 [df = 1] = 9.627, p < 0.01). The positive coefficient indicates that the companies that perceive a chronic physical risk are more likely to define a LCTP.
Model 2A makes accurate predictions for 94% of the data (Cox and Snell R 2 = 0.021, and Nagelkerke R 2 = 0.057). The Hosmer and Lemeshow test is not significant (χ2 [df = 4] = 3.443, p > 0.05). Among the control variables, all the sectors are significant predictors of AM, i.e., Food beverage and agriculture, Fossil fuels, Hospitality, Infrastructure, Manufacturing, Materials, and Power generation, but among the regions, only Africa is a predictor of AM. Interestingly, Manufacturing has a negative coefficient, indicating that companies in this sector are less likely to adopt AMs.
Model 2B predicts 94% of the values correctly and has a better fit (Cox and Snell R 2 = 0.066, and Nagelkerke R 2 = 0.180). The Hosmer and Lemeshow test shows non-significance (χ2 [df = 8] = 3.916, p > 0.05). Two variables are found to be a significant predictor of whether companies define or not AMs based on the Wald test: ‘Physical risk’ (β = 0.786, Wald χ2 [df = 1] = 6.786, p < 0.01) and ‘Other climate-related risks’ (β = 2.4, Wald χ2 [df = 1] = 9.366, p < 0.01). The positive coefficient implies that companies that perceive physical risk are more likely to define AMs, as are those that perceive other climate-related risks. Unlike in the previous model, the Fossil fuels and Hospitality control variables are not significant predictors.
Model 2C makes accurate predictions for 94% of the values and has a similar fit (Cox and Snell R 2 = 0.065, and Nagelkerke R 2 = 0.179). The Hosmer and Lemeshow test shows non-significance (χ2 [df = 8] = 7.873, p > 0.05). The Wald test indicates that no specific risk is a significant predictor of whether companies define AMs.
Model 3A has a positive fit and makes accurate predictions for 96.1% of the values (Cox and Snell R 2 = 0.014, and Nagelkerke R 2 = 0.049. The Hosmer and Lemeshow test indicates that there is no significant difference between the dependent variable’s actual and anticipated values (χ2[df = 6] = 4.483, p > 0.05). Except for Asia, all the control variables are significant predictors of LCTP and AM. Manufacturing has a negative coefficient, indicating that companies in this sector are less likely to develop a LCTP and AMs.
Model 3B has a better fit and makes accurate predictions for 96.1% of the values (Cox and Snell R 2 = 0.047, and Nagelkerke R 2 = 0.169). The Hosmer and Lemeshow test is consistent with the results of Model 3A, indicating non-significance (χ2 [df = 7] = 2.621, p > 0.05). According to the Wald test, two factors are significant predictors of whether companies define or not a LCTP and AMs: ‘Physical risk’ (β = 1.486, Wald χ2 [df = 1] = 8.565, p < 0.01) and ‘Other climate-related risks’ (β = 3.663, Wald χ2 [df = 1] = 7.998, p < 0.01). The positive coefficient implies that companies that perceive a physical risk are more likely to define a LCTP and AMs, as are those that perceive other climate-related risks. Among the control variables, only Manufacturing, Materials, and Power generation are significant. As per the previous model, Manufacturing has a negative coefficient.
The substitution of nested risks with specific risks in Model 3C shows similar results. It makes accurate predictions for 96.1% of the values (Cox and Snell R 2 = 0.048; Nagelkerke R 2 = 0.172). The Hosmer and Lemeshow test indicates that there is no significant difference between the dependent variable’s observed and predicted values (χ2 [df = 7] = 5.160, p > 0.05). The Wald test indicates that, among the specific risks, two variables are significant predictors of whether companies define a LCTP and AMs or not: ‘Technology risk’ (β = 1.211, Wald χ2 [df = 1] = 5.428, p < 0.05) and ‘Acute physical risk’ (β = 1.243, Wald χ2 [df = 1] = 3.866, p < 0.05). The positive coefficient implies that companies that perceive a technology risk are more likely to adopt a LCTP and AMs. In contrast to the previous model, among the control variables, only the Manufacturing and Power generation sectors, with negative and positive coefficients, respectively, are significant predictors.
5. Discussion
The results of cross-tabulation suggested an association between all climate-related risks (i.e., Acute physical risk; Chronic physical risk; Current regulation risk; Emerging regulation risk; Legal risk; Market risk; Reputation risk; and Technology risk) and three climate-related strategies (i.e., LCTP; AMs; and LCTP and AMs). However, a more finely-grained analysis showed that companies that perceive either a chronic physical risk or a general physical risk are more likely to define a LCTP. As an example, Company X, an American drug wholesale company, stated:
[Company X]’s business objectives and strategy have been influenced by climate-related issues. […] Through our Global Business Resilience team, we continue to be prepared to remain operational in the event of a disaster so that we may continue to serve our patients and customers. We are implementing a phased approach to Business Continuity Planning to ensure that [Company X]’s network is equipped to handle potential disruptions from natural disasters or other aspects that may be related to climate change. […] In 2021, we formally committed to set a science-based target, and in the interim have set a new goal and target informed by science. By the end of FY22, we commit to reducing our Scope 1 & 2 emissions by 5% from a FY19 baseline. [Company X]’s Global Business Resilience (GBR), an integrated, company-wide program, is part of the Office of Enterprise Risk Management, and designed to ensure that [Company X] can proactively anticipate, prepare for, respond, and adapt to incremental changes and sudden disruptions, including climate-related.
This result confirms hypothesis 2, but hypotheses 1 and 3 are not confirmed. Thus, compared with perceptions of other kinds of climate-related risks, physical risks are significant drivers of LCTP. This result reinforces the findings of de Abreu et al. (Reference de Abreu, Webb, Araújo and Cavalcante2021), who posit that mitigation response could also be driven by the risk of resource scarcity. Hence, although regulatory risk is the most frequently perceived, as underscored by Sakhel (Reference Sakhel2017) and confirmed in our data (Figure 2), it is not the most significant driver of mitigation responses when compared to physical risks.
AMs are driven by physical risks and other climate-related risks at the nested level, confirming hypotheses 5 and 6. Hypothesis 4 is not confirmed. This result confirms the insights of previous studies, which indicate that physical risks are the main drivers of AMs (Gasbarro & Pinkse, Reference Gasbarro and Pinkse2016; Linnenluecke et al., Reference Linnenluecke, Griffiths and Winn2012) and that regulation may be less effective than other climate-related risks in triggering adaptation (Daddi et al., Reference Daddi, Bleischwitz, Maria Todaro, Gusmerotti and De Giacomo2020). For example, Company Y, a real estate company, stated:
The event driven (acute) and longer-term (chronic) physical risks resulting from climate change could have a material adverse effect on our properties, operations and business. To the extent climate change causes changes in weather patterns, our U.S. coastal markets of Boston, New York, San Francisco, Washington, DC and Los Angeles could experience increases in storm intensity, extreme temperatures, rising sea-levels and/or drought. Climate change may have indirect effects on our business, including financial implications. These effects may result in: Direct damage to properties; Supply chain disruption; Declining demand for office space in our buildings; Costs associated with infrastructure-related remediation projects; Increased the costs of, or making unavailable, (i) property insurance on terms we find acceptable, (ii) energy and water, and (iii) snow removal; and Increased business continuity risk at our properties. There can be no assurance that climate change will not have a material adverse effect on our properties, operations or business. We are addressing climate risk with stakeholders across the organization that support climate preparedness and resilience efforts, including our Sustainability, Risk Management, Development, Construction and Property Management departments, as well as external consultants and executive leadership.
Finally, a comprehensive climate strategy, including both mitigation and adaptation, seems to be driven by technology risk, acute physical risk, or physical risk, and other climate-related risks at the nested level, confirming hypotheses 8 and 9. Hypothesis 7 is not confirmed, in contrast with the findings of Kouloukoui et al. (Reference Kouloukoui, de Marcellis-Warin, Armellini, Warin and Torres2021). These results shed light on the drivers of a comprehensive corporate response to climate change, which had remained unknown until now. As an example, Company Z, a reinsurance and financial services company, stated:
[Company Z] has built a consistent strategy over time to protect the value of its invested assets and align its portfolios with the Paris Agreement. The sustainable investing policy together with public commitments on portfolio decarbonization and a long-lasting strategy to finance the transition to a low-carbon economy evidence the ambition of the Group to better steer its investments and finance a more sustainable world. […] As discussed previously, jointly with the [Company W] Group, [Company Z] has undertaken an assessment of the potential impacts of climate change on our business. This formed part of the process of ensuring we adapt to the expected climate changes including hotter and drier summers, warmer and wetter winters, coastal, riverbed and bank erosion and increasingly extreme weather events such as flooding.
Our study provided empirical evidence that the perception of physical risk is a driver of all three types of corporate strategy aimed at addressing the climate emergency. According to some academics, understanding the biophysical boundaries of the ecosystems in which businesses operate is essential to their long-term success (Tencati & Pogutz, Reference Tencati and Pogutz2015; Winn & Pogutz, Reference Winn and Pogutz2013). Winn and Pogutz (Reference Winn and Pogutz2013) suggest reconsidering organization theory in light of the tight relationship between organizations and ecosystems, where businesses affect ecosystem functioning through the overconsumption of ecosystem services; in turn, the depletion of the services on which companies depend affects the companies themselves. These scholars called this mutual relationship organizational ecosystem embeddedness. Applying their construct to the relationship between climate change and companies, businesses affect climate services through GHG emissions, and then the depletion of climate services, such as water shortages driven by droughts, extreme weather conditions, heat waves, and so on, affects business operations. Hence, if companies take a longer-term perspective, they need to recognize and address this mutual influence between them and ecosystems, which, in the case of climate change, requires a twofold response, both in terms of mitigation, to avoid the overconsumption of the ecosystem's services, and in terms of adaptation, to address the consequences of the forced reduction of ecosystem services already in place. In other words, companies need to implement measures focused on maintaining an ecosystem’s functions and services, allowing them to avoid compromising business operations that depend on them. Therefore, in this way, organizational resilience will be achieved.
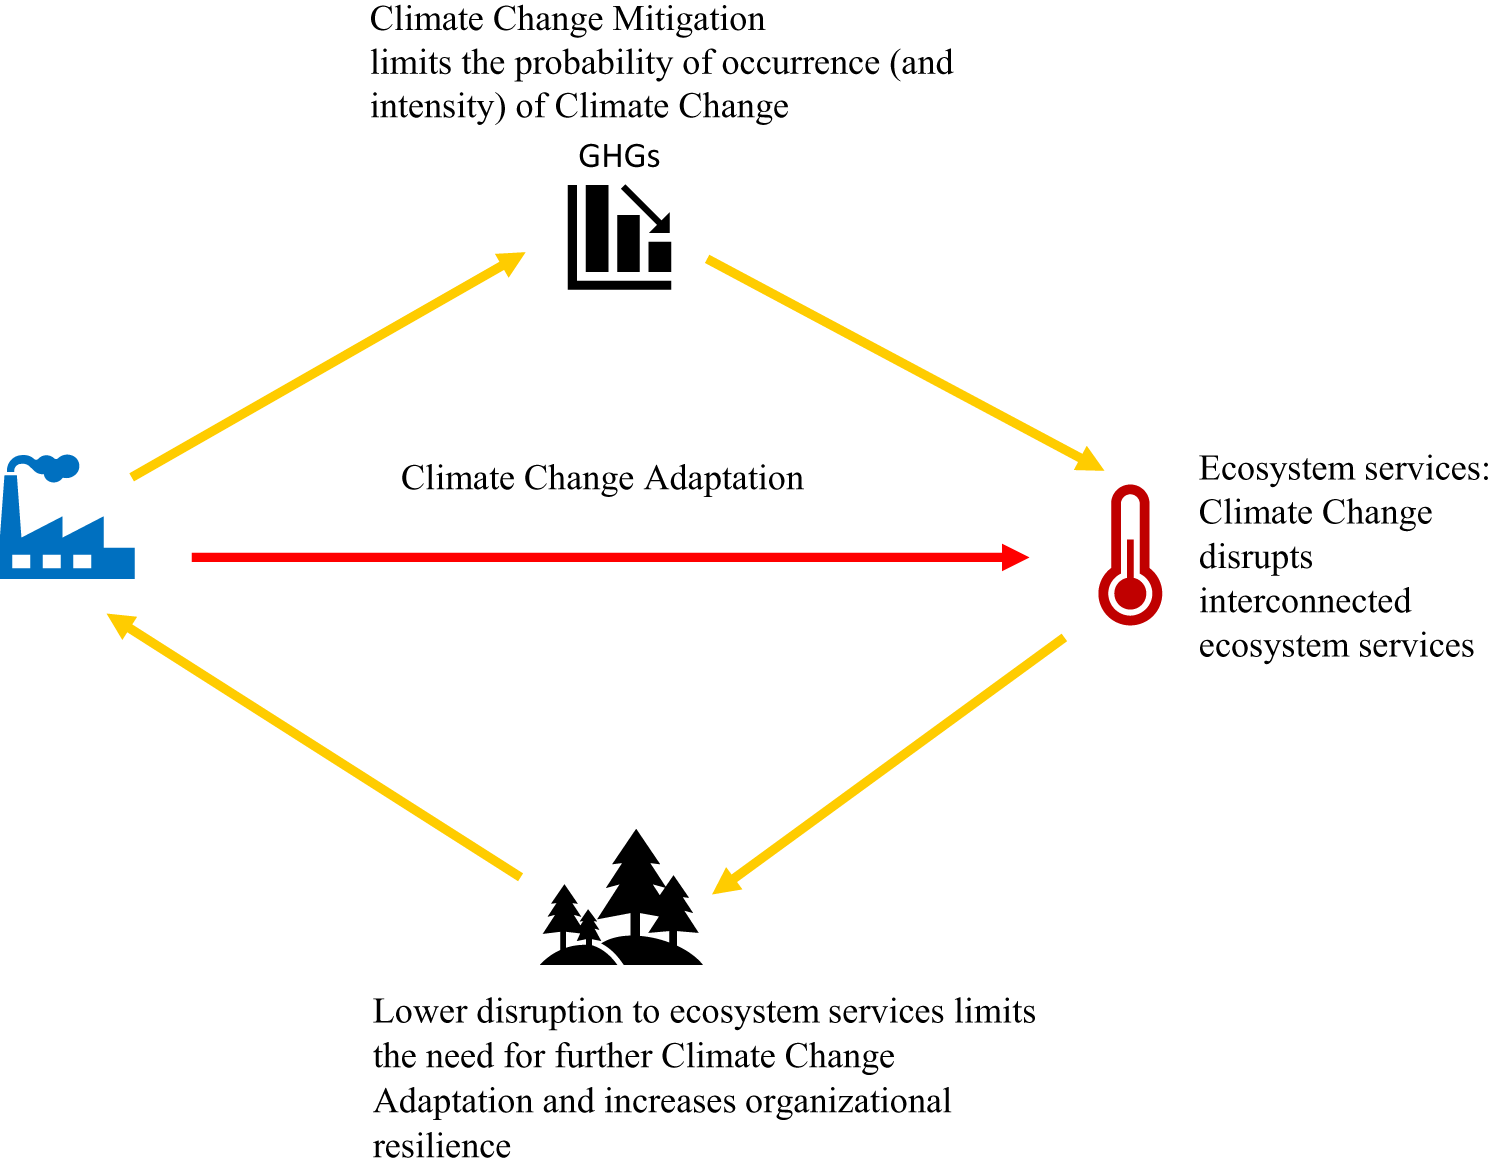
Organizational resilience is often interpreted as a survival capability, i.e., the ability of an organization to withstand and recover from adverse effects (Ortiz-de-mandojana & Bansal, Reference Ortiz-de-Mandojana and Bansal2016). Rather than natural catastrophes, the primary focus of resilience theory and associated research is on an organization’s ability to withstand exogenous shocks, including technological and economic shocks (Mithani et al., Reference Mithani, Gopalakrishnan and Santoro2021). When considering organizational resilience to climate-changing conditions, academics consider it as a desired outcome of adaptation responses (Unter et al., Reference Unter, Park and Rivera2024). Academics argue that companies aware of their vulnerability to climate change implement AMs to improve their resilience (Clément & Rivera, Reference Clément and Rivera2017; Linnenluecke et al., Reference Linnenluecke, Griffiths and Winn2012). However, our findings shed light on the role of climate change mitigation in increasing organizational resilience and the likelihood of surviving ecosystem service disruptions driven by climate change. If mitigation aims to address the cause, adaptation aims to address the consequences of climate change. Moreover, the risk related to climate-related physical changes can be expressed as a function of (1) the probability of occurrence and the intensity of natural hazards triggered by climate change; and (2) the negative impacts in the event these hazards happen (IPCC, 2014a). Hence, mitigation measures aim to limit the probability of occurrence (and intensity), while AMs are meant to moderate or avoid harm related to ecosystem service disruptions driven by climate change (Swart & Raes, Reference Swart and Raes2007). From a resilience perspective, if a company implements a LCTP, it aims to reduce disruptions to ecosystem services, thereby limiting the need for further climate change adaptation and increasing organizational resilience. Hence, the fact that a company’s perception of physical risk is a driver of mitigation, adaptation, and mitigation and adaptation together may suggest that these companies recognize their dependence on the natural ecosystem and are adopting what we call a mitigation and adaptation resilience-based view, especially those companies defining both mitigation and adaptation, with a comprehensive climate risk management approach (Figure 5).
Model: mitigation and adaptation resilience-based view.

Interestingly, regulation risk is not a significant driver of corporate climate action, nor is market risk, unless the latter is nested within a broader risk category (also including technology, legal, and reputation risks), as seen, on the contrary, in most of the studies regarding the drivers of corporate responses to climate change (e.g., de Abreu et al., Reference de Abreu, Webb, Araújo and Cavalcante2021; Cadez et al., Reference Cadez, Czerny and Letmathe2019; Okereke, Reference Okereke2007). This may be due to the fact that the effect of climate-related physical risk was often not considered in previous studies, or to the fact that attention to changes in the natural environment has increased only in the last decade in the public debate and in corporate concerns. However, as our study also shows, there is an association between all climate-related risks and corporate climate strategies.
6. Conclusions
This study sheds light on the most important drivers of corporate responses to climate change, considering both mitigation and adaptation responses separately and together, and comparing different types of contextual drivers. We found that:
• Companies that perceive either a chronic physical risk or a general physical risk are more likely to define a LCTP.
• Companies that perceive physical risks and other climate-related risks are more likely to define AMs.
• Companies that perceive a technology risk, acute physical risk, or physical risk and other risks at the nested level are more likely to define a comprehensive climate strategy including both mitigation and adaptation.
The contribution of this paper is fourfold:
• First, it uncovers the role of different kinds of climate-related risks in triggering a corporate response to climate change; for example, regulation and market risks were overestimated in previous research, while the role of climate-related physical changes was overlooked.
• Second, these results shed light on the drivers of comprehensive corporate responses to climate change, which until now had remained unknown.
• Third, it provides empirical evidence for the organizational ecosystem embeddedness construct (Winn & Pogutz, Reference Winn and Pogutz2013).
• Finally, we extended the organizational resilience theory by showing that resilience can also be pursued through climate change mitigation in response to climate-related physical changes.
Therefore, as companies are adopting what we call a mitigation and adaptation resilience-based view, combining mitigation and adaptation strategies in a synergistic way, to deal with the loss of ecosystem services caused by climate change, we support the idea of reconsidering the concept of organizational resilience (Figure 5).
Sustainability science has long advocated for a shift away from viewing mitigation and adaptation as binary choices. In particular, the IPCC calls for climate-resilient development, where both mitigation and adaptation support sustainable development (IPCC, 2023). The findings of this study suggest that firms are beginning to recognize these as complementary survival strategies in response to their perceptions of vulnerability. Therefore, this reinforces the importance of climate risk modeling, particularly for the likelihood and intensity of physical risks. On the other hand, sustainability science should consider the important role of corporations in contributing to climate-resilient development. In addition, through supplementary analyses, this resilience-based view could be extended into a broader approach to interpreting companies’ responses to the multi-dimensional challenges posed by the depletion of ecosystem services. Further research might also identify the tipping points where economic self-interest aligns with global environmental goals, in other words, the threshold of the ecosystem impacts on firms, which compels a company to reduce its impact on the environment. As for the policy implications, we show that physical risks are the most relevant drivers of organizational climate change responses. We urge policymakers to raise awareness of climate-related physical risks and provide specific risk information at the local and sector levels. In addition, our study shows that companies operating in the Manufacturing sector are less likely to develop any corporate response to climate change, whether for mitigation or adaptation. This may indicate that the climate-related risks perceived by this sector are too weak to trigger a response. Hence, it is worth concentrating efforts on increasing knowledge of climate-related risks, especially the physical risks faced by the Manufacturing sector before they materialize, to increase the sector's resilience.
The limitation of this research is coupled with the limitation of the CDP questionnaire, which did not address adaptation extensively or a comprehensive climate strategy as possible company responses to climate change beyond mitigation. Therefore, further studies might collect further information on company responses to climate change and expand the sample. In addition, this study was carried out with cross-sectional data; a follow-up might be to understand how the drivers of companies’ responses to climate change have changed over time with a longitudinal study. Finally, the method adopted for the analysis does not allow for a granular qualitative assessment of the specific measures implemented by firms. Consequently, this research does not distinguish among different types of interventions, such as Nature-based Solutions, technological upgrades, or infrastructure changes. Future research should adopt a qualitative or mixed-methods approach to investigate the specific content of these adaptation and mitigation measures, thereby providing a deeper understanding of how companies operationalize their organizational resilience across sectors.
Acknowledgements
We are grateful to the anonymous reviewers for their valuable feedback and helpful suggestions on an earlier version of this paper.
Author contributions
F.G. and A.T. conceived and designed the study. F.G. conducted data gathering and performed statistical analyses. F.G. and A.T. wrote the article.
Data availability statement
The data used in this study were provided by CDP Operations Limited and cannot be shared publicly by the authors due to third-party restrictions.
Funding statement
This research received no specific grant from any funding agency, commercial or not-for-profit sectors.
Competing interests
F.G. and A.T. declare none.


 Open access

