Increasing the content of very long chain n-3 polyunsaturated fatty acids (LC n-3 PUFA) such as eicosapentaenoic acid (C20:5n-3) and docosahexaenoic acid (C22:6n-3) in food products is of interest due to their role in the prevention of certain cancers, development of the retina and brain tissue, anti-inflammatory properties, and their role in the modulation and prevention of coronary heart disease (Zarate et al., Reference Zarate, El Jaber-Vazdekis, Tejera, Perez and Rodriguez2017). Several studies have successfully increased the LC n-3 PUFA content of dairy and meat products by supplementing with marine sources such as fish oil (FO) or microalgae (Rodriguez-Herrera et al., Reference Rodriguez-Herrera, Khatri, Marsh, Posri and Sinclair2017; Vanbergue et al., Reference Vanbergue, Peyraud and Hurtaud2018). The transfer efficiency of LC n-3 PUFA from marine sources to milk is, however, low (Chilliard et al., Reference Chilliard, Ferlay and Doreau2001) as the majority of the PUFA are biohydrogenated in the rumen to saturated fatty acids (FA) or their intermediaries (Sinclair et al., Reference Sinclair, Cooper, Chikunya, Wilkinson, Hallett, Enser and Wood2005). Additionally, a time dependent adaptation of the rumen to supplementation with LC n-3 PUFA and production of intermediaries has also been reported in some studies, further reducing the flow of PUFA to the small intestine (Shingfield et al., Reference Shingfield, Reynolds, Hervás, Griinari, Grandison and Beever2006). Most studies that have examined the effect of feeding LC n-3 PUFA have however, been short-term, and there is a lack of information on the long-term effects of supplementation on blood and milk FA profiles.
The fertility of dairy cows in most Western countries has declined over the past five decades, which has been associated with an intensification of production and higher milk yields (Rodney et al., Reference Rodney, Celi, Scott, Breinhild and Lean2015). Polyunsaturated FA have a major role in the endocrine system, metabolism and disease control, influencing the reproductive status of dairy cows in various ways. For example, the series 1 and 2 prostaglandins are synthesized from n-6 PUFA and are intimately involved in uterine involution and subsequent ovulation post-partum (Otto et al., Reference Otto, Freeman, Malau-Aduli, Nichols, Lane and Malau-Aduli2014). In contrast, the 3 series prostaglandins are synthesized from n-3 PUFA and are involved in improving the environment for embryo implantation and survival by decreasing the secretion of PGF2α, resulting in an increased lifespan of the corpus luteum (CL) (Hyeon et al., Reference Hyeon, Jun, Sardar, Adegbola and Sam Churl2016), improvement in blastocyst cell numbers, and maintenance of pregnancy (Otto et al., Reference Otto, Freeman, Malau-Aduli, Nichols, Lane and Malau-Aduli2014). The objective of this study was to determine the effect of supplementation with microalgae that is high in C22:6 n-3 on milk and blood LC n-3 PUFA concentrations over a 14 week period, and to determine the effect on the synthesis of PGF2α.
Material and methods
The study was conducted in accordance with the requirement of the Animals (Scientific Procedures) Act 1986 (amended 2013) and received local ethical approval (reference 0115).
Animals, diets and experimental design
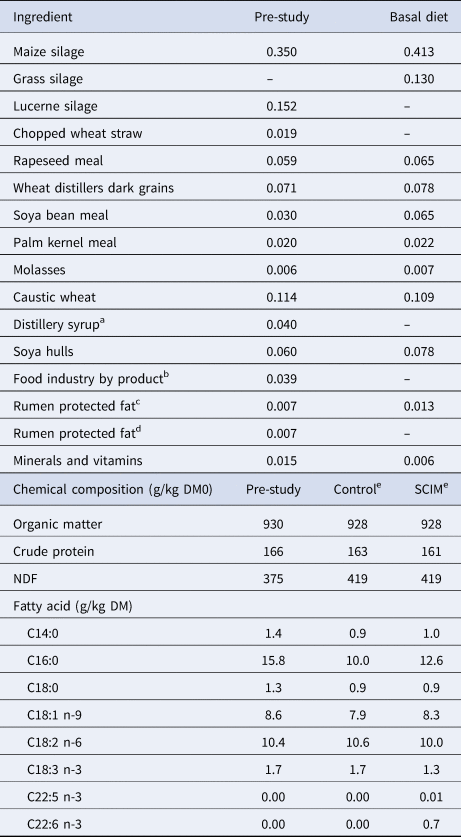
Sixty Holstein-Friesian dairy cows (12 primiparous and 48 multiparous) were randomly allocated into two homogenous groups at 25 ± 0.5 d post calving based on parity and milk yield in the 7 d prior to the start of the study. Animals remained on treatment for 14 weeks and each group received one total mixed ration (TMR) that was either unsupplemented (Control) or supplemented with 100 g/day of dried Schizochytrium limacinum sp., (SCIM; Alltech, Kentucky, USA; Table 1). Cows in the Control group received an additional 100 g per cow per day of a rolled wheat/sugar beet feed mixture to provide a similar energy intake. Cows were fed the TMR once daily at 0900 h at 1.05 of the previous days intake via roughage intake feeders (Insentec B.V., Marknesse, The Netherlands) fitted with an automatic animal identification and weighing system calibrated to ±0.1 kg. Feed intake was recorded daily and the diets sampled weekly and stored at −20°C for subsequent analysis. The SCIM contained 135 g/kg DM crude protein, 580 g/kg oil and (g/100 g FA) 3.7, 1.5, 53.9, 1.7, 0.28, and 25.7 as C14:0, C14:1 cis-9, C16:0, C18:0, C20:5 n-3, and C22:6 n-3, respectively. From calving to the start of the study the cows were fed the same basal ration that did not contain SCIM. All cows had free access to salt blocks and water throughout the study.
Diet composition (kg/kg DM) of the pre-study and study diets that contained no SCIM (Control) or 100 g of microalgae per cow per day (SCIM)

a Spey syrup; KW Feeds, Ternhill, UK.
b Sweet starch: a by-product from the bakery, confectionary, pastry and breakfast cereal industries; KW Feeds, Ternhill, UK.
c Megalac, a calcium salt of palm fatty acids, Volac, Royston, UK.
d Butterfat Extra, a calcium salt of palm fatty acids fatty acids, Trident Feeds, Peterborough, UK.
e The SCIM group received the basal ration with an additional 100 g/cow/day of microalgae, and the Control group received the basal ratio with an additional 100 g/cow/day of an equal mixture of a rolled wheat/sugarbeet feed.
All cows were milked twice daily at 0615 and 1600 h. Milk yield was recorded daily and cows were weighed and body condition scored (BCS; Ferguson et al., Reference Ferguson, Galligan and Thomsen1994) at approximately 1100 h at 1 week prior to the start of study, then every other week. Milk samples were collected weekly at consecutive am and pm milkings for subsequent analysis. During weeks 0, 1, 2, 4, 8 and 14 of the study milk samples were collected at 2 consecutive am and pm milkings from 16 representative pairs of cows per group (based on their parity and milk yield in the week prior to allocation) and pooled based on the respective am and pm milk yield for FA determination.
Blood metabolites and reproductive hormones
Blood samples were collected from the jugular vein from 12 representative pairs of cows (based on their parity and milk yield in the week prior to allocation) at 1100 h during weeks 0, 2, 4, 8 and 14. Samples were centrifuged at 1000 g for 15 min, the plasma separated and stored at −20°C prior to subsequent analysis. At day 33 (±0.9) postpartum, 24 representative cows (12 per treatment group cows based on their parity and milk yield in the week prior to allocation) were synchronized in pairs using progesterone releasing intra-vaginal devices (PRID; Ceva Prid®Delta, Ceva Animal Health Ltd., Amersham, UK). The PRID's were removed after 10 d, and on day 17 of the synchronized oestrous cycle (Robinson et al., Reference Robinson, Pushpakumara, Cheng, Peters, Abayasekara and Wathes2002), a catheter was inserted into the jugular vein following sedation with Sedaxylan (20 mg/ml xylazine solution at 0.5 ml/100 kg; Dechra Pharmaceuticals PLC, Northwich, UK) injected into the coccygeal vein. Blood samples were collected via the jugular catheter at 15 min intervals for 1 h prior to the administration of oxytocin (100 IU; MSD Animal Health, Milton Keynes, UK), and at 15 min intervals for a further 3 h, and then at 30 min intervals until 4 h post oxytocin infusion to monitor uterine secretion of 13,14-dihydro-15-keto PGF2α metabolite (PGFM). The blood was centrifuged at 1000 g for 15 min and the plasma frozen at −20°C prior to subsequent analysis.
Chemical analysis
The TMR samples were bulked within each month and a sub-sample analysed according to AOAC (2012) for DM (934.01), CP (988.05) and ash (924.05), whilst NDF was analysed according to Van Soest et al. (Reference Van Soest, Robertson and Lewis1991). Feed, milk and plasma fatty acid extraction and analysis are provided in the online Supplementary File. Milk fat, protein and somatic cell count (SCC) were determined at the National Milk Laboratories (Four Ashes, UK). Plasma samples were analysed for, 3-OHB, glucose and non-esterified fatty acids (NEFA) (kit catalogue no. RB1008; GU611 and FA115, respectively Randox Laboratories, County Antrium, UK), using a Cobas Mira Plus autoanalyser (ABX Diagnostics, Bedfordshire, UK). Plasma concentration of PGFM, was assayed using an ELISA kit (Cayman Chemical, Ann Arbor, MI, USA) with an inter- and intra-assay coefficient of variation of 13.0 and 9.9% respectively.
Calculations and statistical analysis
All data were checked for normal distribution and analysed using Genstat 17th edition (VSN Ltd, Oxford, UK). The SCC data were converted to their natural log prior to analysis. Daily live weight and body condition change were calculated as the final minus the initial value divided by the days on study. The PGFM area under the curve was calculated as described by Robinson et al. (Reference Robinson, Pushpakumara, Cheng, Peters, Abayasekara and Wathes2002). Variables having more than one observation were analysed using repeated measures ANOVA as: Yijk = μ + Pi + Dj + Tk + D × Tjk + ɛijk, where Yijk = dependent variable; μ = overall mean; Pi = fixed effect of pair; Dj = effect of diet, Tk = effect of time; D × Ajk = interaction between diet and time and ɛijk = residual error. Variables with one observation were analysed by ANOVA using Genstat 18th edition (VSN Ltd., Oxford, UK).
Results
Feed analysis
The treatment diets had a similar chemical position with a mean DM of 378 g/kg, OM of 927 g/kg DM, CP of 162 g/kg DM and NDF of 419 g/kg DM, whereas the pre-study diet was higher in CP and lower in NDF (Table 1). The pre-study diet had also a higher concentration of C14:0 and C16:0 compared to the treatment diets. The SCIM diet contained 0.01 g/kg DM of C20:5 n-3 and 0.71 g/kg DM C22:6 n-3, whereas the pre-study and Control diets did not contain any detectable levels.
Animal performance and blood metabolites
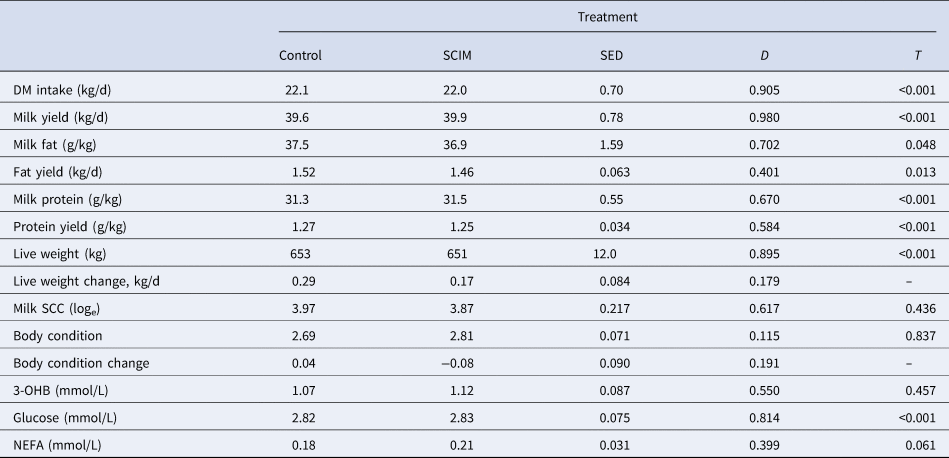
There was no effect (P > 0.05) of dietary treatment on DM intake, with a mean value of 22.1 kg/d (Table 2), but was affected by time (P < 0.001), increasing from 21.1 kg/d in week 1 of the study to 23.4 kg/d at week 3 before decreasing to 20.9 kg/d at week 14. Similarly, there was no effect (P > 0.05) of treatment on daily milk yield with a mean value of 40.6 kg/d, and a peak yield of 42.2 kg/d occurring during week 3 of the study. Mean milk fat content was 37.2 g/kg and fat yield 1.49 kg/d, and were not affected by dietary treatment (P > 0.05), with both decreasing over time (P = 0.048 and 0.013 respectively). Milk protein content and yield were not affected (P > 0.05) by dietary treatment, and decreased with time (P < 0.001). There was no effect (P > 0.05) of dietary treatment on live weight, which increased by 0.23 kg/d over the 14 week (P < 0.001). Body condition score was unaffected (P > 0.05) by treatment or time.
Animal performance and blood metabolites in dairy cows fed no SCIM (Control) or 100 g of microalgae per cow per day (SCIM)

aMain effects of diet (D), time (T), and their interaction (D × T). There was no diet × treatment interaction except for plasma glucose, which was approximately 0.1 mmol/L higher in week 2 and 0.1 mmol/L lower in week 8 (P < 0.05) in cows fed the Control compared to SCIM.
There was no effect (P > 0.05) of dietary treatment on the mean concentration of plasma 3-OHB, glucose or NEFA (Table 2). Plasma NEFA tended to decrease (P = 0.06) from week 2 to week 14 of the study, whilst plasma glucose was lower in cows receiving SCIM compared to the Control at week 2, and higher in weeks 4 and 8 (P < 0.05).
Milk and plasma fatty acid profile
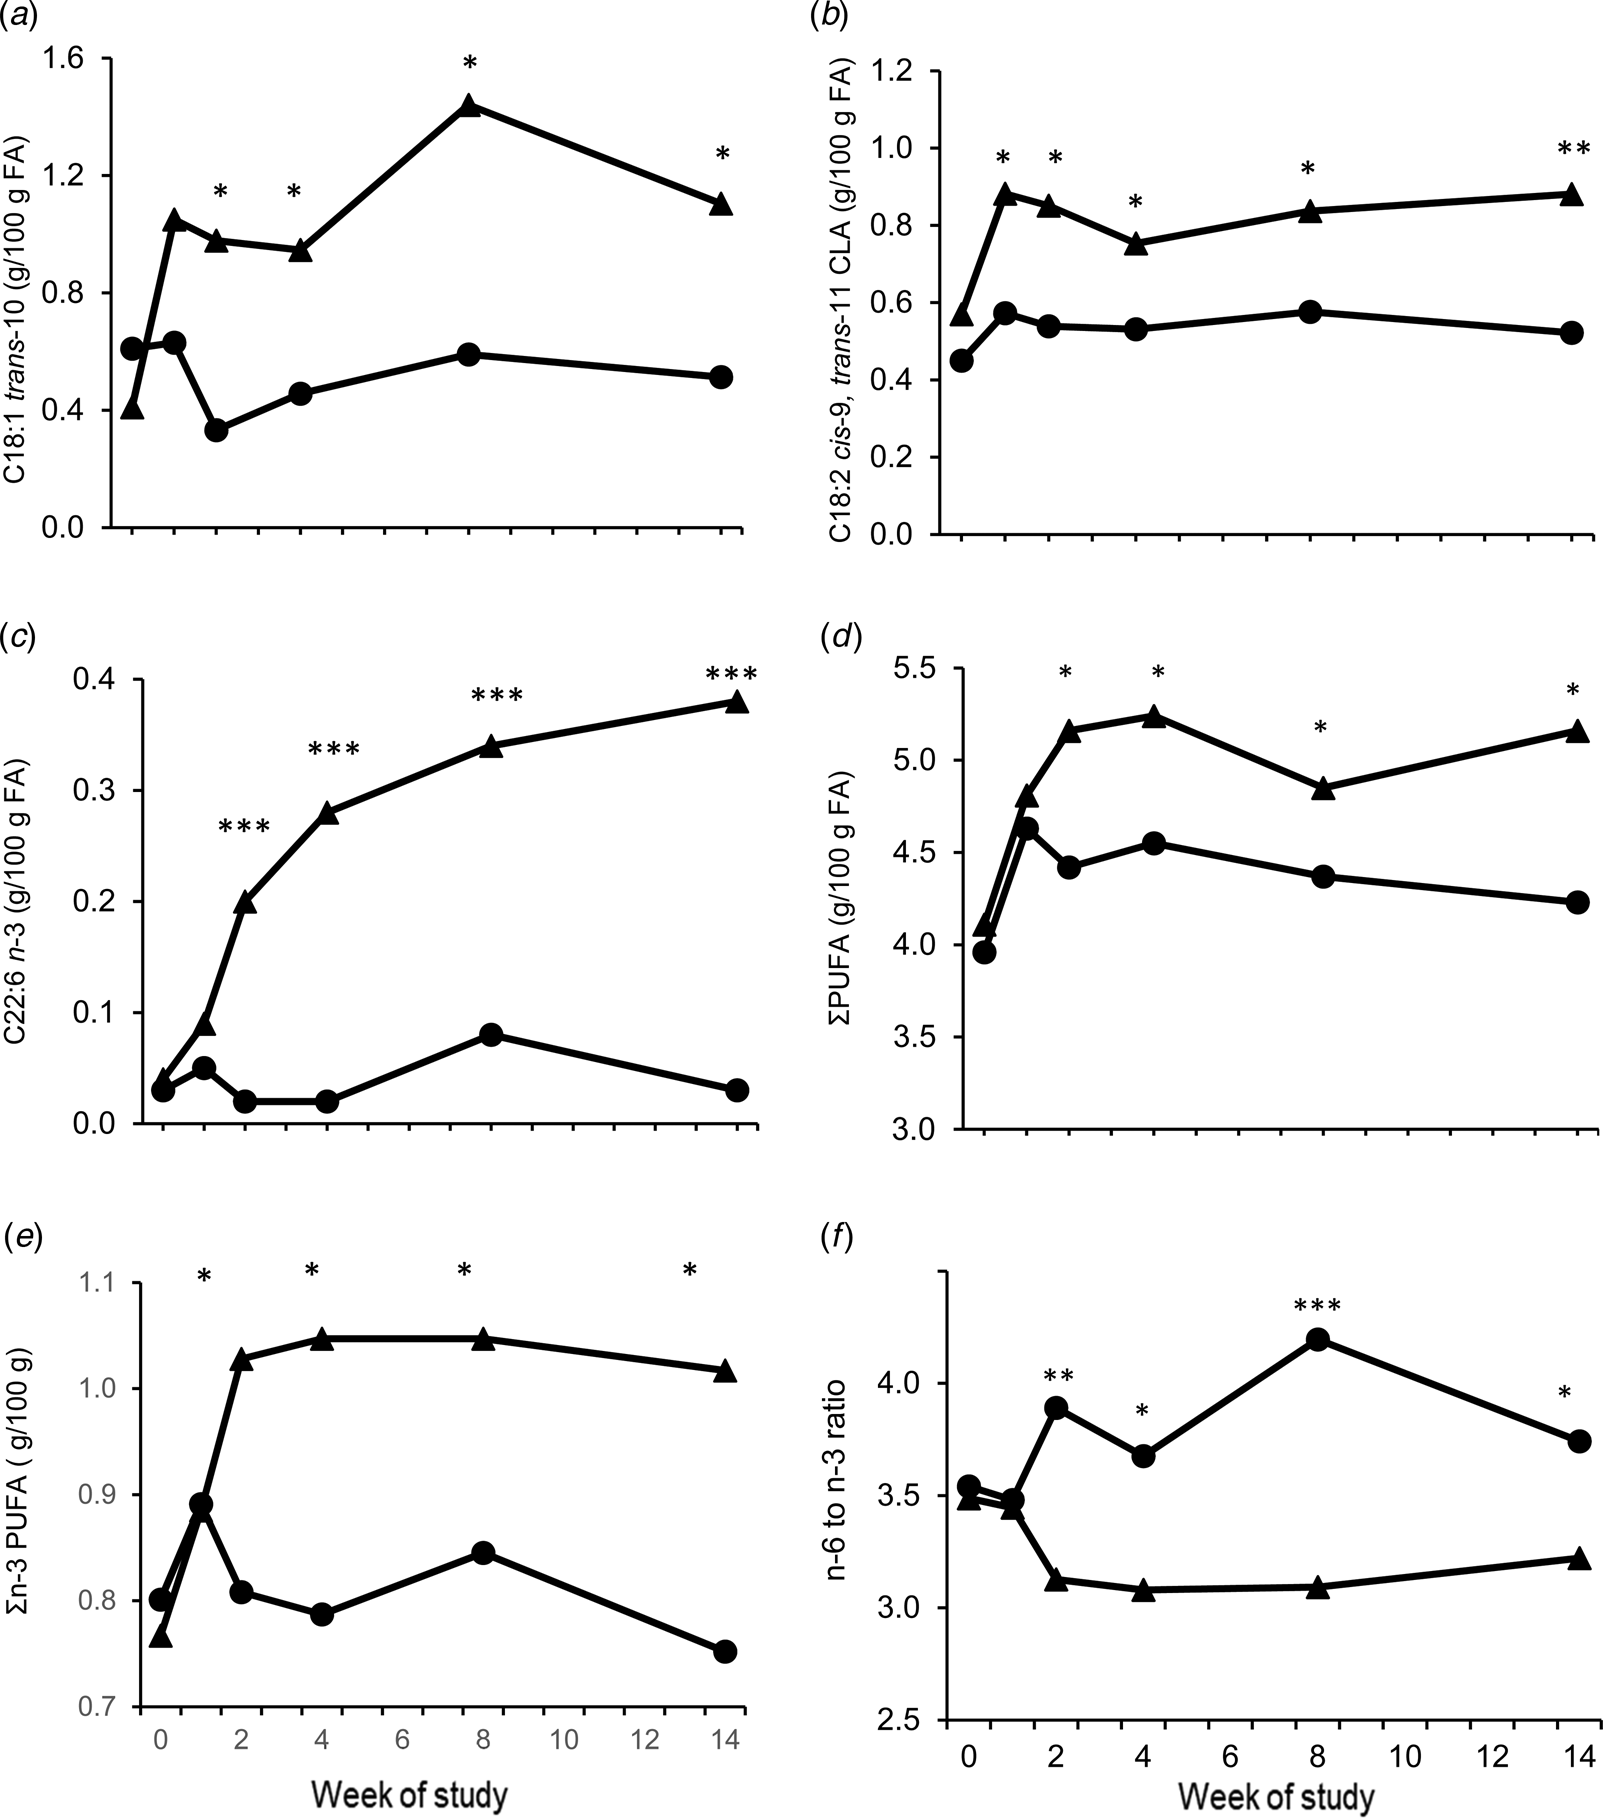
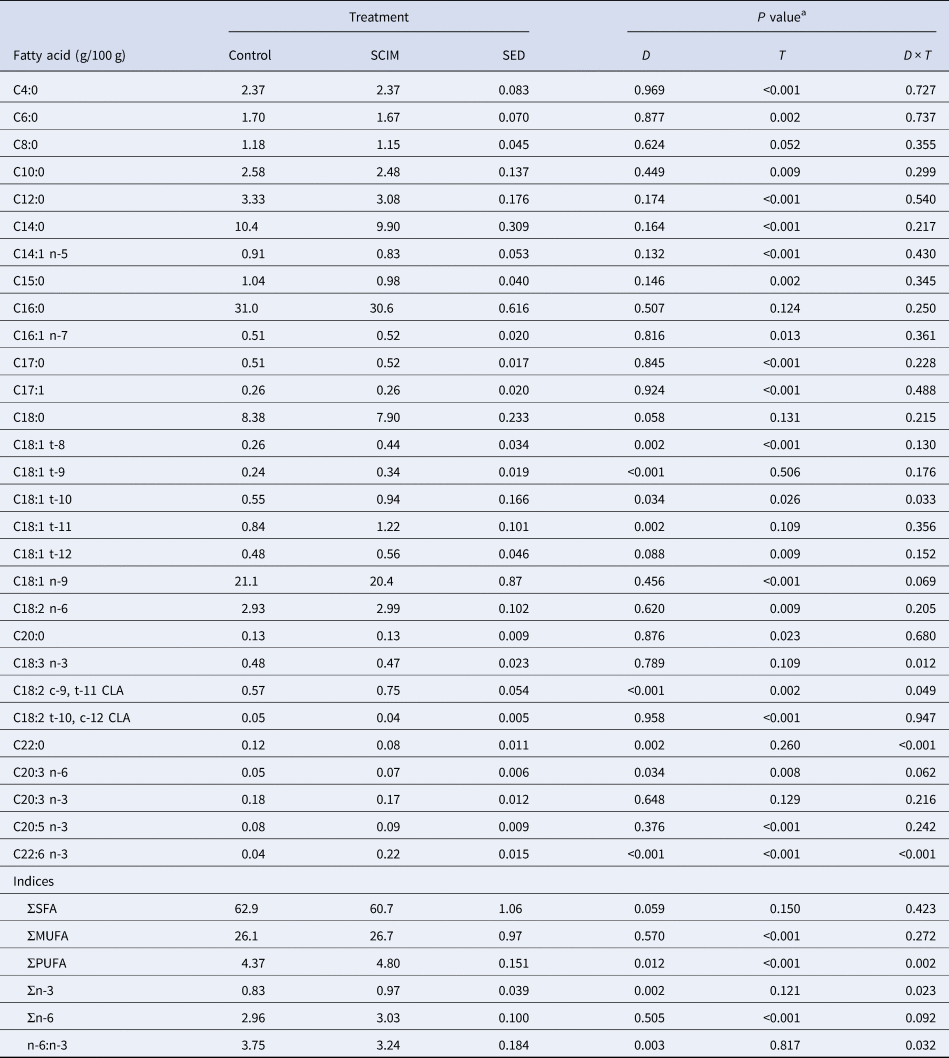
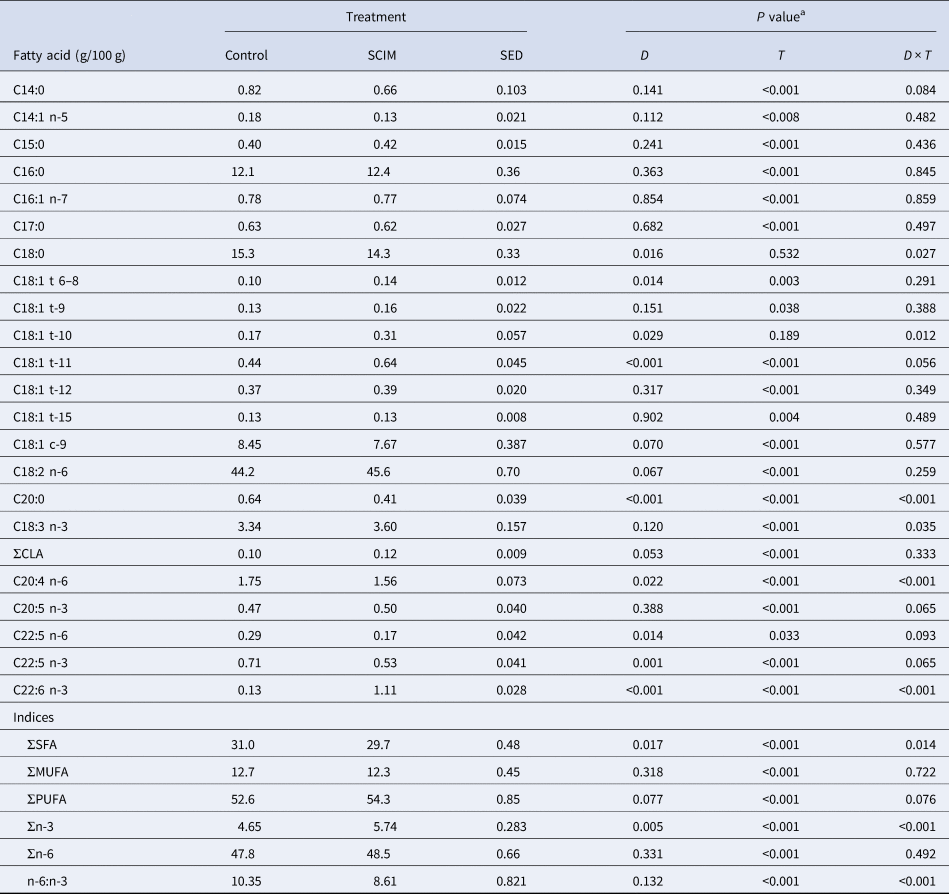
There was no effect (P > 0.05) of dietary treatment on milk fat content of C4:0 to C18:0, C18:1 t-12, C18:1 n-9, C18:2 n-6, C20:0, C18:2 t-10, cis-12 CLA, C20:3 n-3 and C20:5 n-3, SFA, MUFA or total n-6 FA (Table 3). Milk fat content of C18:1 t 10, and c-9, t-11 CLA were similar at week 0 in cows fed either treatment, and increased (P < 0.05) in SCIM fed cows from week 2 onwards (Fig. 1a and b). There was also a higher milk fat content of C22:6n-3 in cows fed SCIM from week 2 onwards (P < 0.001), with the maximum difference between treatments of 0.34 g/100 g FA occurring at week 14 of the study (Fig. 1c). Milk fat content of total PUFA and total n-3 PUFA increased and the n-6 to n-3 PUFA ratio decreased in SCIM fed cows from week 2 of the study (P < 0.05; Fig. 1d and e and f respectively), whilst C18:3 n-3 was lower at week 2 and C22:0 higher at weeks 8 and 14 in SCIM fed cows (online Supplementary Fig. 1a and b). Milk fat content of C18:1 t-8, t-9, t-11 and C20:3 n-6 were higher in cows fed SCIM than the Control. The content of C10:0, C12:0, C14:0, C14:1 n-5, C16:1 n-7, C18:1 t-8, C18:2 n-6, C20:0, and ∑n-6 FA increased with time, whilst C4:0, C6:0, C15:0, C17:0, C17:1, C18:1 t-12, C18:1 c-9, C18:2 t-10, c-12 CLA, C20:3 n-6, C20:5 n-3 and MUFA decreased over the study period.
Milk fat concentration of (a) C18:1 trans-10 (b) C18:2 cis-9 trans-11 CLA (c) C22:6 n-3, (d) total PUFA, (e) total n-3 PUFA and (f) n-6 to n-3 ratio in dairy cows fed no SCIM (Control ●) or 100 g per cow per day of microalgae (SCIM ▴). SED = 0.25, 0.071, 0.030, 0.22, 0.070 g/100g and 0.28 respectively. Within time points, treatments differ at P < 0.05, P < 0.01 or P < 0.001 as denoted by *, ** or *** respectively.

Milk fatty acid composition (g/100 g of FA) of dairy cows fed no SCIM (Control) or 100 g of microalgae per cow per day (SCIM)

a Main effects of diet (D), time (T), and their interaction (D × T).
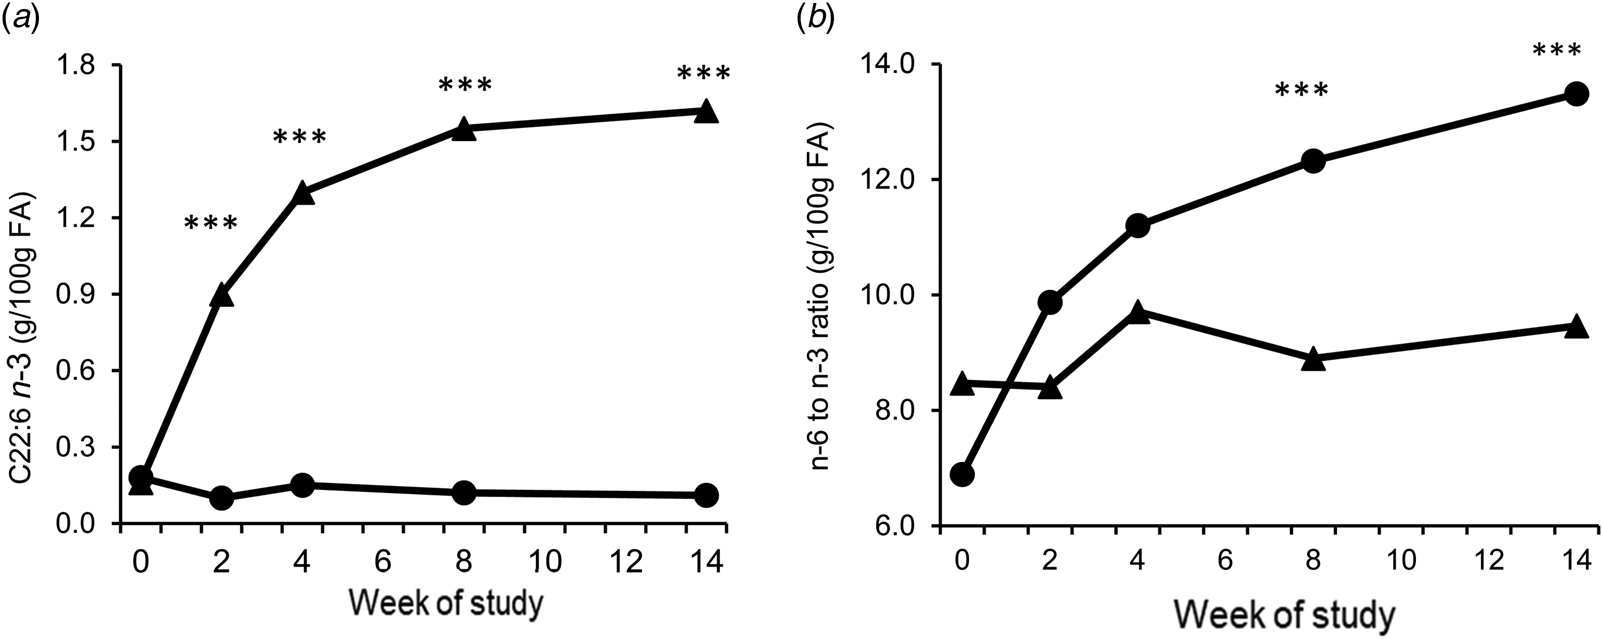
There was no effect (P > 0.05) of dietary treatment on blood plasma fat content of C14:0 to C17:0, C18:1 t9, 12, or 15, C18:1 c-9, C20:5 n-3, total MUFA, PUFA or n-6 FA (Table 4). There was an interaction between Treatment and time (P < 0.001) on plasma C22:6 n-3 concentration, which was higher in SCIM fed cows from week two of the study, and remained high for the remainder of the study. In contrast, the ratio of the total n-6 to n-3 PUFA in blood plasma was lower (P < 0.001) from week 8 of the study in cows fed SCIM (Fig. 2b). Blood plasma C18:0, C20:4 n-6, C20:0 and the sum of the saturated FA were similar at week 0 and decreased in cows fed SCIM compared to the control (Supplementary Fig. 2a, d, e and f), whilst C18 t-10, C18:3 n-3, and the sum of the total PUFA increased in cows fed SCIM (Supplementary Fig. 2b, c and g).
Blood plasma fat concentration of (a) C22:6 n-3 (b) n-6 to n-3 PUFA ratio in dairy cows fed no SCIM (Control ●) or 100 g per cow per day of microalgae (SCIM ▴). SED = 0.045 g/100 g and 1.07 respectively. Within time points, treatments differ at P < 0.05, P < 0.01 or P < 0.001 are denoted by *, ** or *** respectively.

Total plasma lipid fatty acid composition (g/100 g of FA) of dairy cows fed no SCIM (Control) or 100 g of microalgae/cow per day (SCIM)

a Main effects of diet (D), time (T), and their interaction (D × T).
Plasma PGFM concentrations
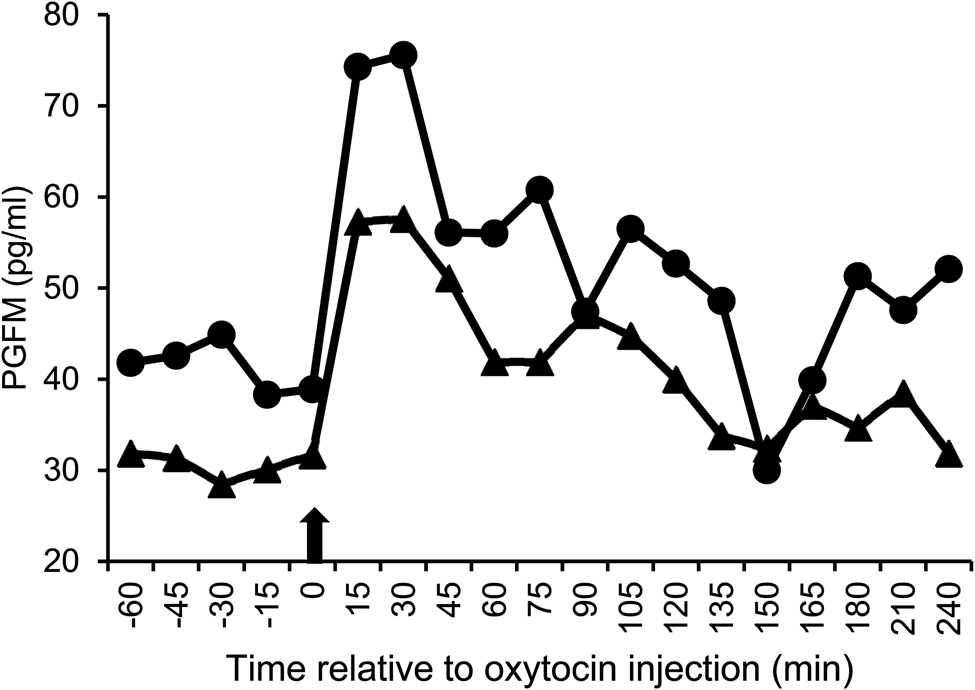
Plasma PGFM concentrations increased to a peak at 15–30 min following the oxytocin challenge (Fig. 3) before gradually returning to the basal level at 150 min for cows receiving either treatment. There was no effect of treatment on mean plasma PGFM concentration, area under the curve, or peak concentration (P > 0.05).
Plasma 13,14-dihydro-15-keto PGF2α metabolite (PGFM) concentration after an oxytocin challenge (time = 0) in cows fed no SCIM (Control ●) or 100 g per cow per day of microalgae (SCIM ▴). Arrow represents when oxytocin was administered. SED = 11.3 pg/ml. Significance for Diet, time and D × T = 0.307, 0.003 and 0.351 respectively. For the Control and SCIM, peak value = 67.5 and 73.9 pg/ml (SED 17.61; P = 0.731) and area under curve = 2236 and 4046 (SED = 987.0; P = 0.126) respectively.

Discussion
Animal performance and blood metabolites
The primary objective of this study was to determine the long-term effects of feeding microalgae that is high in C22:6 n-3 on milk and plasma fat concentration of LC n-3 PUFA and animal performance over time. The cows were fed 100 g of microalgae per d as higher inclusion levels have been shown to reduce DM intake and/or result in milk fat depression (Vanbergue et al., Reference Vanbergue, Peyraud and Hurtaud2018; Marques et al., Reference Marques, Del Valle, Ghizzi, Zilio, Gheller, Nunes, Silva, Dias, Grigoletto, Koontz, da Silva and Rennó2019), with the consequence of a reduced milk and/or fat yield. In the current study there was no effect of dietary treatment on DM intake, which averaged 22.1 kg/d over the 14 week period. This finding is in accordance with Till et al. (Reference Till, Huntington, Posri, Early, Taylor-Pickard and Sinclair2019) who reported no effect on intake when cows were fed 100 g of SCIM/d. There is no clear consensus in the literature on the effects of the addition of marine lipids on milk performance, with the level and composition of the supplement, as well as the basal ration, having a major influence (Mattos et al., Reference Mattos, Staples, Arteche, Wiltbank, Diaz, Jenkins and Thatcher2004; Sinedino et al., Reference Sinedino, Honda, Souza, Lock, Boland, Staples, Thatcher and Santos2017). In the current study there was no effect of treatment on milk fat content or yield. Bauman and Griinari (Reference Bauman and Griinari2003) described how unique FA intermediates that are produced during the biohydrogenation of PUFA can cause an inhibitory effect on sterol regulatory element binding protein signalling on milk fat synthesis, with one intermediate identified as a potent inhibitor being C18:2 t-10, c-12 CLA. In the current study milk fat concentration of C18:2 t-10, c-12 CLA was similar between treatments, and milk fat content was also unaffected by dietary treatment. Lock et al. (Reference Lock, Tyburczy, Dwyer, Harvatine, Destaillats, Mouloungui, Candy and Bauman2007) investigated the effect of abomasal infusion of C18:1 t-10 on milk fat content in dairy cows and reported that it had no effect on milk fat synthesis. In the current study concentrations of C18: t-10 were higher in both blood plasma and milk of SCIM fed cows compared to the Control, yet milk fat content was unaffected, supporting that C18:1 t-10 is not a major factor controlling milk fat synthesis in dairy cows.
In early lactation mobilization of lipid reserves is required to compensate for the imbalance between energy consumed, and energy secreted in milk (Cozzi et al., Reference Cozzi, Ravarotto, Gottardo, Stefani, Contiero, Moro, Brscic and Dalvit2011), and is generally associated with an elevation in plasma 3-OHB (McArt et al., Reference McArt, Nydam, Oetzel, Overton and Ospina2013). In the current study blood samples were collected at one time point and differences may have been detected had samples been taken throughout the day, although previous studies have demonstrated no interaction between feeding microalgae and time of sampling on plasma metabolites (Till et al., Reference Till, Huntington, Posri, Early, Taylor-Pickard and Sinclair2019). The mean plasma concentration of 3-OHB was not affected by dietary treatment and was within the accepted cut-point concentration of ≥1.2 mmol/l that is associated with sub-clinical or clinical ketosis (McArt et al., Reference McArt, Nydam, Oetzel, Overton and Ospina2013). The lack of a difference in milk energy output, along with a similar DMI and live weight change in cows receiving the Control or SCIM treatments may explain the similarity in the plasma metabolite concentrations between treatments.
Milk and plasma fatty acid profile
Cows that received the SCIM supplement in the current study had higher milk and plasma concentrations of C22:6 n-3 compared to the Control from week 2 onwards, with the difference increasing until week 14 of the study. Most other studies that have fed microalgae to dairy cows have used short-term, change over-studies or fed for a short period of time, and reported increases in C22:6 n-3 in milk of up to 0.46 g/100 g FA with unprotected microalgae or 0.76 g/100 g FA with rumen protected microalgae (Vanbergue et al., Reference Vanbergue, Peyraud and Hurtaud2018; Franklin et al. Reference Franklin, Martin, Baer, Schingoethe and Hippen1999; Till et al., Reference Till, Huntington, Posri, Early, Taylor-Pickard and Sinclair2019). Studies that have fed microalgae for longer periods have reported an increase in the concentration of C22:6 n-3 in milk, but only measured milk FA at single time points and did not monitor the change over time (Sinedino et al., Reference Sinedino, Honda, Souza, Lock, Boland, Staples, Thatcher and Santos2017). In contrast to the current findings, Shingfield et al. (Reference Shingfield, Reynolds, Hervás, Griinari, Grandison and Beever2006) reported a temporal pattern in milk C22:6 n-3 concentration when FO was fed, reaching a maximum 5 d after FO introduction before declining. This response was suggested to be due to an adaptation of the rumen microbiome and progressive increase in the extent of biohydrogenation, or a shift in the incorporation of these FA from blood triacylglycerides towards phospholipids (Shingfield et al., Reference Shingfield, Reynolds, Hervás, Griinari, Grandison and Beever2006). In the current study milk samples were collected 1 week after SCIM was introduced, and it is not possible to determine changes in milk fat C22:6n-3 concentration before this. However, the persistent increase in plasma and milk concentration over time does not support a significant ruminal adaptation or reduction in mammary uptake.
The inclusion of LC n-3 PUFA in the diet of ruminants typically lowers short and medium chained FA concentration in milk due to their inhibitory effects on mammary de novo FA synthesis (Shingfield et al., Reference Shingfield, Reynolds, Hervás, Griinari, Grandison and Beever2006), but in the current study the concentration of FA with a chain length <16 was unchanged. A reduction in the milk fat concentration of C18:0 was observed by Till et al. (Reference Till, Huntington, Posri, Early, Taylor-Pickard and Sinclair2019) when cows were fed SCIM, but in the current study there was only a trend for a reduction in milk C18:0 in SCIM fed cows which may be attributed to the inhibitory effect of SCIM on the biohydrogenation of C18-unsaturated FA to C18:0 in the rumen. It was also suggested by Shingfield et al. (Reference Shingfield, Reynolds, Hervás, Griinari, Grandison and Beever2006) that mammary synthesis of C18:1 cis-9 from C18:0 via Δ9-desaturatase was required for the maintenance of the fluidity of milk fat (Bichi et al., Reference Bichi, Hervas, Toral, Loor and Frutos2013). This is difficult to conclude from the current study as milk concentrations of C18:1 cis-9 were similar between dietary treatments.
Plasma PGFM concentration
The second objective of the current study was to investigate the effect of feeding SCIM on the plasma concentration of PGFM. Diets high in n-3 FA may reduce PGF2α synthesis and consequently prevent the regression of the corpus luteum (CL), allowing continued secretion of progesterone that can help improve embryo survival (Gulliver et al., Reference Gulliver, Friend, King and Clayton2012). The effects of added PUFA on reproductive function have however, not always been consistent. To date only two other studies have reported the effects of feeding LC n-3 PUFA from microalgae on reproduction in dairy cows, with Sinedino et al. (Reference Sinedino, Honda, Souza, Lock, Boland, Staples, Thatcher and Santos2017) reporting that microalgae fed cows had an increase in conception rate, and upregulation of the interferon-stimulated gene RTP4 which is associated with placental development, immunomodulation and conceptus elongation (Ribeiro et al., Reference Ribeiro, Greco, Bisinotto, Lima, Thatcher and Santos2016). In contrast, Vlcek et al. (Reference Vlcek, Andrlikova, Barbato, Bina, Boland, Dolezel, Lapatarova and Cech2017) reported no effect on the size of the pre-ovulatory follicle at first or second synchronized oestrus, although the size of the corpus luteum was larger in cows fed microalgae. However, neither Sinedino et al. (Reference Sinedino, Honda, Souza, Lock, Boland, Staples, Thatcher and Santos2017) or Vlcek et al. (Reference Vlcek, Andrlikova, Barbato, Bina, Boland, Dolezel, Lapatarova and Cech2017) determined the concentration of plasma PGF2α. In the current study SCIM supplementation had no effect on mean, peak or area under the curve of plasma PGFM. In contrast, Dirandeh et al. (Reference Dirandeh, Towhidi, Zeinoaldini, Ganjkhanlou, Pirsaraei and Fouladi-Nashta2013) investigated the effect of feeding linseed oil as a source of n-3 on plasma concentration of PGFM from calving to 70 d post calving and reported a reduced plasma PGFM concentration. Similarly, Mattos et al. (Reference Mattos, Staples, Arteche, Wiltbank, Diaz, Jenkins and Thatcher2004), fed FO to dairy cows from 21 d pre-partum until 21 d post-partum, and reported a significant decrease in plasma PGFM concentrations at days 0, 0.5, 2 and 2.5 post-partum in cows fed FO. By day 17 of the synchronized oestrus cycle, the cows selected for PGFM analysis in the current study had received the SCIM supplement for 39 ± 0.9 d. Results from other studies suggest that this period of feeding was sufficient to affect the size of the corpus luteum and alter PGFM synthesis (Petit et al., Reference Petit, Dewhurst, Scollan, Proulx, Khalid, Haresign, Twagiramungi and Mann2002; Mattos et al., Reference Mattos, Staples, Arteche, Wiltbank, Diaz, Jenkins and Thatcher2004).
In conclusion, the increase in milk and blood plasma C22:6 n-3 content over the 14 week study period suggest that the rumen microbial ecosystem did not adapt over time to the dietary supplementation of 100 g/d of SCIM. The increase in milk C22:6n-3 and cis-9, trans-11 CLA improves milk quality for human consumption without affecting milk performance. Supplementing dairy cows with SCIM at the rate and length of time in the current study did not affect plasma PGFM concentrations.
Supplementary material
The supplementary material for this article can be found at https://doi.org/10.1017/S002202991900102X
Acknowledgements
The authors would like to acknowledge the technical support from Sarah Williams, Claire Cianchi, Ginny Whiston, Richard Beattie, Francesca Metherell and Keara Helen.