Implications
In a developing country context, the development of milk production depends on small-scale producers who are extremely diverse. Understanding and taking into account such diversity may bring benefits both to farmers and the dairy firms. Farmers may benefit from better-targeted advisory services, whereas the dairy firms may be in a position to better achieve their objectives.
Introduction
Milk production is increasing in developing countries, stimulated by population growth and dietary changes (Delgado et al., Reference Delgado, Rosegrant, Steinfeld, Ehui and Courbois1999). In many regions, production is based on family farms whose herds may range from two or three cows to over a dozen head, which is generally small compared to Western standards (Suzuki et al., Reference Suzuki, Kanameda, Ogawa, Nguyen, Dang, Luu and Pfeiffer2006; Aubron et al., Reference Aubron, Cochet, Brunschwig and Moulin2009; Bartl et al., Reference Bartl, Mayer, Gómez, Muñoz, Hess and Holmann2009). These dairy farms may interact with supply chain collectors in three ways: (i) no interaction when the milk market is missing or functioning poorly (Staal et al., Reference Staal, Delgado and Nicholson1997; Moll et al., Reference Moll, Staal and Ibrahim2007; Nkya et al., Reference Nkya, Kessy, Lyimo, Msangi, Turuka and Mtenga2007); (ii) through short-range networks such as artisanal dairies, direct consumer sales, or peddling, with or without product processing, supplying milk products to urban populations and people living near production sites (Corniaux et al., Reference Corniaux, Duteurtre, Dieye and Poccard Chapuis2005; Dieye et al., Reference Dieye, Duteurtre, Sissokho, Sall and Dia2005); (iii) through milk collection chains managed by agro-processing firms that supply large-scale dairies with milk collected from numerous small-scale farmers. In the latter case, cooperatives sometimes are established to play an intermediary collection role between the farmers and the dairy (Owango et al., Reference Owango, Lukuyu, Staal, Kenyanjui, Njubi and Thorpe1998; Holloway et al., Reference Holloway, Nicholson, Delgado, Staal and Ehui2000; Sraïri et al., Reference Sraïri, Benhouda, Kuper and Le Gal2009a). The establishment of formal contracts between farmers and supply chain collectors stimulates the adoption of innovative livestock practices (Dieye et al., Reference Dieye, Montaigne, Duteurtre and Boutonnet2008) such as providing fodder and feed supplements to increase production and lessen seasonal fluctuations, breeding and improved hygiene. Quality standards are even more stringent when private firms collect milk. Farmers are required to make significant investments in equipment and livestock buildings (Reardon et al., Reference Reardon, Barrett, Berdegue and Swinnen2009). In some cases, supply chain operators provide both production standards and the means to implement them (provision of inputs and equipment, services, credit and forums for the exchange of information between farmers). Small-scale farms in the same supply chain area are characterized by diverse trajectories, resources, production objectives, practices and performance (Holmann et al., Reference Holmann, Rivas, Carulla, Rivera, Giraldo, Guzman, Martinez, Medina and Farrow2003; Le Gal et al., Reference Le Gal, Kuper, Moulin, Puillet and Sraïri2007). Supply chain operators may regard this diversity as a constraint hindering the adoption of technical recommendations proposed to help farmers meet their quantity and quality objectives and avoid seasonal fluctuations.
Using the example of a supply chain in the Cerrados of Brazil, where newly established small-scale dairy farms are linked to an industrial dairy, this study analyzes whether family farms adopt a production benchmark promoted by dairy sector actors and how they diverge from it. After presenting the study method, we describe the proposed production benchmark. We then describe how the six farms in the study diverge from this benchmark before identifying the determining factors explaining this divergence. In the concluding section, we discuss the possible consequences of the farm diversity on the performance of the collection area and actions that could be taken to reduce constraints observed at the farm level.
Material and methods
Context
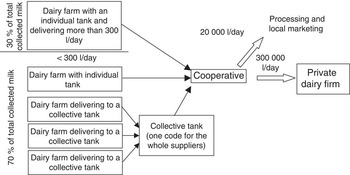
The study was undertaken in the municipal district of Unaí (16.35°S, 46.90°W), in the Brazilian state of Minas Gerais. Located in the heart of the Cerrados, a vast savannah ecoregion, this district has a tropical climate with two seasons: a 5 to 6 month dry season (April to September) and a rainy season (October to March) in which the annual rainfall of 1200 to 1400 mm is concentrated. The average annual temperature is 24.4°C. A dairy cooperative has been operating there for approximately 40 years. It collects 320 000 l/day of milk over a 200 km area. Most of the production is delivered to a dairy firm (Figure 1). The post-milking cold chain is ensured by three types of tanks: individually owned tanks, tanks shared by a few neighboring farmers and collective tanks owned and managed by formal farmer groups. The payment system, which is set by the dairy firm, includes a base price (0.30 BRL/l in March 2009 or 0.10 EUR/l) and several bonuses and penalties related to the quality (milk protein and fat content, standard plate and somatic cell counts) and quantity of milk delivered (bonus for large suppliers) that can more than double the final price paid to the farmer: −0.13 to +0.17 BRL/l for quality, +0.02 BRL/l for temperature and up to +0.12 BRL/l for quantities of 300 l/day and over. Small-scale farms (<300 l/day according to the cooperative) supply up to 70% of the cooperative's milk collection, which make them of specific importance for this company. These farms in Unaí have an average size of 45 ha, compared to 620 ha for large-scale farms (Instituto Brasileiro de Geografia e Estatística (IBGE), 2006).
Simplified representation of the supply chain including the six farms studied.

Some of the 1047 suppliers registered in 2007 were beneficiaries of the national agrarian reform process. These farmers obtained land when vast farms were dismantled to create new settlements regrouping several dozen land reform beneficiaries. Each beneficiary was given title to 20 to 100 ha of land. These farmers favor dairy production because it allows them to earn regular and relatively secure incomes on farms considered to be fairly small by Brazilian standards (Xavier et al., Reference Xavier, Oliveira, Almeida, Gastal, Rocha, Macena and Scopel2007), while benefitting from easy access to credit for inputs whose cost is deducted from milk payments. They sometimes organize themselves into farmer groups to acquire and manage refrigerated milk-holding tanks. They account for an important part of the cooperative's milk collection but it is difficult to identify the exact amount. Seven dairy groups are among the 50 largest suppliers; the most important delivered 2.1 million liters of milk in 2007.
Case study methodology and farm sampling
The agrarian reform farms are an interesting basis for a study of the relationship between an industry-defined dairy production benchmark and family farm diversity. For the most part, the beneficiaries of the agrarian reform are still in a stage of learning: none have operated their farm for >25 years and many have been operating for <10 years. The farms are developing under varying conditions in terms of access to electricity and roads, and have different investment capacities.
The study aimed to achieve an in-depth understanding of farmers’ strategies and practices and the impact of these on farm performance, to determine why the production benchmark was or was not applied. This objective, combined with a lack of quantitative and qualitative raw data at the farm level, led us to select a case study methodology based on a small but diversified sample of farms. This methodology is common in research seeking to understand farmers’ strategies. It has, for example, been used to study land use by sheep farms (Girard et al., Reference Girard, Bellon, Hubert, Lardon, Moulin and Osty2001), work organization in dairy farms in Amazonia (Hostiou and Dedieu, Reference Hostiou and Dedieu2009), the extension of cattle production into newly cleared forest areas (Muchagata and Brown, Reference Muchagata and Brown2003) and water use efficiency on dairy farms in irrigation schemes (Sraïri et al., Reference Sraïri, Rjafallah, Kuper and Le Gal2009b). Six farms were selected in such a way as to cover a wide range of situations with regard to: (i) the date the farmer's settlement was established, (ii) the date the dairy farmers group was established and (iii) the organization of the dairy unit (start of cattle production, herd size and breed) and fodder production (pasture management and type of fodder distributed).
Data collection
The study with the six farmers took place over a 12-month period (July 2008/June 2009) and combined the collection of qualitative and quantitative data. Semi-structured interviews made it possible to reconstruct the farmer's trajectory from the time he set up his farm to his current mode of operations. Interviews also aimed to identify the rationale for farmer's choices. Quantitative measurements were made to characterize milk production management and to evaluate technical and economic performance. The information collected covered: herd composition and animal movements; milk production of individual cows and distribution of dietary rations; grazing schedule; reproduction events (artificial insemination or service, calving); cropping operations and cash flows (sale of milk and meat, purchase of inputs and rental of services). One of the farmers (F5) was monitored only during the first 5 months of the study due to his limited availability.
Semi-structured interviews also were conducted with research scientists who have worked for many years on providing support to agrarian reform farms (Oliveira et al., Reference Oliveira, Xavier, Almeida and Scopel2009) and with professionals working in the agriculture sector. Individuals interviewed included the director of the cooperative, a technical officer of the cooperative, a representative of the main agriculture union and a technical advisor from the government rural development and support division. Each respondent was asked to (i) describe the production standards in the collection area, (ii) explain his understanding of small-scale dairy production in the region, (iii) identify the principal problems and (iv) suggest areas for future improvements, both in terms of technical practices and with regard to institutional levels.
Data analysis
As the production standards recommended by the various actors in the dairy sector were similar, we reconstructed a ‘benchmark farm’ that combined all of the technical recommendations directed to small-scale dairy farmers. Statistical analyses were not carried out due to the characteristics of the sample, which was small and not statistically representative of the family-based dairy farms in the region. Instead, each of the farms was compared with the benchmark based on its specific characteristics, practices and outputs. We then formalized the processes explaining the disparities between the proposed benchmark and the choices made by the dairy farmers.
Calculations of the stocking rate use the Brazilian animal unit (AU), which corresponds to a 450 kg cow. Calculations of nutritional requirements and the analysis of dietary rations are based on the National Research Council (NRC) recommendations (NRC, 2001). Milk production calculations are based on quantities sold: the average annual milk yield per cow is equal to the annual volume delivered divided by the average monthly number of cows present, which takes into account the cows’ unproductive periods. The daily milk production per cow is equal to the daily quantity delivered divided by the mean number of cows milked the day monitored. Calculations of the gross margin include, on the earnings side, the sale of milk and animals and, on the expenses side, the following categories: forage (production, rental of fields and direct purchase of fodder), concentrates and mineral salts, and others such as expenses related to veterinary care, reproduction and the maintenance of equipment and buildings. Milk production cost calculations include, under expenses, the depreciation of equipment.
Results
A mainstream production model
The benchmark farm was reconstructed by taking into consideration each individual recommendation to be achieved. It is a family farm (a couple and their children) specialized in milk production. It is equipped with a milking parlor with milking buckets, a milk storage tank, a cart and an electric feed mill to prepare the forage fed to cattle. The use of this equipment presumes that the farm is connected to an electricity network.
The daily production objective is 330 l, of which 300 l is marketed; this volume is the threshold at which bonuses for quantity begin to be added to milk payments. The genetic type of the herd is a cross of zebu (Gir) and humpless cattle (Holstein), which combines the sturdiness of the Gir breed (notably its resistance to heat and disease) and the productivity of the Holstein. No ratio of Gir–Holstein blood is recommended to farmers, but the cooperative tries to improve the local herd genetics by selling Holstein heifers inseminated with F1 Holstein–Gir semen. The production potential per cow is 4500 l per lactation with a lactation period of 275 days (Freitas et al., Reference Freitas, Durães, Freitas and Barra2001), and a peak production of 20 l (Negrão and Marnet, Reference Negrão and Marnet2006). The daily production objective is achieved with a herd of 20 cows in lactation, or 26 dairy cows in total given a 90-day drying off period, an average estimated based on the values provided by Guimarães et al. (Reference Guimarães, Alves, Da Costa, Silva, Costa and Zamperlini2002;77 days) and Ferreira et al. (Reference Ferreira, Sá, Camargo and Viana2001; 100 days for heifers). Five heifers are kept each year to ensure a 20% replacement rate (culling after five lactations). The others are sold when they are between 6 and 12 months old. The dairy cows and their young thus represent 36.25 AU. Artificial insemination is used and it is assumed that the farmer has acquired a liquid nitrogen canister to conserve the frozen sperm.
The feeding system is divided into two periods: 6 months of grazing, from November to April, on grasslands sown with Brachiaria (B. decumbens and B. brizantha) and 6 months of foddering, from May to October. Grazing takes place in rapid rotation (3 days of grazing, 30 days of regrowth) and fertilizers are used on pastures; this makes it possible to achieve a production of 20 t DM (dry matter)/ha (Oliveira, Reference Oliveira2006). During the rainy season, 7.1 ha of grassland are required to feed the entire herd. Foddering during the dry season is obtained with green sugar cane or silage fodder: maize, sorghum or Napier grass, distributed ad libitium, or a daily quantity of 13 kg DM/cow. To meet the needs of the herd over 6 months (maintenance and lactation/growth requirements), 4.5 ha must be sown with cane and 5.8 ha with silage maize, based on respective DM yields of 17.25 and 13.5 t/ha and nutritional attributes as found in the literature for similar conditions of production (Lana, Reference Lana2003). Each type of forage is distributed over half of the dry season. Depending on the type of dry season forage, and without taking into account the replacement of pasture and forage plots, a total of 11.6 to 12.9 ha is thus required to feed the herd throughout the year. This required area is much smaller than the average small-scale farm area found in the region and in the sample (Table 1). This difference leads us to assume that smallholder dairy farms are less efficient with regard to forage yields and pasture productivity than expected in the benchmark.
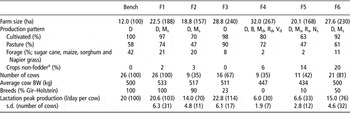
Structural circumstances of the benchmark farm and of the six farms studied (base 100 for the benchmark)

D = dairy cattle; M = maize; B = beef cattle; R = rice; V = vegetables; N = bean; s = self-consumption, d = sold.
aProduction levels and sales were not collected in the survey. F4 is the only case selling non-fodder production.
The herd is given supplements throughout the year; the recommended amounts are 1 kg of 22% crude protein concentrate for 2 to 4 l of milk produced. This concentrate is supplied by the milk collector to compensate for the low but variable protein content of local pastures and forages. If these technical recommendations are implemented, and assuming the desired technical performances are realized, the variable production cost is estimated to be 0.39 BRL/l. Given the current base price, this benchmark farm is profitable only if the farmer earns bonuses for quality. This profit must cover the opportunity cost of family labor and the fixed costs linked to livestock buildings and equipment that were not included in our calculations as they were difficult to estimate in that context.
Actions in the farmers’ environment to facilitate the spread of the benchmark
The cooperative only collects milk from farmers who have access to a refrigerated milk tank that is essential for the maintenance of the cold chain. Farmers who do not have access are excluded from the collection. In the most recently established settlements, where infrastructure (electricity, water and roads) was previously non-existent, access is contingent initially on public investments. Later, it depends on the capacity of farmers to organize themselves into groups to purchase and manage a collective storage tank. Such group acquisitions make it possible for many small-scale farmers to engage in dairy production. The research development project conducted by EMBRAPA (Empresa Brasileira de Pesquisa Agropecuária) in this region contributed to the emergence of such groups (Oliveira et al., Reference Oliveira, Almeida, Macena Da Silva and Scopel2008). Farmers may also deliver milk through individual arrangements with other farmers who already have the required equipment.
The payment system established by the dairy firm aims to incite farmers to produce high chemical and bacteriological quality milk while adjusting the quantity delivered to meet the market demand. This system is supported by a series of measures giving farmers the means to achieve these quantity and quality objectives. The dairy cooperative and other businesses in the region ensure the marketing of inputs, genetics (improved heifers and bull semen) and dairy production equipment. Technical and veterinary advice and practical training also are given to all interested members at the cooperative's head office. Finally, a technical–economic support program has been implemented for three groups of 15 farmers who deliver >300 l/day. However, as they do not attain this production, none of the farms in our sample participate in this program.
Comparison of farms with the benchmark
As we shall explain below, none of the sample farms, referred to henceforth as F1, F2, F3, F4, F5 and F6, correspond exactly to the benchmark farm in terms of its structure or production system (Table 1). The sale of milk to the cooperative constitutes the main source of revenue for five of the farms, only F4 has not specialized in dairy farming, combining instead crop production with dual-purpose cattle production. None of the farms earn off-farm income. In the six cases, farm work is carried out exclusively by the farmer and his wife, although all have one to three children, and the available land is sufficiently large enough to implement the benchmark recommendations. F1 and F3 are equipped with a milking parlor with milking buckets and an individual storage tank. F2, F4, F5 and F6 milk cows manually and deliver the output via a collective tank. In contrast, all of the farms are equipped with an electric feed mill to prepare forage. The percentage of the cultivated area in relation to the total area varies from 63% to 98% depending on how much of the land has been cleared of residual Cerrado forest (F5) and whether some land is inappropriate for cultivation (F4) or unproductive under the techniques used by the farmer (F2). The number of cattle is less than or equal (F1) to the benchmark herd. Only F1 and F2 own a majority of Gir–Holstein animals, the recommended genetic type. Production at the peak of lactation, reflecting in part the genetic potential of the cows, shows that the cows on F1 and F3 (mostly Gir–Holstein and Holstein) correspond to the potential targeted in the benchmark (Table 1).
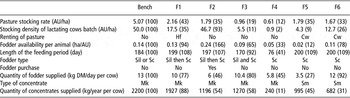
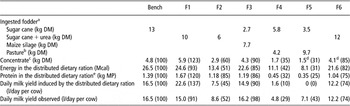
The recommended feeding system is found on four farms (Table 2). F1, F2, F3 and F6 have fodder crop areas of at least 0.1 ha/AU, which enables them to distribute forage over 170 to 200 days of the dry season. However, the daily dietary rations distributed are slightly less than those recommended. Feeding during the rainy season is based on grazing, but with a fairly low stocking rate: 0.96 to 2.16 against the 5.07 AU/ha recommended. Only F2 follows the recommended rapid rotation, with a stocking density of the lactating cow batch accounting for 46.7 AU/ha. The farm's pastures are not always sufficient, highlighting a productivity problem. When this is the case, animals are sent to graze on other farms. In contrast, the feeding systems on F4 and F5 diverge widely from the benchmark. Forage crop areas are very small, leading to a very short period of trough distribution (76 days on F4) or very low quantities distributed (3 kg DM/day per AU on F5). On these farms, pasture intake deduced from the observed milk production during the dry season would be the equivalent of half the DM lactating cows need (Table 3). All of the specialized farmers systematically distribute concentrates. F4 limits himself to occasional distributions. F1, F2 and F3 purchase their concentrates at the cooperative and distribute it proportionally to individual production. F5 and F6 make a dietary ration based on maize, soya and cotton that is partially produced on farm.
Feeding systems of the benchmark farm and of the six farms studied (base 100 for the benchmark)

AU = animal unit; DM = dry matter; Sil = silage; Sc = sugar cane; Mk = bought on the market; Hf = for heifers; Cw = for dairy cows; Sm = self-made.
Average dietary rations of lactating cows in dry season (base 100 for the benchmark)

DM = dry matter; MP = metabolizable protein; TDN = total digestible nutrient.
aNutritional values from Lana (Reference Lana2003): sugar cane: 4.31% CP/60.7% TDN; maize silage: 8.03% CP/63% TDN.
bQuantity required for achieving the monitored production.
c22% CP/80% TDN.
dQuantity of market concentrate (22% CP) supplying the equivalent MP quantity of self-made concentrate feed.
eIncluding fodder, concentrate and urea.
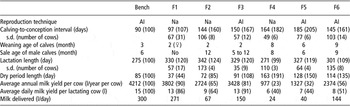
Only three farms employ artificial insemination (Table 4). F3 and F6 are equipped with a liquid nitrogen canister to inseminate their cows on their own, whereas F5 has his cows inseminated by a neighbor. While natural mating is logical on F4, which is a non-specialized farm with a mixed herd, F1 and F2, which in contrast have adopted recommendations with regard to breeds and feed, also rely on natural mating. The management of calves also differs from the benchmark. F4, F5 and F6 wean calves late; males are sold at widely varying ages, less than or over the 6 months recommended.
Dairy practices and performances of the benchmark farm and of the six farms studied (base 100 for the benchmark)

AI = artificial insemination; Na = natural mating; ♀ = female only – male killed.
The daily quantities of milk delivered are less than the objective targeted in the benchmark (from 8% to 90% of the targeted 300 l/day), with F1 reaching closest to the target (Table 4). This is due first to the smaller herd size, with the exception of F1, and then to the productivity per cow. With a production per cow and per year of 3800 l, F1 again comes closest to the results expected in the benchmark, evaluated at 4200 l. This result is explained by a good average productivity per day and per lactating cow, a 1-year interval between calving and a long lactation period. F2, F3 and F6 have a lower per cow and per year production despite the partial adoption of benchmark techniques. This is linked to lower reproduction performance, with calving to conception intervals of 145 to 150 days and 14-month intervals between two calvings, associating long lactation periods with longer drying off. Production per day and per lactating cow also is lower on F2 and F6. Reproduction and milk production benchmark performances thus are not achieved despite the partial adoption of recommendations. Lastly, performances are well below the benchmark on F4 and F5, but are consistent with low-output breeds and a reliance on grazing even in the dry season during which the production made possible by forage and the consumption of concentrates by each cow is low and very low on the two respective farms (Table 3).
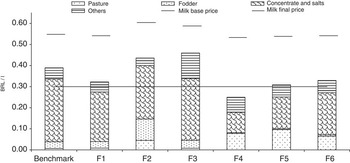
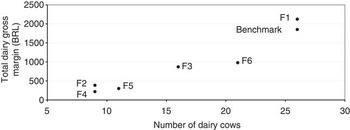
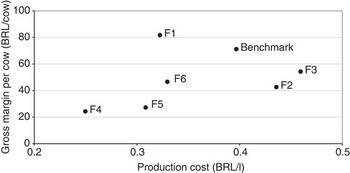
This diversity leads to a large variability of production cost per liter of milk, an indicator that combines the level of milk productivity and the type of practices used by the farmers (Figure 2). F4's costs are the lowest and fall below the base price of milk due to the farmer's lower investment in dairy production. The other farms follow the benchmark case with costs ranging between the base and final milk price, which include premiums linked to milk quality. F2 and F3 have the highest costs. In the case of F2, this is due to silage expenses; in the case of F3, to the purchase of concentrates – that nevertheless do not translate into better performance – and more regular veterinary care. F1, F5 and F6 have production expenses close to the benchmark, both in terms of total amount and of expense origins. Despite these production costs exceeding the milk base price, total dairy gross margins per farm are positive for the whole sample, thanks to the premium paid by the cooperative for milk quality (Figure 2). The total dairy gross margin per farm is linked to the herd size (Figure 3), which highlights primarily an effect of scale but also the variability of stocking rate per farm within the sample (Table 2). For instance, F1 shows a larger herd and higher gross margin than F6 with similar forage and pasture areas. This variability of practices and of impact on technical and economic performances is also highlighted by the fact that there is no link between the gross margin per cow and the production cost. For instance, with similar production costs, F5 and F6 perform poorly compared to F1 (Figure 4). As a result, F4 has the lowest revenue due to a small herd with a low productivity per cow, while F1 performs better than the benchmark, thanks to a very efficient use of inputs and a large herd. F2 and F3 do not translate their high production costs into high revenues, while F6 earns much lower revenue than F1 with a similar herd size.
Production cost for a liter of milk and distribution of expenses per origin in the benchmark and the six farms studied.

Relationship between herd size and total livestock gross margin in the benchmark and the six farms studied.

Relationship between production cost and total livestock gross margin per cow in the benchmark and the six farms studied.

Farm dynamics and farmers’ strategies
This analysis shows that none of the farms in the study conform completely to the recommended production benchmark. However, three types of positions emerge in our sample in relation to the production benchmark proposed by actors farther down the dairy supply chain.
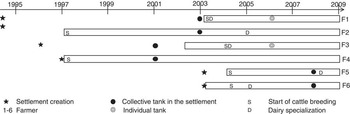
One group, composed of F1, F3 and F6 is positioned to immediately implement the benchmark. They established their farm with a dairy project in mind based on a relatively large herd (over 15 head) and a projected production of over 140 l/day. They aim to produce about 500 l/day within a few years without actually knowing whether this is feasible. Their establishment several years after their settlement was created allowed them to benefit upon their arrival from prior investments in (i) roads, electricity and water networks and (ii) milk tanks owned collectively or shared by individuals (Figure 5). The livestock feeding practices assume to supply a sufficient dietary ration for the entire herd. Grasslands used for rotational grazing are sown in a uniform and dense fashion, which farmers keep from being invaded by ligneous plants. They were set up before the purchase of the animals.
Trajectory of the six farms studied.

This type of management achieves the best results in the sample both in terms of the estimated productivity of the pastures, from 3.6 to 4.6 t DM/ha per year, and with regard to milk productivity, by combining high stocking rates and output per cow. This type of management remains nevertheless markedly less productive than that proposed in the benchmark as no nitrogen fertilizer is applied after the grasslands are established. The size of the area under forage crops is determined to meet herd requirements and on-demand distribution of forage in order to maintain a production equal to that of the rainy season. The choice between ensilage and sugar cane is made according to the available areas (F1), the nutritive quality of the forage produced (F3) or the crop production cost (F6). The quantities distributed come close to the recommended 13 kg DM. Distributed concentrate is the cooperative's concentrate or a mix of rich feed, but in both cases quantities are those recommended by the commercial feed manufacturer. The objective is to let dairy cows realize their potential. Room for progress is possible in the area of reproduction performance to achieve the annual benchmark performance. Although the dairy revenues of these three farms always are positive, they are very different, highlighting the difficulties encountered by F3 and F6 in translating input consumption into high milk productivity.
A second group, composed of F2 and F5 is trying to achieve the benchmark in successive stages. They established their farms to achieve a better standard of living than that of a farm worker. The dairy activity developed as their farms evolved and is based on herds of a dozen cows and a production of 40 to 70 l/day. Their current objective is limited to the short term (the following year) and to a production threshold of 150 l/day. This group corresponds to farms that began dairy production on the basis of limited initial investments and are counting on internal herd growth to increase production. The feeding system is characterized by grasslands used for rotational grazing where the species sown do not cover the entire area and where there is a significant density of ligneous plants. They were grazed very rapidly after being sown because the farmers already owned a herd (F2) or were progressively constituted to accompany the enlargement of the herd and to diminish the initial investment (F5).
The size of the area under forage crops is determined to adjust the sown area to cash available at the moment of sowing. Forage can be purchased if there is a deficit during the dry season (F2). This strategy proves to be difficult to implement, as it requires a sufficient amount of cash to purchase the forage needed to cover the nutritional needs of the entire herd, including non-productive heifers. In the case of F5, the dietary ration is adapted to the forage availability. These farms thus find themselves caught in a vicious circle where a lack of cash limits the purchase of forage and investment in grasslands, leading to unbalanced dietary rations. This in turn impacts milk production and dairy revenues, whose mediocre levels do not make it possible to improve significantly the farm's cash position.
The third group, composed of F4, corresponds to a coherent farming system in which the dairy unit's secondary role is matched by low expenditures. The size of the herd therefore is limited (<10 cows) and the milk production delivered is low (<25 l/day). Consequently, while the cows’ yields are low, so are production costs, which are the only ones to be less than the base price paid by the cooperative. This group thus has the opportunity to earn a low positive revenue from the dairy activity, complemented by revenues from meat production. However, from the cooperative's point of view, this group is not very interesting, as it cannot contribute to an increased quantity of milk collected.
The first two groups constitute, in contrast, the cooperative's preferred targets in order to increase its milk supply. However, the fact that their production costs are above the current base price shows how sensitive these systems are to fluctuations in the base price (the base price was cut in half between the start and end of the study) and to the nature of the qualitative and quantitative bonuses. The rationale of the proposed production benchmark is not fundamentally called into question by these farms, but its implementation can run up against both financial and technical capacity constraints that affect farm performance. Their repercussions may be felt over several years depending on the joint dynamics of the herd and forage areas.
Discussion
The benchmark reconstructed here for the needs of the analysis was not recommended as such to the farmers. This technical system possesses its own internal rationale based on the combination of a certain herd size with a sound grasp of feeding and reproduction principles. This combination renders it possible to make the most of dairy cows’ genetic merit and to earn a significant income from a dairy activity conducted on a small-scale farm. However, it assumes a very intensive production system since the expected milk production accounts for 9140 l/ha of pasture and forage. This performance is much higher than the 2200 l/ha observed on large-scale dairy farms in the same area (around 250 ha devoted to 160 dairy cows per farm; Carvalho et al., Reference Carvalho, Ramos and Lopes2009). It was never observed on farms in the sample, where the best farm (F1) reached 4600 l/ha. This large gap would suggest that the expected yields of pasture and forage used in the benchmark are overestimated, especially since variations between years and loss of productivity are not taken into account. The production costs calculated on our sample show that such a benchmark is economically viable with the current milk price only if the farmer is able to benefit from the bonuses linked to the quality and quantity of milk delivered. This holds even truer when the fixed expenses related to investments in the herd and equipment are taken into account. In such a pricing context, the implementation of this benchmark involves taking a risk that farmers must manage according to their own constraints and dynamics.
Five of the six farms studied pursued an objective of dairy specialization based on a technical system close to the benchmark. This system, characterized by the joint utilization of forage crops during the dry season and concentrates throughout the year, is common on the small-scale farms located in the Cerrados area (Bainville et al., Reference Bainville, Affholder, Figuié and Madeira Netto2005). It allows them to obtain a regular income from a dairy supply chain that is well structured in Brazil. The supply chain is based on an increasing market demand and large industrial firms and cooperatives that are ready to collect milk over large areas as long as milk conservation can be ensured. Nevertheless, the farms in our sample showed a variability of income resulting both from scale effects and capacity to translate inputs into high milk productivity. This variability of technical and economic performances is linked to differences in terms of dairy orientation and cropping and dairy practices that derive from three types of factors affecting the farmers’ strategies. The first involve the farm environment in terms of infrastructure and utilities. In their absence, an agro-processing industry such as the dairy industry, one that involves perishable primary material and continuous flows, cannot include among their suppliers small-scale farmers delivering low individual volumes. The Brazilian case emphasizes the importance of synchronizing collective investments, whether public or private, and individual decisions. Once these investments are made, the involvement of farmers in the collective management of refrigerated milk tanks stimulates an increase and improvement in production (Oliveira et al., Reference Oliveira, Rocha and Xavier2006).
The second category of factors pertains to the individual strategic choices of farmers and their interest in dairy activities. The example of F4 shows that not everyone will choose an activity in which production costs are relatively high and sale prices are not necessarily attractive. The decisions of actors farther down the supply chain with regard to the payment system and related services (supply of inputs and credit) are decisive elements in the farmers’ own decisions to respond to the dairy firm's demand for milk. However, other elements may interfere in this client–supplier relationship: on the side of farmers, competition with other agri-food supply chains; on the side of the dairy processor, market demand (growth or fall) and the opportunity to find other sources of supply. In the Brazilian case, the small-scale farmers on agrarian reform farms are at a disadvantage. While they have few production alternatives, the cooperative collects over an area in which it may be possible to locate more efficient suppliers.
The third category of factors involves the mastery of techniques proposed in the benchmark to maximize the animals’ genetic potential. The problems found in Brazil with regard to animal reproduction and feeding are widespread on this type of farm (Espinoza-Ortega et al., Reference Espinoza-Ortega, Espinoza-Ayala, Bastida-Lopez, Castaneda-Martinez and Arriaga-Jordan2007; Ferreira et al., Reference Ferreira, Cattoni, Cáceres and Frutos2007; Tillard et al., Reference Tillard, Humblot, Faye, Lecomte, Dohoo and Bocquier2008). Although the interval between calving on farms practicing artificial insemination is longer than 415 days, indicating problems with fertility, it corresponds to the average results recorded in Brazil for livestock farmers of Gir–Holstein crossbreeds (Facó et al., Reference Facó, Lôbo, Martins Filho and Lima2005). Not all livestock farmers have extensive experience feeding animals and some are even unfamiliar with feed formulation principles. At the level of the cow, this leads to the design of unbalanced dietary rations; at the level of the farm, to shortages of forage supplies. The planning of forage supplies based on estimates of annual herd requirements is a difficult task for which farmers do not yet appear to be adequately prepared. Moreover, the technical system is based on high hypothetical pasture and fodder yields that need to be investigated further under farmer field conditions, especially in relation to fertilization management. Farmers tend to consider that the best way of increasing revenues is by increasing herd size. However, higher production objectives cannot be achieved without more intensive pasture management because nearly all available land on the farms is already under cultivation.
Unbalanced dietary rations have a direct impact on a farm's dairy performance, and consequently on the farm's cash position. These financing difficulties often reflect choices made by livestock farmers that can lead them onto a path of disinvestment, which is the opposite of that proposed by the benchmark: reduction in herd numbers, poor maintenance of pastures and underfeeding of animals. Despite these difficulties, the performances observed in the farm sample show that intensifying dairy production can be a profitable strategy. But this profit is sensitive to the milk pricing context and the farmers’ capacity to control the biotechnical processes leading to high cow productivity and good quality of milk. Controlling milk quality, both chemical and hygienic, is particularly critical when dairy revenues are linked to the quality premium paid by the milk collector, as was the case during this study. It is closely linked to farmers’ feeding and milking practices that are quite variable in small-scale farms (Sraïri et al., Reference Sraïri, Benhouda, Kuper and Le Gal2009a). In that respect, significant improvements could be achieved assuming relevant support is provided to small-scale farmers. This point is being explored further with the design and testing of an advisory approach for dairy farmers based on the use of a simulation tool, the original version of which was tested in Morocco (Le Gal et al., Reference Le Gal, Kuper, Moulin, Sraïri and Rhouma2009). The objective is to provide personalized assistance to livestock farmers using scenarios that make it possible to compare the different development options that are available to their farming systems given their objectives and investment capacities. The hypothesis is that this tool will become integrated into advisory programs implemented by the cooperative, complementing training programs on the basic knowledge needed to master dairy farming techniques, such as animal feeding and milking or forage cultivation.
This example confirms that it is possible for small-scale farmers to become involved in an agro-industrial sector such as dairy. Within such sectors, they find a means of accessing inputs and markets that otherwise would be closed to them. Meanwhile, agro-processing firms find a source of raw material at a cost that can be equivalent or less than that of large farms (Carvalho et al., Reference Carvalho, Ramos and Lopes2009). This situation is also encountered in Morocco on large-scale irrigated schemes (Le Gal et al., Reference Le Gal, Kuper, Moulin, Puillet and Sraïri2007), in Peru where industrial and small processing firms are competing in the same supply areas (Aubron, Reference Aubron2007) and Eastern European countries where the privatization of the dairy sector has not been accompanied by a reduction in the number of small farms (Dries et al., Reference Dries, Germenji, Noev and Swinnen2009).
Conclusion
The involvement of small-scale farmers in an industrial dairy supply chain leads to a diversity in production forms. The technical and economic benchmark proposed by the dairy cooperative cannot be systematically or entirely adopted by this type of farmer, particularly when the farm is still in the process of being established. The reasons identified pertain as much to the farmers’ environment as to each farm's own evolution. The farms in which milk is a side activity have no economic interest in following the benchmark recommendations. Indeed, they are not the preferred target of the cooperative because they generally deliver small and irregular volumes. The farms trying to implement benchmark recommendations, and on which milk collection is based, are sometimes hindered by inadequate technical skills that diminish their performance. Consequently, intensive production strategies do not systematically lead to higher revenues but can, in some cases, lead to disinvestment in dairy activities.
This dynamic rapidly results in a diversity of situations that the cooperative should recognize when setting supply policy (should certain farmers be excluded through a dissuasive pricing policy?) and when organizing support for farmers interested in developing a dairy activity. Should the same technical package be provided to everyone, or should farmers be accompanied in a more individual manner that is adapted to the development dynamic of individual livestock farms? These issues should be addressed by both farmers and collectors in the framework of innovative decision support approaches that remain absent in the Brazilian case studied here.
Acknowledgements
The authors thank Davi de Jesus Soaris da Silva and Maria da Conceição Silva Soares for their logistical and technical support during the interviews with the farmers, Marcelo Nascimento de Oliveira, research scientist at EMBRAPA, for his advice and his documentary contribution to the study, and Eric Scopel, research scientist at Cirad, who facilitated and guided the field work. They also thank the farmers in the working group for their time and patience during the study. They are grateful to Grace Delobel for translating this paper from French to English.