1. Introduction
The fight against climate change has materialized in the majority of countries through institutional agendas aimed at the consolidation of so-called green economies (Chen and Yang, Reference Chen and Yang2024). These green economies revolve around the process of reducing dependence on processes, activities and techniques that involve extensive use of externalities affecting environmental quality, primarily carbon dioxide (CO2) (UNEP, 2023). One of the main determinants of increased CO2 emissions, a key factor in greenhouse gas presence resulting from local economic activities, is energy consumption (UN, 2024). Consequently, numerous countries have committed to achieving net zero emissions by 2050, a plan that is operationalized through reducing reliance on fossil fuel resources, which are carbon-intensive, in favour of renewable energy sources (Ministry of Environment, 2023). Regions such as Europe, Asia and Latin America have made commitments in this regard. Most of these regions, which have traditionally been intensively studied in the literature (Dam and Sarkodie, Reference Dam and Sarkodie2023; Wang and Uctum, Reference Wang and Uctum2024), have a high- or upper-middle-income level and are relatively well connected within local trade flows. Thus, green economies are understood as part of an economic growth process aligned with the demands of international policies characteristic of developed countries, referred to as green growth (Sarkodie et al., Reference Sarkodie, Owusu and Taden2024).
However, the global green growth paradigm rests on assumptions of fiscal capacity, institutional depth and market integration that do not hold for a critical group of countries largely absent from this literature. Small Island Developing States (SIDS) exist at the structural margins of the global economy: remote, fiscally dependent on external flows, and exposed to climate risks that threaten their very territorial integrity, yet compelled to pursue economic development without the industrial base or institutional resources that have enabled the green transition elsewhere. Moreover, they face the handicap of being relatively isolated, to varying degrees, from trade flows, and as such, they have limited industrial activity (Benzaken et al., Reference Benzaken, Adam, Virdin and Voyer2024). Consequently, they are compelled to depend on foreign monetary flows to meet their local socio-economic needs (UN, 2023). In this sense, these monetary flows tend to cover the basic necessities of these countries and stimulate basic infrastructure that contributes to fostering their economies for higher levels of economic growth. However, this economic orientation upon economic growth, although similar to that of developed countries, is not the same, as dependence on foreign aid and the limited development of local industry can lead to economic development that degrades the environment (Murshed, Reference Murshed2023), while developed countries are aiming to grow in respect to the environment (Zhang et al., Reference Zhang, Song and Ma2024).
This relationship has been extensively studied in the literature through the Environmental Kuznets Curve (EKC) hypothesis (Grossman and Krueger, Reference Grossman and Krueger1995), where increases in income lead to pollution, but beyond a certain income level, this relationship reverses, and environmental standards improve. Income has been identified in the literature numerous times as a key determinant contributing to the adoption of green productive resources (Durmaz and Thompson, Reference Durmaz and Thompson2024), primarily renewable energy, which is recognized as the main focus of sustainable economic growth, replacing dependence on fossil fuels (Saqib and Radulescu, Reference Saqib, Radulescu and Apergis2025). Thus, higher income levels enable the adoption of these socio-economic dynamics centred around renewable energies. However, the determinants of this adoption have not been extensively explored in the literature.
In order to increase income levels and consequently promote the adoption and consumption of renewable energy, two factors have been highlighted in the literature: official development assistance (ODA; Wang et al., Reference Wang, Wang and Li2022b; Guo et al., Reference Guo, Wang and Li2024) and foreign direct investment (FDI; Dingru et al., Reference Dingru, Onifade, Ramzan and AL-Faryan2023). Regarding the former, ODA refers to the financial, technical and human resources provided by developed countries with the aim of promoting socio-economic development and poverty reduction in SIDS (OECD, 2023). This assistance supports infrastructure, basic services, education, healthcare, climate change mitigation and institutional strengthening, among others, with the goal of contributing to their improvement and sustainability (Jung et al., Reference Jung, Kim and Kim2024). However, the literature has extensively discussed ODA as an incentive for economic growth, with its main criticisms including lack of transparency in fund allocation, resource orientation towards donors’ political agendas, dependency generated in recipient countries and lack of focus on long-term sustainability (Jakupec and Kelly, Reference Jakupec, Kelly, Jakupec and Kelly2016).
On the one hand, FDI, which is privately motivated, differs from ODA in that its intentionality is primarily justified by economic reasoning, aiming to gain an advantage that improves the competitiveness of the investing company (Dunning, Reference Dunning1979, Reference Dunning1988). While ODA is public and oriented towards satisfying a political agenda, FDI is private and focused on achieving returns on investment with a strong economic component (OECD, 2008). In this sense, FDI, due to its productive orientation, is recognized for its capacity to contribute to economic growth through the transfer of knowledge related to productive activities and technology that can enhance the competitiveness of the local business sector (Nam et al., Reference Nam, Bang and Ryu2023). Therefore, in the long term, FDI contributes to employment, increased competitiveness and income growth (Vujanović et al., Reference Vujanović, Radošević, Stojčić, Hisarciklilar and Hashi2022). However, concerning FDI, and complementary to spillover effects, its relationship with economic impact has been contextualized based on two main hypotheses, namely the Pollution Halo and the Pollution Haven hypotheses (Destek et al., Reference Destek, Yıldırım and Manga2024; Khan et al., Reference Khan, Yuan, Yahong and Ahmad2024). In most research to date, the Pollution Halo Hypothesis tends to be the most relevant, implying that an increase in FDI leads to an improvement in environmental quality due to the transfer of green technologies. However, in the case of developing countries, it appears that the Pollution Haven Hypothesis applies, where an increase in FDI contributes to environmental degradation (Murshed, Reference Murshed2023).
Derived from these relationships and the special emphasis in the literature on energy, alternative variables have emerged that tend to study the economic–energy relationship from a holistic perspective. For example, the development of variables such as energy productivity (Aydin and Erdem, Reference Aydin and Erdem2024), defined as the ratio of GDP to energy consumption, has gained increasing relevance. Due to the growing importance of renewable energy, this ratio can be applied to renewable energy productivity (RenProd; Liang et al., Reference Liang, Wang, Jia and Zhu2023), where we examine the amount of energy input required to produce one unit of GDP. Lower values of this ratio imply higher productivity. However, in developed countries, this relationship is inverse, as their annual investment in renewable energy far exceeds their GDP growth (Xu et al., Reference Xu, Zhang and Lee2024). Therefore, in order to address this research more thoroughly, we consider the relationships between monetary flows and RenProd in SIDS.
The hypotheses studied in this paper are as follows. Regarding ODA and renewable energy consumption (REN), we expect that ODA flows contribute positively to REN, though this relationship is likely contingent on the institutional quality of the recipient country. In SIDS with stronger institutional frameworks, ODA may be more effectively channelled towards green infrastructure and energy transitions, whereas in contexts of weaker governance, ODA risks being absorbed into conventional growth dynamics that do not prioritize renewable energy (H1: Hypothesis 1). Regarding FDI and REN, we anticipate that the direction of FDI’s effect on REN is conditional on the sectoral composition of investment. FDI oriented towards extractive industries or tourism may increase overall energy demand without promoting renewable sources, while FDI involving technology transfer in energy infrastructure may actively support the green transition. Given the structural characteristics of SIDS, including their tax exemption regimes and limited regulatory enforcement, we expect the net effect to lean towards increased energy consumption without a corresponding shift towards renewables (H2: Hypothesis 2). Regarding ODA and RenProd, if ODA is primarily oriented towards economic growth rather than energy efficiency, it is expected to contribute to higher RenProd values by raising GDP more than it raises REN. This relationship, however, may be moderated by the degree to which donor priorities align with the recipient country’s green transition agenda (H3: Hypothesis 3). Finally, regarding FDI and RenProd, we expect FDI to contribute to higher RenProd in SIDS, driven more by its stimulation of economic output than by any direct investment in renewable energy infrastructure. This outcome reflects the broader tendency of FDI in SIDS to prioritize returns on investment within favourable tax frameworks rather than fostering structural energy transitions (H4: Hypothesis 4).
It should be noted that while the above hypotheses acknowledge conditional and non-linear dynamics, the empirical strategy employed in this study tests the average net effects of ODA and FDI on our dependent variables across the full SIDS sample. Full conditional testing is constrained by data availability and the limited degrees of freedom inherent to our panel. We therefore treat the conditional dimensions as theoretical qualifications that inform the interpretation of our results and identify a productive avenue for future research. These hypotheses are visually represented in Figure 1.
Graphical hypothesis flow chart.

Figure 1 Long description
The flowchart presents hypotheses on the effects of Official Development Assistance (ODA) and Foreign Direct Investment (FDI) on economic and green development. The top section shows ODA and FDI leading to economic development, influenced by renewable consumption, conditional on institutional quality (H1). This results in green economies. The bottom section depicts ODA and FDI contributing to green development (H3) and competitive advantage (H4), leading to an increase in renewable energy productivity. Renewable consumption is also conditional on sectoral composition (H2).
This study makes two principal contributions to the literature. Theoretically, it develops a cohesive framework integrating the Pollution Haven and Halo hypotheses, ODA dependency theory and the green growth versus post-growth debate to explain why foreign capital flows in structurally constrained economies may reinforce GDP-oriented dynamics at the expense of renewable energy adoption. Empirically, it provides the first systematic panel analysis of the joint effects of ODA and FDI on both REN and RenProd in SIDS, uncovering a paradox in which both capital flows enhance economic productivity while simultaneously failing to promote the energy transition, and identifying the structural mechanisms – fossil fuel lock-in, adaptation–mitigation trade-offs and relative decoupling – that underlie this divergence.
In order to address these issues, we structure our work into the following sections: Section 2 presents the theoretical framework, Section 3 presents the data and methodology; Section 4 provides the estimation of our results; Section 5 offers the theoretical discussion; and Section 6 presents the conclusions and policy recommendations.
2. Theoretical framework
The relationship between foreign capital flows and energy transition in SIDS can be understood through three interconnected theoretical traditions, each of which speaks to a different dimension of how external finance shapes domestic energy dynamics.
The first tradition draws from Environmental Economics and centres on the tension between the Pollution Haven and the Pollution Halo hypotheses. The Pollution Haven Hypothesis posits that multinational firms tend to relocate productive activities towards jurisdictions with lax environmental regulation, thereby minimizing compliance costs (Murshed, Reference Murshed2023; Destek et al., Reference Destek, Yıldırım and Manga2024). SIDS are structurally prone to this outcome, as their reliance on tax exemption frameworks and their limited institutional enforcement capacity may attract forms of FDI that prioritize cost efficiency over clean technology deployment. The Pollution Halo Hypothesis offers a more optimistic counterpart, arguing that FDI can serve as a conduit for the transfer of green technologies and improved managerial practices that ultimately benefit the host country’s environmental quality (Khan et al., Reference Khan, Yuan, Yahong and Ahmad2024). Whether the haven or halo dynamic prevails depends on both the regulatory context of the recipient country and the sectoral composition of incoming investment. In SIDS, where FDI tends to concentrate in extractive industries and tourism rather than energy infrastructure, the structural conditions suggest the Pollution Haven outcome is more probable. This theoretical tension directly motivates H2 and H4, where we examine whether FDI in SIDS contributes to REN or instead reinforces growth-oriented energy patterns.
Building on this, the second tradition draws from Development Economics and focuses on the institutional dynamics surrounding ODA, which has classically been understood as a vehicle for state capacity building, channelling financial and technical resources towards infrastructure, governance and human capital in recipient countries (Jakupec and Kelly, Reference Jakupec, Kelly, Jakupec and Kelly2016; Jung et al., Reference Jung, Kim and Kim2024). However, a critical strand of this literature argues that ODA frequently reflects the geopolitical and economic priorities of donor countries rather than the developmental needs of recipients, potentially generating dependency and misalignment in how resources are allocated (Wang et al., Reference Wang, Guo and Dong2021; Chapel, Reference Chapel2022). In SIDS, this misalignment takes on particular relevance because their limited fiscal autonomy makes them disproportionately reliant on external assistance to fund even basic infrastructure. Importantly, the extent to which ODA can be redirected towards green transitions is itself conditional on the institutional quality of the recipient country, as stronger governance frameworks are better positioned to align incoming assistance with long-term sustainability objectives. When ODA is directed primarily towards supporting economic growth rather than green transitions, it risks entrenching energy patterns that are incompatible with long-term sustainability goals. This institutional logic grounds H1 and H3, where we assess whether ODA flows orient SIDS economies towards renewable energy or instead deepen conventional growth dynamics.
These two theoretical traditions converge towards a broader theoretical tension that constitutes the third pillar of our framework, namely the debate in the energy transition literature between green growth and post-growth perspectives. The green growth paradigm holds that economic expansion and decarbonization are mutually compatible, with rising incomes progressively enabling the adoption of renewable technologies and cleaner productive systems (Sarkodie et al., Reference Sarkodie, Owusu and Taden2024; Saqib and Radulescu, Reference Saqib, Radulescu and Apergis2025). The post-growth perspective, however, challenges the assumption that GDP-centric development paths are inherently conducive to rapid energy transitions, particularly in economies facing structural constraints such as remoteness, small scale and acute climate vulnerability. SIDS sit at the intersection of both perspectives, as they aspire to the green growth pathway yet lack the industrial base, fiscal resources and institutional depth that have enabled that transition elsewhere. This structural reality suggests that the effectiveness of both ODA and FDI in redirecting SIDS economies towards renewable energy is not uniform but conditioned on institutional capacity, sectoral priorities and the degree of policy alignment between donors, investors and recipient governments.
3. Data and methodology
3.1. Data
In this study, we utilize data from 37 SIDS for the years 1995–2019. The selected countries include Antigua and Barbuda, Bahamas, Bahrain, Barbados, Belize, Cabo Verde, Comoros, Cuba, Dominica, Dominican Republic, Fiji, Grenada, Guinea-Bissau, Guyana, Haiti, Jamaica, Kiribati, Maldives, Marshall Islands, Mauritius, Micronesia (Federated States of), Palau, Papua New Guinea, Saint Kitts and Nevis, Saint Lucia, Saint Vincent and the Grenadines, Samoa, Sao Tome and Principe, Seychelles, Singapore, Solomon Islands, Suriname, Timor-Leste, Tonga, Trinidad and Tobago, Tuvalu and Vanuatu. These countries were chosen based on data availability, aiming to include a comprehensive list of countries. We acknowledge that there is an intentional sample bias as we only include countries that are part of the SIDS, but they still represent a heterogeneous sample with different income levels, geographic availability and population size. For observations with missing data, we employed the technique of carrying forward and backward the known values to fill in the gaps in our data (Little, Reference Little1988). All the data collected here have been obtained from the United Nations page for SIDS (https://sids.data.undp.org/) and transformed logarithmically following the work of Jakobsen and Soysa (Reference Jakobsen and Soysa2006) as follows:
 \begin{equation}x = \log \left( {x \vdash \sqrt {{x^2} + 1} } \right).\end{equation}
The chosen time period spans 1995 to 2019 and is primarily determined by data availability on the United Nations Development Programme SIDS portal, as consistent cross-country values for our full variable set are not available beyond 2019. Substantively, this period is nonetheless analytically meaningful, as it captures the full arc from the pre-Kyoto era through the consolidation of the Paris Agreement commitments, encompassing the gradual increase in income per capita of the studied countries, the improvement of infrastructure and the progressive reorientation of institutional agendas towards the fight against climate change. The post-2019 period, which includes the disruptions of the COVID-19 pandemic and the acceleration of climate finance commitments under the Glasgow and Dubai Conference of the Parties agreements, represents a structurally distinct context whose dynamics our current estimates cannot capture.
Due to the limitations of our data, we employ the REN as a share of total energy consumption (REN) in the studied countries to assess the ecological transition (Pata et al., Reference Pata, Erdogan and Ozcan2023; Estevão and Lopes, Reference Estevão and Lopes2024; Li et al., Reference Li, Liu and Yang2024). It should be noted that Guinea Bissau and Haiti, followed by Comoros, lead in these data (see the right panel of Figure 2). The use of this variable also allows us to calculate the RenProd by dividing GDP by REN. It is important to note that RenProd is defined as GDP divided by REN. This construction implies a mechanical link between the REN and RenProd equations: since both ODA and FDI are found to reduce REN (see Table 1), a positive coefficient on these variables in the RenProd equation is, in part, algebraically expected, since a reduction in the denominator with a stable or growing numerator (GDP) will mechanically inflate the ratio. Therefore, the RenProd results should not be interpreted as an independent finding confirming GDP orientation, but rather as a complementary and consistent lens that reinforces the REN results. The contribution of the RenProd analysis is not to provide orthogonal evidence but to quantify the magnitude of the economic growth orientation embedded in these capital flows relative to the scale of REN.
(a) Mean average values of variables of interest, namely REN, ODA and IFDI. (b) REN values for the year 2019 of the sampled countries. All values are expressed in logarithms.

Figure 2 Long description
The image A showing a line graph with three lines and a legend listing FDI, ODA and Ren. The horizontal axis shows years from 1995 to 2020. The vertical axis shows values from 1.5 to 3.5. The FDI line has values around 1.6 to 2.4 across the years, with a rise to about 2.4 around 2007, then values around 1.8 to 2.2 through 2020. The ODA line has values around 2.0 to 2.6 across the years, with higher values around 2.5 to 2.6 near 2000 to 2003, then values around 2.2 to 2.5 through 2020. The Ren line has values around 3.2 to 3.7 across the years, with higher values around 3.6 to 3.7 near 1999 to 2003, then values around 3.3 to 3.5 through 2020. The image B showing a horizontal bar graph with country names on the vertical axis and Ren on the horizontal axis. The horizontal axis label is Ren, with tick labels 0, 1, 2, 3, 4, 5. The vertical axis lists countries including Vanuatu, Tuvalu, Timor, Trinidad and Tobago, Tonga, Togo, Solomon Islands, Senegal, Sao Tome and Principe, Samoa, Rwanda, Papua New Guinea, Niger, Namibia, Mozambique, Micronesia Federated States of, Marshall Islands, Malawi, Liberia, Kiribati, Guinea Bissau, Haiti, Guinea, Gambia, Fiji, Dominica, Dominican Republic, Cuba, Comoros, Cabo Verde, Cambodia, Burkina Faso, Antigua and Barbuda. Bars extend from near 0 up to about 5, with the longest bars reaching close to 5 and several bars between about 3 and 4.
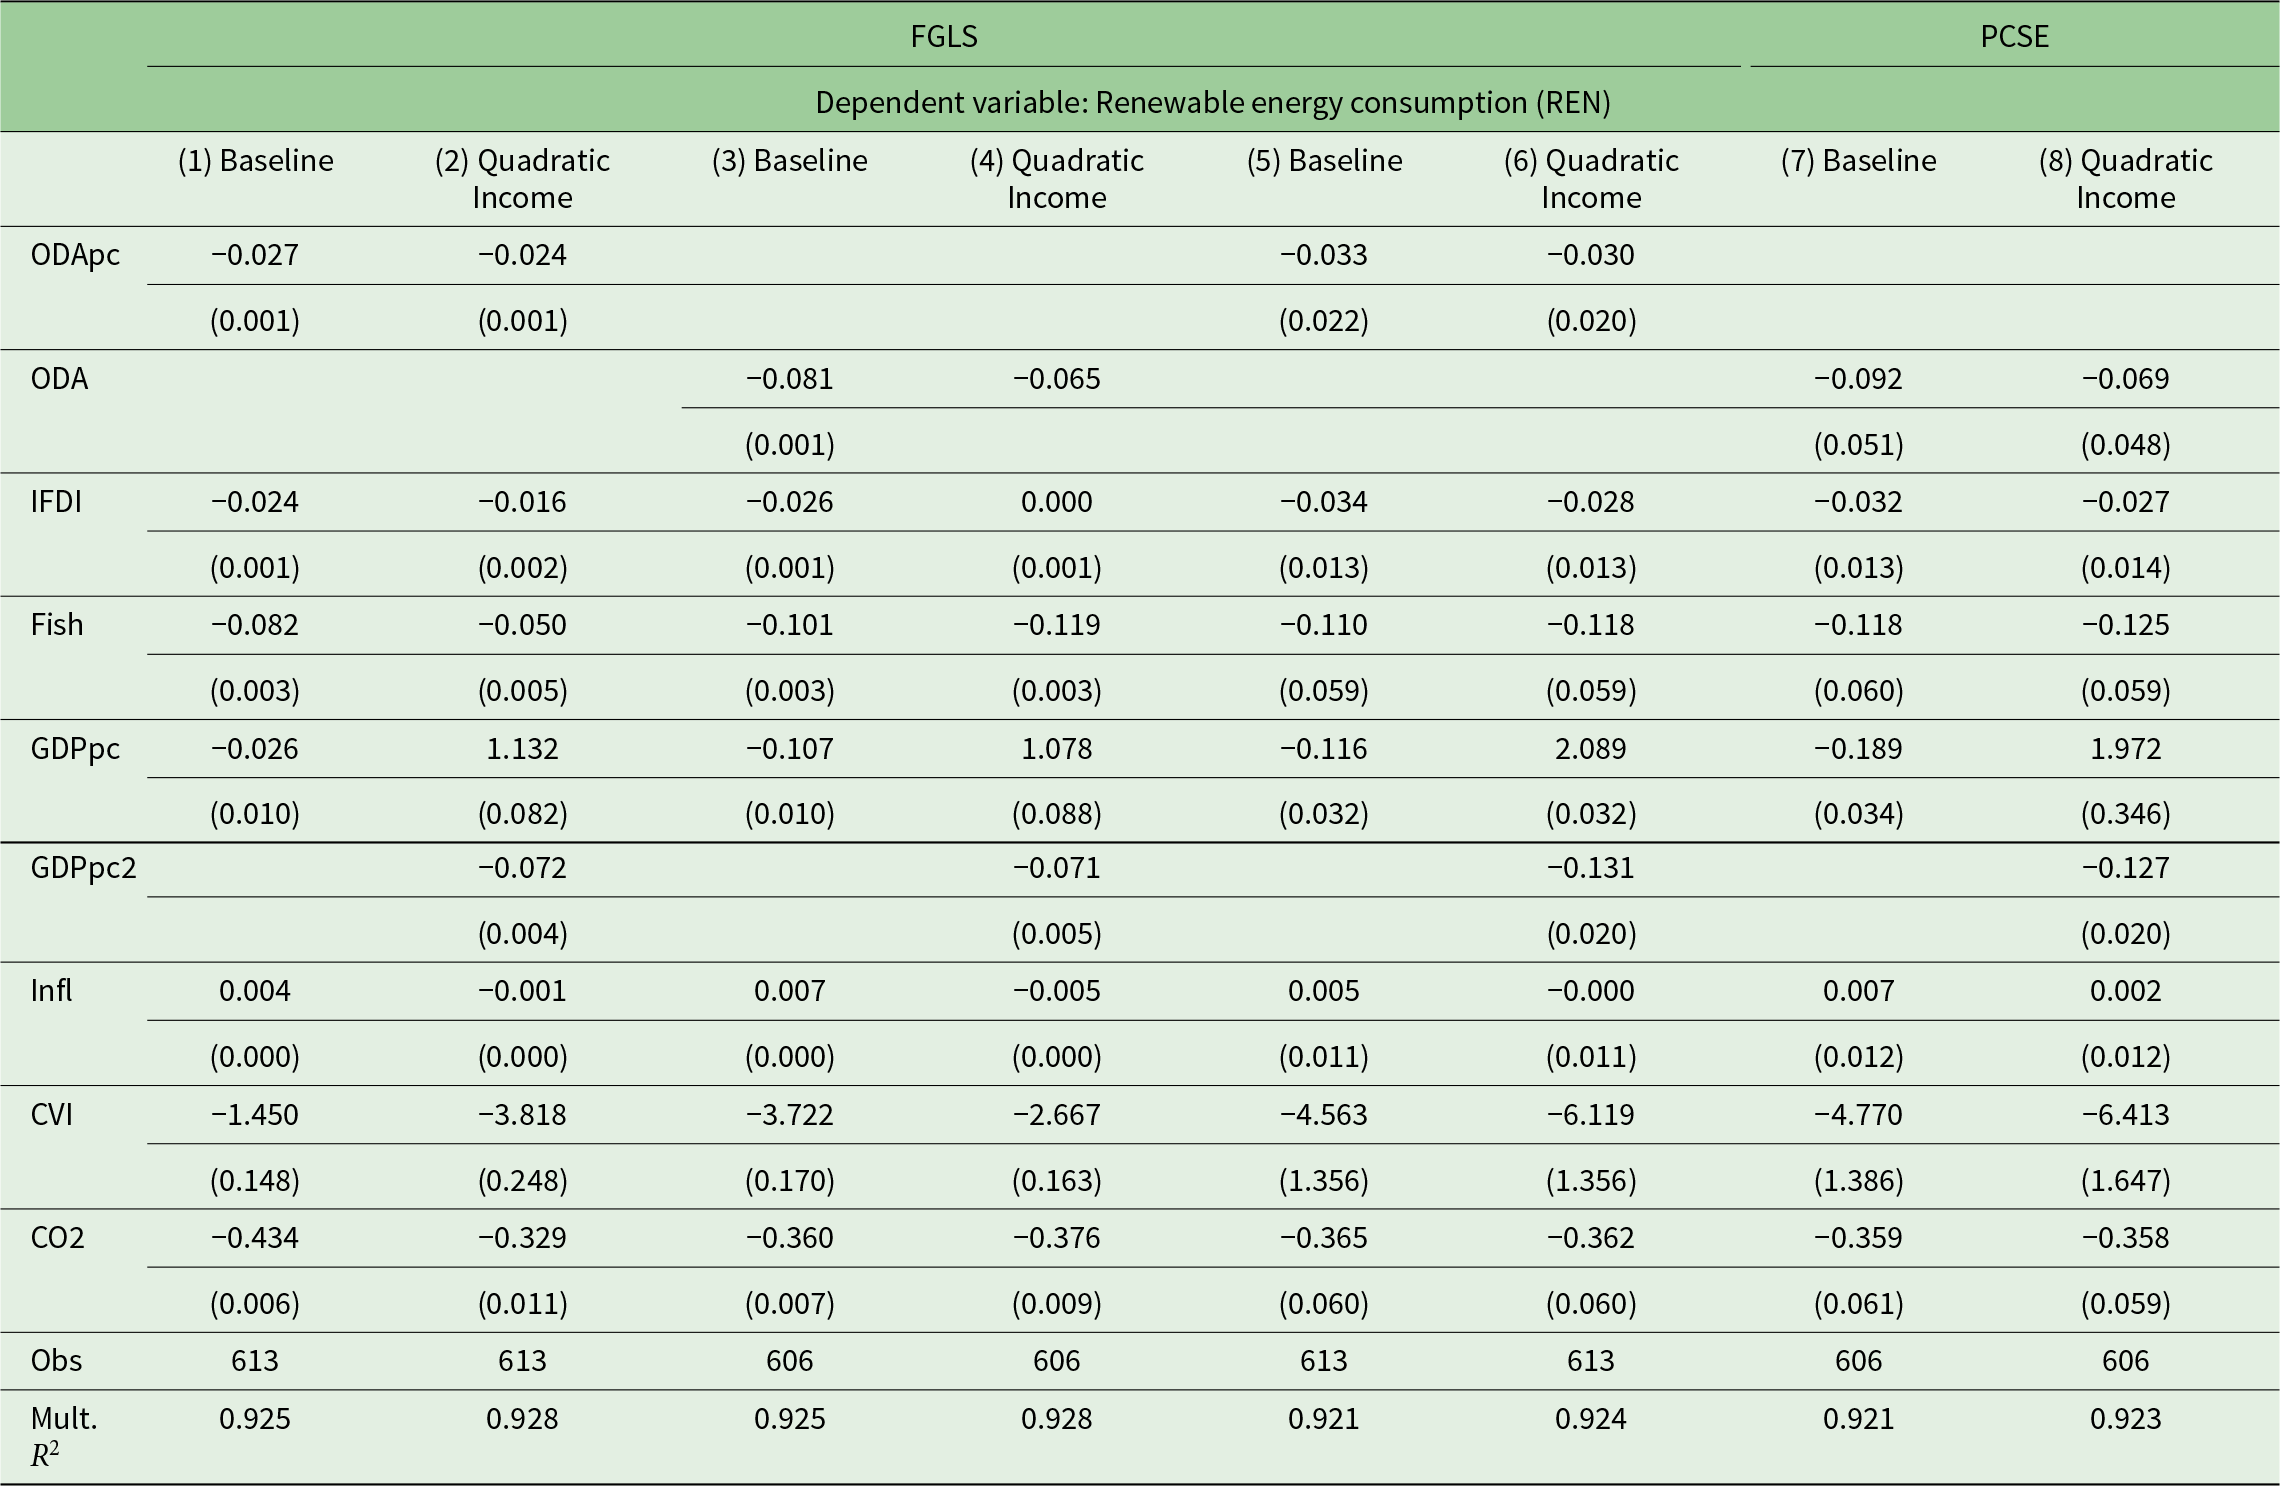
Renewable energy consumption estimation

Table 1 Long description
Regression results estimate how aid, investment, economic conditions, climate vulnerability, and carbon emissions relate to renewable energy consumption using two estimators (FGLS and PCSE) and baseline versus quadratic income specifications. Climate vulnerability has the largest negative coefficients in every model, ranging from about minus 1.45 to minus 6.41, and carbon emissions are also consistently negative at roughly minus 0.33 to minus 0.43. Fish dependence is negative in all specifications, around minus 0.05 to minus 0.13. Aid measures are negative where included: per-capita aid is about minus 0.024 to minus 0.033, and total aid is about minus 0.065 to minus 0.092. Foreign direct investment is generally negative, but one FGLS quadratic-income model shows a near-zero estimate. Inflation effects are small and mixed in sign. Income per capita is negative in baseline models but turns positive when the squared income term is added, while the squared income term itself is negative, indicating a nonlinear relationship. Sample sizes are about 606 to 613 observations, and model fit is high with adjusted R squared around 0.92 to 0.93; coefficient differences between estimators reflect different weighting and error assumptions, so robustness varies by variable.
Notes: Differences in coefficient signs and magnitudes between FGLS and PCSE estimates are expected given the distinct assumptions underlying each estimator. FGLS corrects for heteroscedasticity and serial correlation by reweighting observations through an estimated error covariance matrix, which can alter both the magnitude and direction of coefficients relative to OLS-based approaches. PCSE, by contrast, adjusts standard errors rather than the point estimates themselves, meaning that sign differences between the two estimators reflect genuine sensitivity of certain relationships to the weighting structure imposed on the data. In our sample, where N slightly exceeds T, FGLS is the preferred estimator and its results are therefore used as the basis for interpretation throughout the paper. Instances where PCSE produces insignificant or differently signed coefficients should be read as indicating lower robustness of those specific relationships rather than contradictions in the underlying empirical story.
Higher values indicate greater productivity, while lower values represent more inefficient consumption of renewable energy. It should be noted that this variable captures the share of renewables within total energy consumption but does not directly reflect the absolute trajectory of fossil fuel use, a distinction that is relevant for interpreting results through the lens of the Pollution Haven Hypothesis.
Regarding our variables of interest, they involve ODA and FDI inflows. Our interest lies in determining whether the nature of foreign monetary flows influences the process of ecological transition in relation to renewable energy. For the ODA variable, we have chosen two data points: net ODA received as a percentage of gross national income and ODA received per capita in current US$. As for our second variable of interest, IFDI (inward FDI) represents the sum of equity capital, reinvestment of earnings, other long-term capital and short-term capital as shown in the balance of payments, expressed as a percentage of GDP (Aiyar et al., Reference Aiyar, Malacrino and Presbitero2024; Villalvazo, Reference Villalvazo2024).
The graphical representation of these variables of interest is presented in Figure 2. Figure 2a shows the mean annual evolution of REN, ODA and IFDI across the sampled countries over 1995–2019, illustrating the broadly declining trend in REN alongside relatively stable foreign capital flows. Figure 2b displays country-level REN values for 2019, revealing substantial cross-country heterogeneity within the SIDS group, with Guinea-Bissau, Haiti and Comoros registering the highest renewable energy shares, reflecting their greater reliance on traditional biomass rather than modern renewable infrastructure.
We will employ a set of control variables to denote three main dimensions that are relevant in the literature. The first dimension is the economic axis, represented by the variables GDP per capita (GDPpc), Infl and Fish. The variable GDPpc reflects the income–capital relationship, as literature suggests a quadratic relationship in relation to the adoption of new technologies that can improve environmental standards (Yilanci et al., Reference Yilanci, Gorus and Andreoni2023). Inflation, represented by the variable Infl, refers to the annual percentage growth rate of GDP at market prices based on constant local currency. Higher inflation rates tend to hinder technological transfer or the adoption of new knowledge that could lead to less polluting dynamics in relation to fossil fuel consumption (Ma et al., Reference Ma, Wu, Stan and Gao2024).
The variable Fish represents the productivity of the fishing sector as a proxy for broader economic productivity in SIDS (Bhattacharya et al., Reference Bhattacharya, Inekwe and Sadorsky2020). Due to the lack of consistent cross-country measures of aggregate productive capacity for our full sample across the study period, we rely on this sectoral indicator as the closest available approximation. The fishing sector holds particular relevance for many SIDS, especially those in the Pacific and Indian Ocean, where it constitutes a significant share of GDP and export activity. We nonetheless acknowledge that this proxy is imperfect given the structural heterogeneity of our sample: for several countries, tourism, remittances or offshore financial services represent a more dominant source of economic activity than fisheries, which may introduce some bias in how this variable captures productive dynamics across different subgroups. With this caveat in mind, higher values of fishing productivity may indicate greater economic development and therefore have an impact on the overall energy mix based on the EKC hypothesis (Chen et al., Reference Chen, Ali, Ma, Arshad and Ahmad2023).
The second dimension focuses on institutional relationships. To represent this dimension, we employ the Human Development Index (HDI) as an indicator of institutional robustness, as other indicators are lacking in this regard (Jiang et al., Reference Jiang, Behrens, Lyu, Tang, Chen, Cao, Gong, Zhou, Yang, Tukker, Hertwich and Zhu2023; Lian et al., Reference Lian, Fu and Chen2023). The literature suggests that a stronger institutional context is likely to contribute to a greater local capacity to adapt processes, techniques and infrastructure to the needs arising from climate change (Boateng et al., Reference Boateng, Annor, Amponsah and Ayibor2024). Hence, we expect a positive relationship with HDI.
The last dimension is related to the environmental condition. Numerous studies and the political context affirm that increased environmental degradation spurs local governments to adopt policies and measures that mitigate the adverse effects of such degradation (Perone, Reference Perone2024). This situation is particularly pressing for SIDS, with some of them, such as the Marshall Islands or Tuvalu, facing the risk of disappearance due to climate change (European Commission, 2023). To address this issue, we include the variable CO2, primarily due to its significance in the literature (Wang et al., Reference Wang, Hossain, Si Mohammed, Cifuentes-faura and Cai2023). However, the inclusion of this variable only partially captures environmental degradation, as it only measures air pollution, which may not be particularly relevant for SIDS. To address this issue, we include the variable CVI, which represents the Climate Vulnerability Index (Ahmed et al., Reference Ahmed, Chowdhury, Zzaman, Ul Islam, Nahar and Roy2024). This index is constructed by considering six life-supporting sectors: food, water, health, ecosystem services, human habitat and infrastructure. Each sector is represented by six indicators that encompass three cross-cutting components: the sector’s exposure to climate-related or climate-exacerbated hazards, the sector’s sensitivity to the impacts of those hazards and the sector’s adaptive capacity to cope with or adapt to these impacts. Thus, higher values of CVI may lead to a greater adoption of renewable resources.
The descriptive statistics of our variables of interest are presented in Supplementary Appendix Table A1.
3.2. Methodology
The chosen method in this study builds upon the adaptation of classical models of economic development, which posit that changes in economic and institutional conditions can affect the internal relationships of interest (Barro, Reference Barro1996; Policardo and Sanchez Carrera, Reference Policardo and Sanchez Carrera2024). In this case, by adapting these models to our variable of interest – REN – we gather a set of explanatory and control variables that are likely to influence these processes and consumption patterns. Thus, we express our relationship based on the following model:
 \begin{equation}Re{n_{it}} = Flow{s_{it}} + EC{O_{it}} + {\text{ }}HD{I_{it}} + {\text{ }}EN{V_{it}} + \varepsilon ,\end{equation}
where  ${\text{Re}}{{\text{n}}_{it}}$ represents a vector of explanatory variables, such as REN and RenProd in country
 $i$ in year
 $t$; Flows is a vector comprising our variables of interest, ODA and IFDI;
 ${\text{ECO}}$ is another vector representing the set of economic variables, namely GDPpc, Infl and Fish;
 ${\text{HD}}{{\text{I}}_{it}}$ represents the HDI in country
 $i$ in year
 $t$, capturing institutional factors; and
 ${\text{EN}}{{\text{V}}_{it}}$ is another vector denoting the environmental relationship of country
 $i$ in year
 $t$ based on CVI and CO2.
For the estimation of our model, we consider the characteristics inherent to our data (Baltagi, Reference Baltagi2021). To this end, we analyse issues of multicollinearity using the Pearson correlation test and the variance inflation factor, cross-sectional dependency, the presence of unit roots, heteroscedasticity and serial correlation. Based on these considerations, we employ feasible generalized least squares (FGLS) and panel-corrected standard errors (PCSE) as estimation techniques. Additionally, to address potential endogeneity concerns and to gauge the robustness of our main estimates, we employ differences generalized method of moments (GMM).
FGLS and PCSE are robust estimators in the presence of heteroscedasticity and serial correlation, producing robust estimates through the estimation of a robust covariance matrix that accounts for both factors (Beck and Katz, Reference Beck and Katz1995; So Im et al., Reference So Im, Ahn, Schmidt and Wooldridge1999). However, the choice between the two depends on the specific panel data characteristics, where if N > T, FGLS performs better (Wooldridge, Reference Wooldridge2010). In our case, N is 37 and T is 24, thereby favouring the FGLS estimation, which we employ for alternative estimations of the initial model. This estimation approach has been widely used in numerous studies to date, ensuring precise and reliable estimates.
The results of these tests and the final estimations are gathered in the following section.
4. Empirical results
4.1. Collinearity and cross-sectional dependence
Supplementary Appendix Figure A1 presents the results for the analysis of multicollinearity using the Pearson correlation test. Among the variables used, the only variable with high correlation values is the relationship between HDI and GDPpc. This correlation may be due to the fact that HDI is also constructed based on income data, which can cause the correlation. Therefore, as these values are close to 100 per cent, we exclude the HDI variable and we retain GDPpc as the primary reflection of socio-economic development. It should be noted that we have included the GDP variable in the correlation because it is used to construct RenProd, not because it will be introduced in the final analysis as an explanatory variable. Although HDI is excluded from the main specification due to its high correlation with GDPpc, we recognize that institutional quality constitutes a theoretically important channel through which ODA and FDI are absorbed and translated into energy outcomes. World Bank Governance Indicators represent the most comprehensive available measure of governance quality for our sample, but their coverage across SIDS for the full study period is inconsistent, and their inclusion as an interaction term would materially reduce sample size and degrees of freedom.
There are other high correlation values in the sample, such as between CO2 and ODA. However, ODA and ODA per capita (ODApc) are introduced alternatively across specifications to avoid collinearity issues.
Finally, Supplementary Appendix Table A2 presents the results for the analysis of cross-sectional dependence based on various tests: Pesaran’s CD statistic (Pesaran, Reference Pesaran2004), Breusch and Pagan’s original Lagrange Multiplier (LM) statistic (Breusch and Pagan, Reference Breusch and Pagan1980), the scaled version of Breusch and Pagan’s LM statistic (Baltagi et al., Reference Baltagi, Feng and Kao2012) and the bias-corrected scaled version of Breusch and Pagan’s LM statistic (Pesaran, Reference Pesaran2015).
The results of all these tests confirm the presence of cross-sectional dependence in our data, requiring that our final estimation to be consistent with it.
4.2. Unit root test
In Supplementary Appendix Table A3, we present the unit root tests. Currently, in the literature, traditional tests such as the Dickey–Fuller test and related ones have lost influence in favour of second-generation unit root tests (Costantini et al., Reference Costantini, Delgado and Presno2023; Sun et al., Reference Sun, Usman, Radulescu, Korkut Pata and Balsalobre-Lorente2023). In this case, we employ these second-generation tests, namely the cross-sectionally augmented Im, Pesaran and Shin test for unit roots in panel models (Im et al., Reference Im, Pesaran and Shin2003) and the Hansen’s Covariate-Augmented Dickey–Fuller test for unit roots (Hansen, Reference Hansen1995). These tests have been computed for each variable, both in levels and first differences, considering the intercept (I) and intercept with trend (I&T) specifications.
The results of the tests for each variable indicate that our variables are, at most, I(1), implying that there are no issues that would hinder us from estimating robust relationships.
4.3. Panel estimation
The results of our estimation are presented in Table 1, which includes the results of both the FGLS and PCSE models, with both estimations including ODA and ODApc to address multicollinearity issues and alternating between GDP and its squared term based on the literature. The goodness of fit for all models is relatively high, indicating that the model is considered suitable for our estimation. It should be noted that among the models with ODA and ODApc, the model with the squared term shows slightly higher goodness of fit. Additionally, in the FGLS model, the ODApc variable exhibits better significance, so we will use this variable in subsequent estimations. Finally, it should be mentioned that in Supplementary Appendix Tables A4 and A5, we provide the estimation for the differences GMM to determine if there are any sign-related issues in our estimation derived from endogeneity problems (Zhao et al., Reference Zhao, Dong, Dong and Shahbaz2022). We can observe that all variables show the same signs and relatively similar levels of significance.
Regarding our variables of interest, both ODA variables are significant and have the same effect, with the per capita variable having a smaller value due to the computation of the same data regarding the global variable. In this sense, we can affirm that ODA flows are not oriented towards the promotion of REN. This relationship may be due to various reasons, with the most reasonable being related to the nature of ODA compared to FDI. ODA is not assumed to transfer knowledge and technologies that harness the host countries’ own resources. Therefore, ODA is only susceptible to deepening the countries’ own dynamics, in other words, strengthening the socio-economic dynamics, including energy relationships, without guaranteeing or promoting an adaptation or improvement of the dynamics that can be enhanced, such as REN (Wang et al., Reference Wang, Guo and Dong2021; Chapel, Reference Chapel2022). The estimation of this relationship averages 0.028 per cent for every 1 per cent increase in per capita ODA, and 0.076 per cent for every 1 per cent increase in ODA.
On the other hand, FDI has the same effects as ODA. Thus, we understand that FDI directed to SIDS does not contribute to the readjustment of energy infrastructure to meet the needs derived from the international commitment against climate change. The average relationship is 0.026 per cent for every 1 per cent increase in IFDI, similar to the per capita values of ODA. It is worth noting that while FDI is assumed to have the capacity to transfer technologies and knowledge, these relationships are understood for countries with a standardized tax system, whereas the nature of tax systems in SIDS is based on tax exemption (Hoa et al., Reference Hoa, Xuan, Thu and Huong2024). Thus, the nature of FDI may not be productive, while it is justified in improving the returns of economic activities derived from favourable tax frameworks.
Regarding productivity based on the Fish variable, we can see that higher values of Fish negatively influence REN, with an average of 0.1 per cent for every 1 per cent increase in productivity. This implies a certain dependency of local productivity on fossil fuel-dependent technologies and techniques, as an increase in production is achieved through the consumption of non-renewable energy, indicating an insufficiency in supplying local markets with clean energy. On the other hand, the GDPpc variable, as an indicator of income, shows that increases in income have a significant negative impact on REN. In some cases, as developing countries experience an increase in per capita income, they may have a higher demand for energy consumption in general, including non-renewable sources. This may be due to increased industrialization and urbanization, which lead to higher energy consumption in sectors such as manufacturing and transportation. However, in the context of SIDS, it is possible that the development of specific infrastructure and policies to promote renewable energy has not kept pace with economic growth (Ding and Liu, Reference Ding and Liu2023). As a result, REN may not align with the increase in per capita income, resulting in a negative relationship between the two (Fedajev et al., Reference Fedajev, Mitić, Kojić and Radulescu2023). This situation indicates the need for policies and actions aimed at promoting the adoption and consumption of renewable energy in SIDS to achieve greater energy sustainability. Lastly, inflation does not generally show significant values, but it is estimated that this relationship encourages REN. This relationship may be due to the fact that an increase in inflation may lead to the search for more affordable and renewable energy sources compared to fossil fuels, in order to ensure access to cheaper energy (Akan, Reference Akan2023; Lu et al., Reference Lu, Farhani, Soliman, Zhou and Su2023).
The turning point of the quadratic GDPpc relationship can be calculated as  ${x^*} = - {\hat \beta _1}/2{\hat \beta _2}$, which given our log-transformed variables yields an income threshold of approximately US$2,587 per capita (average across FGLS specifications, ranging from US$1,981 to 2,594 depending on the ODA measure used). This threshold is relatively low within the SIDS income distribution, implying that the majority of countries in our sample already operate beyond the turning point, meaning that for most SIDS further income growth is associated with declining rather than rising REN. This finding underscores the urgency of complementary energy policies that decouple economic growth from fossil fuel dependence in these countries.
One of the most counterintuitive findings of our analysis is the negative relationship between climate vulnerability, CO2 emissions and REN. Rather than spurring a green transition, higher environmental stress appears to be associated with lower renewable energy shares, a result that warrants careful interpretation through three complementary mechanisms.
The first mechanism relates to the adaptation–mitigation trade-off. SIDS facing acute climate vulnerability are frequently compelled to direct their limited financial and institutional resources towards immediate adaptation measures, such as coastal protection infrastructure, flood management and disaster resilience, rather than towards longer-term mitigation strategies centred on renewable energy deployment. In contexts where survival needs are urgent, the opportunity cost of investing in renewable infrastructure is high, and governments may rationally prioritize adaptation over mitigation even when international commitments nominally favour the latter (European Commission, 2023; Ahmed et al., Reference Ahmed, Chowdhury, Zzaman, Ul Islam, Nahar and Roy2024).
The second mechanism concerns fossil fuel lock-in. High climate vulnerability in SIDS often coincides with entrenched energy infrastructure built around diesel generation and imported fossil fuels, reflecting decades of investment in systems that are difficult and costly to replace. This creates a vulnerability trap in which the same structural conditions that make a country most exposed to climate change also make it least capable of transitioning away from the energy systems that contribute to it. Limited access to concessional financing for renewable infrastructure, combined with the high upfront capital costs of energy transition, reinforces this dependency and suppresses the renewable energy share even as vulnerability increases.
The third mechanism involves rebound effects from capital inflows. As shown in our results, both ODA and FDI tend to stimulate economic activity in SIDS without a corresponding shift towards renewable energy. The resulting increase in overall energy demand is therefore met primarily by fossil fuels, given that renewable capacity is insufficiently scaled to absorb it. This dynamic means that economic growth driven by foreign capital may paradoxically deepen fossil fuel dependence in the short to medium term, compounding the negative relationship between development-oriented capital flows and REN. Together, these three mechanisms suggest that the negative effect of CVI and CO2 is not a statistical artefact but reflects structural features of SIDS energy systems that policy must explicitly address.
4.4. Identification strategy and endogeneity
A central concern in estimating the effect of FDI and ODA on REN is the potential for reverse causality. External capital flows may themselves be attracted or deterred by a host country's existing energy mix or its observable commitment to green transition, meaning that the causal direction between capital inflows and renewable energy outcomes cannot be assumed a priori. To address this, we complement our main FGLS estimates with a two-step Difference-GMM estimator (Arellano and Bond, Reference Arellano and Bond1991), treating ODA/ODApc and IFDI as endogenous regressors whose contemporaneous values may be correlated with unobserved country-level energy dynamics.
The instrument structure is as follows. ODA/ODApc and IFDI are instrumented using their second and third lags in levels; lag 1 is deliberately excluded as persistent shocks may sustain its correlation with the differenced error term. Fish and GDPpc are treated as predetermined variables and instrumented with lags 1 and 2. Infl, CO2 and CVI are assumed strictly exogenous and enter directly as instruments. To prevent instrument proliferation, which can inflate the Hansen test p-value towards unity and render the over-identification test uninformative (Roodman, Reference Roodman2009), the instrument matrix is collapsed throughout.
The validity of this instrument set is confirmed by two specification tests. The Hansen J-test fails to reject the null hypothesis of joint instrument validity in both the ODApc specification (p = 0.638) and the ODA specification (p = 0.601), comfortably above the conventional 0.10 threshold. The Arellano–Bond AR(2) test fails to reject the null of no second-order serial correlation in the differenced residuals (p = 0.289 and p = 0.762, respectively), satisfying the key identifying assumption underlying the Arellano–Bond estimator. While GMM coefficients are statistically insignificant, a common outcome in Difference-GMM applied to small-N panels where first-differencing removes substantial between-country variation, the sign consistency with Table 1 confirms that the FGLS findings are not attributable to reverse causality. Full results are reported in Supplementary Appendix Table A5.
To further assess the robustness of our findings to potential outlier influence, we replicate the main FGLS specifications on a restricted sample excluding Singapore and Bahrain (Supplementary Appendix Table A6). Singapore’s structural profile as a high-income city-state with uniquely financialized FDI dynamics is qualitatively distinct from the broader SIDS sample, and Bahrain raises similar concerns. As shown in Supplementary Appendix Table A6, the sign, magnitude and statistical significance of the key coefficients are preserved in the restricted sample: the negative effects of ODA, ODApc and IFDI on REN remain robust, the EKC pattern is confirmed, and R 2 stays above 0.92 across all specifications. The main findings are therefore not attributable to the disproportionate influence of these two economies.
We further address the measurement validity of the dependent variable by conducting a supplementary analysis that replaces REN with the share of renewable electricity output in total electricity output (World Bank indicator EG.ELC.RNEW.ZS). Unlike REN, this indicator excludes traditional biomass and captures only electricity-based modern renewables including hydro, wind, solar and geothermal, directly addressing the concern that high REN values in countries such as Guinea–Bissau and Haiti reflect energy poverty rather than deliberate green transition. The results, reported in Supplementary Appendix Table A7, are broadly consistent with the main findings. ODA and IFDI retain negative and statistically significant coefficients across the quadratic income specifications, confirming that capital inflows do not promote modern renewable electricity deployment even when biomass is excluded from the dependent variable. The EKC pattern is likewise preserved, with GDPpc turning negative and its squared term positive, consistent with Table 1. One partial divergence warrants acknowledgement: in the baseline specification without the quadratic income term, ODApc carries a positive coefficient on the renewable electricity share. This result is sensitive to model specification: while it is attenuated in the quadratic income model, it does not survive across the ODA specifications, suggesting it reflects a composition effect in the restricted electricity measure rather than a robust contradiction of the main findings.
A further robustness concern relates to our imputation procedure, which carries forward and backward known values for missing observations (Little, Reference Little1988). Robustness reports the share of observations flagged as likely imputed per variable. Only Fish exhibits detectable imputation, with 20 observations flagged (2.1 per cent of the total sample); all remaining variables, including ODA, ODApc, IFDI and Infl, show no evidence of carry-forward or carry-backward imputation. To assess whether these 20 observations drive our conclusions, we replicate the main FGLS specifications on a subsample restricted to non-imputed country-years (942 out of 962 observations, all 37 countries retained). Supplementary Appendix Tables A8 and A9 show that the sign and statistical significance of all key coefficients are preserved in the restricted sample, with the exception of IFDI in specification (1), whose magnitude is attenuated but remains statistically significant at 1 per cent. In the RenProd specifications, the ODA × Fish interaction coefficient is likewise attenuated but retains its sign and significance, confirming that the complementarity result is not an artefact of imputed observations.
To examine whether the negative ODA–REN relationship is stable across the sample period, we replicate the main FGLS specifications on pre-2015 and post-2015 subsamples separately. The results, reported in Supplementary Appendix Table A10, reveal a meaningful attenuation of the ODA and ODApc coefficients in the post-Paris period, with both losing statistical significance after 2015. While the short post-2015 window (T = 4 years, 2016–2019) limits statistical power, the directional evidence is consistent with a gradual reorientation of aid flows towards climate and energy goals following the Paris Agreement and SDG7 adoption, suggesting that the institutional misalignment narrative may be attenuating over time. Checks contained in the Supplementary Appendix confirm that the main results are robust to outlier influence, measurement error from imputation, choice of renewable energy indicator, and the pre-Paris sample period.
4.5. Subgroup heterogeneity
To examine whether the negative effects of ODA and IFDI on REN are uniform across the SIDS sample, we replicate the baseline FGLS specifications on regional and income-based subsamples, with results reported in Supplementary Appendix Tables A11 and A12, respectively. The regional split in Supplementary Appendix Table A11 reveals that the negative ODA effect is robust in the Caribbean and Other subgroups but reverses sign in the Pacific subsample, where ODApc carries a positive and statistically significant coefficient, consistent with the structural profile of Pacific microstates where aid flows tend to substitute for rather than complement domestic investment. IFDI, by contrast, remains negative and statistically significant across all three regional subgroups, confirming that the enclave dynamics driving the negative FDI–REN relationship operate uniformly regardless of geographic context.
The income-group split in Supplementary Appendix Table A12 further shows that the negative ODA effect is concentrated among high- and upper-middle-income SIDS, while the coefficient is statistically indistinguishable from zero in the lower-middle- and low-income subsample, consistent with the hypothesis that more institutionally developed SIDS tend to attract growth-oriented aid that is not conditioned on energy transition. Regarding the source composition of ODA flows, disaggregating ODA flows by donor type or bilateral source would constitute a valuable extension of this analysis; however, donor-level data of sufficient coverage for our full SIDS sample and period are not currently available, and we treat this as a direction for future research.
Table 2 presents an alternative estimation for RenProd, calculated as GDP over REN. As noted in Section 3 and further discussed in Section 5, the construction of this variable implies a partial mechanical link with the REN results. The model used is the same as in the previous model, employing the ODA variable to simplify the international assistance variable and including two cross-products for experimentation purposes between private capital flows and assistance variables.
Renewable energy productivity estimation

Table 2 Long description
The table reports feasible generalized least squares regression results for renewable energy productivity using four model specifications: baseline, quadratic income, and versions adding interactions with fish. Climate vulnerability index has the largest positive coefficient in every model, ranging from 3.373 to 4.809, with relatively large standard errors compared with other variables. Carbon emissions are also strongly positive and stable across models, about 0.556 to 0.652. Inflation is very small in magnitude across all models, near zero and slightly negative except in the interaction model where it is essentially zero. Official development assistance is positive in all models and rises sharply in the model that includes the aid by fish interaction, reaching 0.356, while the interaction term itself is negative at minus 0.031. Foreign direct investment is small and positive in most models but turns negative at minus 0.066 when paired with the investment by fish interaction, and that interaction term is positive at 0.008. Fish is consistently positive across models, increasing to 0.187 in the aid interaction model. Income per capita is positive in the baseline model but becomes negative once the squared income term is included, while the squared income term is positive in those models, suggesting a non linear income relationship. All models use 606 observations and have similar fit, with multiple R squared around 0.921 to 0.923.
Our estimation results affirm that an increase in ODA and FDI contributes to higher RenProd. This means that both capital flows, one being private and the other with a significant institutional component, are strongly oriented towards economic development in terms of GDP. As a result, they have a positive impact on generating economic growth rather than transitioning to renewable energy. It should be explicitly acknowledged, however, that this finding is not fully independent of the REN results in Table 1. Since RenProd = GDP/REN, and both ODA and FDI reduce REN, a positive coefficient on these flows in the RenProd equation is partly a mechanical consequence of their negative effect on the denominator. We therefore present the RenProd analysis not as a separate empirical finding but as a coherent extension of the REN results. This framing is consistent with the broader narrative of the paper, and we caution against interpreting the positive RenProd coefficients in isolation from the negative REN coefficients that are their algebraic complement.
When contextualizing these results with those from Table 1, we can conclude that productivity in terms of GDP is the primary objective of monetary flows, overshadowing the transition process to green economies in the form of increased REN. This relationship is further emphasized by the Fish variable, where increases in fishing productivity are associated with improved RenProd.
Regarding the income variables, particularly the inverse quadratic relationship observed in the previous relationship, it implies that an increase in GDPpc does not contribute to RenProd. Taking into account the quadratic relationship, we can state that increases in GDPpc up to a certain point enhance RenProd. However, beyond that point, productivity decreases. This relationship may be due to the fact that as GDPpc increases, there is likely to be higher economic growth and greater energy demand overall, including renewable energy. However, if economic growth exceeds the proportional increase in REN, the efficiency and RenProd may be compromised. This is because the increase in energy demand can lead to higher consumption of renewable energy, but if the capacity for renewable energy generation does not expand in the same proportion, a gap between supply and demand may occur. This gap can result in lower efficiency in the production and utilization of renewable energy, leading to a decrease in productivity measured in terms of GDP generated per unit of REN. Similarly, the Infl variable shows non-significant results but points towards a negative relationship between inflation and RenProd.
Regarding the environmental variables, we can estimate that an increase in environmental degradation or climate vulnerability leads to higher RenProd. This may be due to the fact that increased environmental degradation is associated with greater economic activity, as mentioned earlier. Therefore, in socio-economic contexts where there has been no transition to renewable technologies and infrastructure, economic growth associated with GDP may rely on the consumption of fossil fuel resources, causing the numerator of our ratio (GDP) to increase more than the denominator (REN). It is worth mentioning that all the variables used in this estimation point towards an increase in RenProd resulting from reduced consumption of renewable energy, where productivity is susceptible to dependence on the consumption of energy derived from fossil fuel resources.
To further understand this relationship, we analyse the cross-products of our variables of interest, ODA and IFDI, with the proxy for local productivity. Additionally, these cross-products allow us to study their cross-product interactions based on the following equation:
 \begin{equation}\frac{{\partial RenProd}}{{\partial IFDI}} = {\beta _0} + {\beta _r}Fish;{\text{ }}\widehat {FDI} + \left[ {\left( {\widehat {FDI*Fish}} \right)*\left( {\overline {Fish} } \right)} \right].\end{equation}
The cross-product interaction between ODA and Fish is −0.031, while the interaction between FDI and Fish is +0.008. This implies significant relationships in terms of the nature of investment, where FDI is more likely to influence the relationship between RenProd and GDP, thus having a greater impact on local productivity. On the other hand, its counterpart, ODA, may not have such a significant effect on local economic dynamics, thus potentially being focused on less productive sectors or revitalizing companies in unfavourable economic situations or similar circumstances.
The divergence between our consumption and productivity results warrants a deeper mechanism-based interpretation. RenProd can increase through two fundamentally different pathways. The first is genuine efficiency improvement, where the same unit of renewable energy generates more economic output due to technological upgrading or structural economic change. The second is relative decoupling, where GDP grows faster than REN, not because the energy system is becoming cleaner but because capital inflows stimulate economic output while renewable infrastructure remains stagnant. Our results are more consistent with the second pathway. Both ODA and FDI are shown to negatively affect REN while simultaneously contributing to economic growth, meaning the numerator of the productivity ratio rises while the denominator stagnates or declines in relative terms. This dynamic produces the appearance of productivity improvement without any underlying transition in the energy mix, a pattern that might be characterized as statistical greenwashing in the sense that aggregate indicators suggest progress while the structural dependence on fossil fuels remains intact or deepens in absolute terms.
This interpretation has implications for how RenProd is used as a policy metric. A rising RenProd value in SIDS should not be read as evidence of a successful green transition but rather as a signal that economic growth is outpacing renewable energy scaling, indicating a widening gap between GDP trajectories and energy system transformation. True decarbonization would require not only rising productivity but also an absolute increase in REN, a condition our results suggest is not being met under current ODA and FDI configurations.
4.6. Quantile estimation
In order to explore heterogeneity among the effects of our variables in renewable energy, Table 3 gathers the quantile estimation based on a Monte Carlo Markov Chain (MCMC) optimization approach. The MCMC method is utilized to estimate the parameters of the quantile regression model by generating a sequence of random samples. In this case, the MCMC algorithm is set to optimize the estimation process, with 1,000 noisy draws being generated. A burn-in period of 100 iterations is specified to allow the algorithm to stabilize before collecting samples. Additionally, an acceptance rate of 50 per cent is set, indicating the proportion of proposed iterations that will be accepted in the MCMC sampling process.
MCMC quantile estimation on REN

Table 3 Long description
The table reports MCMC-based coefficient estimates with standard errors in parentheses for renewable energy across the 25th, 50th, and 75th quantiles, shown for two model specifications (columns 1 to 3 and 4 to 6). GDP per capita is negative in every quantile and both specifications, ranging from about minus 1.33 to minus 0.54 in the first set and minus 1.46 to minus 0.54 in the second. CVI is the largest negative factor, very strong at the 25th quantile (about minus 12.72 and minus 13.60) and much closer to zero by the 75th quantile (about minus 0.38 and minus 0.05). Fish is positive throughout, roughly 0.15 to 0.18 in both sets, indicating a stable positive association across the distribution. IFDI and CO2 are consistently negative across quantiles in both specifications, with IFDI around minus 0.19 to minus 0.08 and CO2 around minus 0.18 to minus 0.07. Inflation is small and changes sign, near zero at the 25th quantile in the first set and positive in most other columns. ODA per capita appears only in the first specification and shifts from positive at the 25th quantile to slightly negative at the 75th, while ODA appears only in the second specification and is negative across quantiles. Sample size is 613 observations in the first specification and 606 in the second; coefficients should be interpreted as conditional quantile associations rather than average effects.
Observing the impact of ODApc, a notable pattern emerges where it displays a positive and statistically significant association at the 25th and 50th quantiles, only to exhibit a significant negative relationship at the 75th quantile. In contrast, IFDI consistently showcases a negative and statistically significant influence across all quantiles, with a relatively stronger effect observed at the 25th percentile. Fish production appears to have a positive and significant impact on the dependent variable throughout all quantiles, indicating its consistent contribution. On the other hand, GDPpc demonstrates a consistent negative effect across all quantiles, implying a downward pressure on the REN variable with increasing GDPpc. The variable Infl introduces a nuanced effect, showing a positive association at the 50th quantile but a negative trend at the other quantiles, suggesting a varied impact based on the quantile level. Moreover, the CVI consistently exhibits a negative and statistically significant effect at all quantiles, implying that higher climate vulnerability is associated with reduced REN across the distribution, consistent with the adaptation–mitigation trade-off and fossil fuel lock-in mechanisms discussed earlier. Lastly, CO2 emissions display a negative influence on the dependent variable across all quantiles, indicating the detrimental impact of environmental pollution on the outcome of interest.
The positive Fish coefficients across quantiles stand in contrast to the negative main FGLS result in Table 1, suggesting that the negative aggregate relationship is driven by high REN observations where fossil fuel dependency is most entrenched, while at lower quantiles productivity gains retain a positive association with renewable energy.
5. Discussion
In the preceding sections, we documented the effects of ODA and FDI on REN and productivity in SIDS. The results reveal a consistent negative relationship between both capital flows and REN, alongside a positive relationship with RenProd. These findings diverge systematically from the mainstream literature on foreign capital and renewable energy, which predominantly documents neutral or positive effects consistent with the Pollution Halo Hypothesis and technology spillover mechanisms (Destek et al., Reference Destek, Yıldırım and Manga2024; Khan et al., Reference Khan, Yuan, Yahong and Ahmad2024). We argue that this divergence is not a statistical anomaly but reflects three structural features of SIDS that are largely absent from the larger developing country samples that dominate the existing literature: structural absorption constraints rooted in the absence of a diversified industrial base; a sovereign energy dependency trap driven by geographic isolation and import-dependent energy systems; and a dual misalignment of external financing that simultaneously responds to humanitarian needs and donor political agendas without adequately funding renewable energy transitions. Such features constitute what we term the SIDS energy transition trilemma, characterized by high vulnerability, low absorption capacity and misaligned external financing. This configuration systematically produces the negative relationships we document and that explains why SIDS represent a theoretically distinct case requiring analytical frameworks beyond those developed for larger developing economies. In the following subsections, we discuss each of our main findings in light of this theoretical framework.
5.1. The paradox of foreign capital flows and renewable energy
Consistent with the trilemma introduced above, the first set of findings concerns the negative relationship between both ODA and FDI and REN, a result that runs counter to the standard expectation that capital inflows promote green transitions in recipient countries.
Regarding ODA, this negative effect reflects a fundamental institutional misalignment rooted in the structural nature of development assistance. ODA flows to SIDS originate from the inability of these countries to foster their economies and meet social demands through domestic resources or trade integration (OECD, 2023). As a consequence, ODA is primarily channelled towards conventional infrastructure, basic services and economic stabilization rather than towards energy transition investments (Yoo and Woo, Reference Yoo and Woo2023; Chen and Yang, Reference Chen and Yang2024). This lack of targeted financing for renewable energy projects restricts the adoption and consumption of renewable sources in SIDS, leaving them dependent on fossil fuel-based systems that ODA itself helps to consolidate (Wang et al., Reference Wang, Guo and Li2022a).
Building on this misalignment, what distinguishes SIDS from larger developing countries is the severity of the absorption constraint that prevents even generically oriented ODA from generating green spillovers. In larger economies with diversified industrial bases and stronger regulatory frameworks, development assistance can indirectly stimulate institutional capacity and technology transfer towards cleaner energy. In SIDS, the absence of these structural preconditions means that foreign assistance flows into the path of least institutional resistance, reinforcing existing energy dynamics rather than redirecting them. This mechanism explains why our results contradict studies conducted in larger developing country panels that find ODA supportive of renewable energy adoption. The difference is not in the intent of ODA but in the structural capacity of SIDS to translate it into green outcomes. Our RenProd results reinforce this interpretation: the positive effect of ODA on RenProd confirms that ODA primarily stimulates economic output rather than energy transformation, reflecting a system of priorities within both local and global institutional agendas that continues to favour traditional economic development over green economic growth (Polewsky et al., Reference Polewsky, Hankammer, Kleer and Antons2024). It should be noted, however, that this result is partly a mechanical consequence of ODA’s negative effect on REN: since RenProd is defined as GDP divided by REN, a reduction in REN mechanically inflates the ratio. The RenProd finding is therefore best read as quantifying the magnitude of this GDP-orientation rather than providing orthogonal confirmation of it. With this caveat in mind, this disparity is particularly significant given the prevailing assumption in the green growth literature that development processes are converging towards renewable-intensive growth trajectories (Amir et al., Reference Amir, Malik and Ali2023), an assumption our results suggest does not hold for SIDS under current ODA configurations.
The negative FDI–renewables relationship follows a related but theoretically distinct logic that stems from the same structural rigidities. In the standard spillover framework, FDI transfers cleaner technologies and management practices from source to host countries, improving environmental quality in the process. Our findings are more consistent with the Pollution Haven Hypothesis, wherein FDI relocates productive activities towards jurisdictions with lower environmental standards or weaker regulatory enforcement (Balsalobre-Lorente et al., Reference Balsalobre-Lorente, Gokmenoglu, Taspinar and Cantos-Cantos2019; Murshed, Reference Murshed2023). What is theoretically novel in our results is that this outcome in SIDS is not primarily driven by deliberate regulatory arbitrage as the Pollution Haven Hypothesis typically implies but by the structural condition of the SIDS energy system itself. The tax exemption regimes that characterize most SIDS attract FDI oriented towards financial returns rather than productive investment (Hoa et al., Reference Hoa, Xuan, Thu and Huong2024). In this context, incoming FDI generates additional energy demand that the renewable sector cannot yet supply at scale, meaning that whether due to the scarcity of available renewable energy or the economic incentives to exploit favourable tax frameworks, FDI deepens fossil fuel dependence as a structural consequence of host country energy system rigidity rather than as a deliberate choice by the investing firm (Liu et al., Reference Liu, Zhang, Liu and Li2022; Vujanović et al., Reference Vujanović, Radošević, Stojčić, Hisarciklilar and Hashi2022). This constitutes a structurally permanent version of the pollution haven effect, one that persists across sectors and investment types because the energy infrastructure needed to deliver a clean alternative is simply not available at scale.
5.2. Income, local productivity and the limits of the EKC in SIDS
The structural rigidity identified in the previous section as the mechanism behind the negative capital flow–renewables relationship also manifests in the relationship between local productivity and REN. The negative effect of fishing sector productivity on REN reflects the same pattern of fossil fuel dependency embedded in the productive structures of SIDS. When productivity increases, it implies greater economic development and rising energy demand, which in economies lacking renewable infrastructure is more easily and reliably met through conventional energy sources (Aydin and Erdem, Reference Aydin and Erdem2024; Li et al., Reference Li, Liu and Yang2024). Moreover, SIDS tend to have established energy systems built around diesel generation and imported fossil fuels, creating infrastructure lock-in and associated economic interests that resist transition towards renewables even when the long-term benefits are well understood (Arias et al., Reference Arias, López, Camino-Mogro, Weiss, Walsh, Gomes and Hallack2023; Danish and Baloch, Reference Danish and Baloch2023; Chu, Reference Chu2024). This resistance is compounded by the economic and technological barriers to renewable adoption that are particularly acute in geographically isolated small island contexts.
Extending this argument from sectoral productivity to aggregate income, our quadratic GDPpc results reveal a non-linear pattern that superficially resembles the EKC but differs from it in a theoretically important way. The standard EKC predicts that beyond a high-income turning point, environmental quality improves as economies transition towards cleaner services-led growth and develop sufficient institutional capacity to enforce environmental standards (Hassan et al., Reference Hassan, Haseeb, Bekun, Haieri Yazdi, Ullah and Hossain2024). In our sample, however, the turning point occurs at approximately US$2,587 per capita, a threshold an order of magnitude lower than the income levels at which EKC turning points are typically identified in the broader literature (Dam and Sarkodie, Reference Dam and Sarkodie2023). This implies that the downward segment of our income–renewables relationship does not reflect achieved decarbonization or structural economic transformation but rather the earlier onset of fossil fuel lock-in driven by rising energy demand that renewable infrastructure cannot absorb. Below the turning point, rising income enables some investment in renewable-using technologies. Beyond it, the acceleration of overall energy demand driven by further income growth outpaces renewable capacity, and the excess demand is met by fossil fuels. This mechanism is specific to SIDS because it is precisely their energy system rigidity, rather than their income level, that determines the location of the turning point. Thus, the inability to meet growing local energy demand forces institutions to rely on fossil resources, partially disincentivizing REN regardless of income trajectory (Oryani et al., Reference Oryani, Kamyab, Mоridiаn, Azizi, Rezania and Chelliapan2022). This constitutes a structurally distinct EKC trajectory for SIDS, one that policy cannot address through income growth alone but requires direct investment in renewable infrastructure capacity as a precondition for any income-driven green transition to materialize.
5.3. Climate vulnerability, fossil fuel lock-in and the adaptation–mitigation trade-off
The structural rigidity and fossil fuel lock-in mechanisms identified in the preceding sections are further compounded by the climate vulnerability conditions that define the SIDS context. The existing literature has established that environmental degradation can trigger changes within local energy dynamics at both the social and institutional levels (Dabbous et al., Reference Dabbous, Horn and Croutzet2023; Xie et al., Reference Xie, Abbass and Li2024). However, our findings reveal a counterintuitive pattern: rather than spurring a green transition, higher climate vulnerability and CO2 emissions are associated with lower REN in SIDS. This result can be understood through three complementary mechanisms that are structurally specific to the SIDS context.
The first mechanism is the adaptation–mitigation trade-off, which operates precisely because SIDS face the combination of acute vulnerability and severely constrained resources identified throughout this discussion. SIDS facing climate vulnerability are frequently compelled to direct their limited financial and institutional resources towards immediate adaptation measures, coastal protection infrastructure, flood management and disaster resilience, rather than towards longer-term mitigation strategies centred on renewable energy deployment (European Commission, 2023; Ahmed et al., Reference Ahmed, Chowdhury, Zzaman, Ul Islam, Nahar and Roy2024). In contexts where survival needs are urgent, governments may rationally prioritize adaptation over mitigation even when international commitments nominally favour the latter. This trade-off is more severe in SIDS than in larger developing countries because the absolute scarcity of fiscal resources and institutional bandwidth means that adaptation and mitigation are genuinely competing rather than complementary priorities. The second mechanism – fossil fuel lock-in compounded by climate exposure – deepens the trade-off identified in the preceding paragraph by showing that vulnerability and fossil dependence are mutually reinforcing rather than independent forces. High climate vulnerability in SIDS often coincides with entrenched energy infrastructure built around diesel generation and imported fossil fuels, reflecting decades of investment in systems that are difficult and costly to replace. This creates a vulnerability trap in which the same structural conditions that make a country most exposed to climate change also make it least capable of transitioning away from the energy systems that contribute to it. Limited access to concessional financing for renewable infrastructure, combined with the high upfront capital costs of energy transition, reinforces this dependency and suppresses the renewable energy share even as vulnerability increases, a dynamic that does not appear in studies of larger economies where climate vulnerability and renewable capacity can coexist.
The third mechanism – rebound effects from capital inflows – connects the vulnerability trap to the capital flow dynamics documented in previous sections, completing a mutually reinforcing structural cycle. Both ODA and FDI tend to stimulate economic activity in SIDS without a corresponding shift towards renewable energy, meaning the resulting increase in overall energy demand is met primarily by fossil fuels given that renewable capacity is insufficiently scaled to absorb it. Economic growth driven by foreign capital therefore paradoxically deepens fossil fuel dependence in the short to medium term, compounding the negative relationship between development-oriented capital flows and REN. Together, these three mechanisms suggest that the negative effect of CVI and CO2 is not a statistical artefact but reflects structural features of SIDS energy systems that policy must explicitly address. These findings also reinforce the productivity paradox presented, where apparent improvements in RenProd mask a widening gap between GDP growth and genuine decarbonization. This interpretation is consistent with the mechanical structure of the RenProd indicator (GDP/REN): apparent productivity gains are partly algebraically driven by the same suppression of REN documented in Table 1, rather than reflecting independent evidence of GDP orientation. Such results point to the need for international finance mechanisms that go beyond aggregate economic support to directly target the structural barriers to renewable energy adoption in SIDS, specifically, the provision of concessional financing for grid-scale renewable infrastructure as a precondition for any of the theoretical mechanisms linking foreign capital to green transitions to become operative.
6. Conclusions
In the preceding sections, we have examined the relationship between different types of monetary flows to SIDS and their connection to the transition to green economies. Our findings demonstrate that, in the case of SIDS, monetary flows tend to prioritize economic considerations over the process of reducing dependence on fossil fuel sources. These relationships can be understood within the broader priorities that receive greater attention from ODA, representing public monetary flows aimed at meeting the basic needs of host countries, and FDI, representing private capital flows directed towards fulfilling specific investment needs of foreign entities. Focusing on SIDS allows us to better understand the developmental processes within emerging economies, which are particularly interesting due to their socio-economic dynamics being less influenced by interconnectivity and complexities present in less isolated countries.
In summary, these conclusions align with those of the Pollution Haven Hypothesis and other related theories, suggesting that foreign investment sources do not contribute to the transfer of less environmentally detrimental technologies and processes. However, our study on RenProd challenges the dichotomy between economic growth and low carbon dependency. We have observed that the priority of SIDS countries lies in economic growth rather than achieving energy independence from fossil fuels. This finding aligns with the EKC framework, suggesting that economic growth can potentially lead to increased income levels that, in the future, are expected to foster a better balance between socio-economic activities and environmental sustainability.
Our findings carry several concrete policy implications. Regarding ODA, since general assistance flows do not promote REN, donors should move towards earmarked climate finance within ODA frameworks, linking disbursements to measurable energy transition outcomes through green budget tagging and results-based financing mechanisms rather than input expenditure alone. Regarding FDI, our results are consistent with the Pollution Haven Hypothesis, indicating that tax exemption frameworks attract investment oriented towards economic returns rather than clean technology deployment. SIDS governments should negotiate conditional investment treaties tying tax incentives to renewable energy use thresholds and adopt local content policies that require foreign investors to source energy inputs from domestic renewable sources, building the supply chains that currently constrain the green transition. For SIDS governments more broadly, our findings on the adaptation–mitigation trade-off suggest that integrated energy-cluster strategies – combining renewables with desalination or tourism infrastructure – offer a path to pursue mitigation and adaptation jointly rather than as competing fiscal priorities. Finally, for the international community, our results show that higher climate vulnerability is associated with lower REN, reflecting fiscal constraints that prevent the most exposed SIDS from leading their own transitions. Vulnerability-weighted climate finance and debt-for-energy-swap arrangements would directly address these constraints by reorienting the international financial architecture towards the structural transformation that current ODA and FDI configurations are failing to deliver.
This study is subject to several limitations that simultaneously define a productive agenda for future research. Although SIDS share structural characteristics of smallness, insularity and climate vulnerability, they remain heterogeneous in income levels, geography and economic structure, meaning our conclusions should be read as broad tendencies rather than generalizable findings. Data constraints prevented the inclusion of fossil fuel consumption, energy intensity and broader environmental metrics such as biodiversity loss or composite green economy indices, all of which would more fully capture the multidimensional sustainability dynamics relevant to SIDS. The use of fishing sector productivity as a proxy for general economic productivity may also introduce bias for countries where tourism, remittances or offshore finance dominate, and future work should explore sectoral GDP decompositions as more granular alternatives. On the methodological front, Panel Vector Autoregression or dynamic panel threshold approaches would allow future researchers to assess how ODA and FDI impacts evolve across income and institutional quality thresholds, while instrumental variable strategies using donor GDP shocks or global commodity prices as instruments would address the reverse causality concerns that our GMM robustness check only partially resolves. Finally, qualitative case studies of individual SIDS with contrasting green transition trajectories, such as Seychelles and Tuvalu, would uncover the institutional and political mechanisms behind the quantitative trends identified here, providing contextual depth that panel estimation cannot supply.
Supplementary material
The supplementary material for this article can be found at https://doi.org/10.1017/S1355770X26100692.
Competing interests
The authors declare none.