



1. Introduction
Turbulent thermal convection is a phenomenon present in nature and in many technological applications. The idealized version is a fluid contained within adiabatic sidewalls and conducting horizontal top and bottom plates, cooled from above and heated from below. This system is known as Rayleigh–Bénard convection (RBC). RBC has been a model for the study of buoyancy-driven fluid turbulence and heat transfer in turbulent flows. In this system most of the temperature difference is sustained by thin thermal boundary layers (BLs), one each adjacent to the top and bottom plate, with an interior that is nearly isothermal in the time average. The thermal boundary layers play a key role in the heat transfer. Thermal plumes detach from them, initiating and contributing to the driving of a large-scale circulation (LSC) in the bulk. RBC has been extensively explored in many experimental, numerical and theoretical studies (for reviews, see Kadanoff Reference Kadanoff2001; Ahlers Reference Ahlers2009; Ahlers, Grossmann & Lohse Reference Ahlers, Grossmann and Lohse2009; Lohse & Xia Reference Lohse and Xia2010; Chillà & Schumacher Reference Chillà and Schumacher2012).
In the great majority of papers on RBC, the sample was kept far away from any phase transitions so that only a single phase of the fluid was present. An exception is the experimental study of turbulent two-phase RBC using ethane at a constant pressure
 $P$
near its vapour pressure curve
 $T_{{\it\phi}}(P)$
by Zhong, Funfschilling & Ahlers (Reference Zhong, Funfschilling and Ahlers2009). Those authors applied a fixed temperature difference
 ${\rm\Delta}T=T_{b}-T_{t}$
between the bottom (at
 $T_{b}$
) and the top (at
 $T_{t}$
) of the sample, with the mean temperature
 $T_{m}=(T_{b}+T_{t})/2$
chosen so that
 $T_{t}<T_{{\it\phi}}$
while
 $T_{b}>T_{{\it\phi}}$
. Under those conditions the bulk of the sample consisted of vapour when its temperature
 $T_{m}$
was above
 $T_{{\it\phi}}$
, and liquid droplets (‘rain drops’) formed in the boundary layer below the top plate (where over a very thin layer
 $T$
was less than
 $T_{{\it\phi}}$
) and fell towards the bottom, evaporating along their path and thus contributing to the heat transport. When
 $T_{m}<T_{{\it\phi}}$
, the bulk of the sample filled with liquid, and vapour bubbles formed in the BL adjacent to the bottom plate. The authors found a reproducible and history-independent enhanced heat transport due to droplet condensation, which increased linearly by as much as an order of magnitude with decreasing
 $T_{m}$
. When
 $T_{m}<T_{{\it\phi}}$
and vapour bubbles formed near the bottom plate, the heat transport became time- and history-dependent. The authors concluded that the droplet formation within the liquid BL below the top plate occurred away from the solid surface and was not influenced by the surface roughness, leading to a nucleation process that was homogeneous. However, the vapour-bubble formation apparently involved heterogeneous nucleation processes which were hysteretic and irreproducible. A similar study was carried out more recently by Weiss & Ahlers (Reference Weiss and Ahlers2013) using a nematic liquid crystal which undergoes a first-order phase transition from the nematic to the isotropic state; in this case the latent heat involved is much smaller than is typical at the liquid–gas transition but comparable to that of transitions in the Earth’s mantle.
Boiling is a very effective mode of heat transport and therefore it is used in various situations where a high heat removal rate from a surface is desired. It is of fundamental interest to understand the physical mechanisms responsible for the heat-flux enhancement in a turbulent boiling flow. There have already been multiple studies of the heat flux attained due to heterogeneous boiling in natural convection and under the influence of a forced flow (for reviews, see, for instance, Dhir Reference Dhir1998; Kim Reference Kim2009). Boiling is a complex problem since it depends on liquid as well as surface properties. For example, increasing roughness decreases the incipient boiling temperature, with a noticeable effect seen even for mean roughness as small as
 $10$
nm, as reported by Bourdon et al. (Reference Bourdon, Rioboo, Marengo, Gosselin and De Coninck2011). Those authors also found that wettability has an effect on the incipient boiling temperature: a larger contact angle requires a lower boiling superheat than is the case for a smaller contact angle. On the other hand, wettability also affects bubble growth and bubble departure from a surface due to buoyancy (Nam et al.
Reference Nam, Wu, Warrier and Sungtaek Ju2009). Because boiling depends on many parameters, a complete quantitative understanding has not yet been achieved.
Boiling RBC was addressed in numerical studies by Oresta et al. (Reference Oresta, Verzicco, Lohse and Properetti2009), Lakkaraju et al. (Reference Lakkaraju, Schmidt, Oresta, Toschi, Verzicco, Lohse and Prosperetti2011), Schmidt et al. (Reference Schmidt, Oresta, Toschi, Verzicco, Lohse and Prosperetti2011), Biferale et al. (Reference Biferale, Perlekar, Sbragaglia and Toschi2012), Lakkaraju et al. (Reference Lakkaraju, Stevens, Oresta, Verzicco, Lohse and Prosperetti2013) and Lakkaraju, Toschi & Lohse (Reference Lakkaraju, Toschi and Lohse2014). In these studies a constant number of deliberately introduced bubbles (bubble nucleation and detachment were not simulated), with arbitrarily chosen diameters of several tens of micrometres, was seen to significantly change the structure of the convective flow. For a small Jakob number
 $\mathit{Ja}$
(the ratio of sensible to latent energy, see (2.3) below), Oresta et al. (Reference Oresta, Verzicco, Lohse and Properetti2009) and Schmidt et al. (Reference Schmidt, Oresta, Toschi, Verzicco, Lohse and Prosperetti2011) reported that the bubbles take a significant amount of energy from the hot plate and release it close to or at the cold one, thus (at constant total applied heat current) decreasing the temperature difference between the plates responsible for driving the natural convection. For larger
 $\mathit{Ja}$
, bubbles grow in hot flow regions, contributing to buoyancy and thereby leading to an overall higher heat transport. Also, at larger
 $\mathit{Ja}$
, bubbles were found to augment velocity fluctuations of the liquid through mechanical forcing (Schmidt et al.
Reference Schmidt, Oresta, Toschi, Verzicco, Lohse and Prosperetti2011) and therefore increase the kinetic energy dissipation rate (Lakkaraju et al.
Reference Lakkaraju, Schmidt, Oresta, Toschi, Verzicco, Lohse and Prosperetti2011), which in turn enhances mixing of the thermal field. For all
 $\mathit{Ja}$
values, bubbles were found to increase the thermal energy dissipation rate (Lakkaraju et al.
Reference Lakkaraju, Schmidt, Oresta, Toschi, Verzicco, Lohse and Prosperetti2011) because bubbles create large local temperature gradients as their surface temperature is fixed at the saturation temperature. Lakkaraju et al. (Reference Lakkaraju, Stevens, Oresta, Verzicco, Lohse and Prosperetti2013) found that bubbles subject the boundary layers to intense velocity and thermal fluctuations, adding to convective effects and breaking the up–down symmetry observed for the single-phase flow by considerably thickening the layer of hot fluid at the bottom. These authors studied the flow at various thermal forcing values (i.e. Rayleigh numbers
 $\mathit{Ra}$
, see (2.1) below) as well as for different bubble numbers. They found that the heat-transport enhancement relative to the non-boiling RBC flow due to vapour bubbles was a decreasing function of
 $\mathit{Ra}$
and that, given a fixed
 $\mathit{Ra}$
, the enhancement increased with bubble number and with the degree of superheating of the bottom plate (i.e. with increasing
 $T_{b}$
). They found an expression for the effective buoyancy that is an increasing function of the superheating. Strong intermittency of the temperature fluctuations originated from sharp temperature fronts. These fronts smoothed out in the presence of bubbles due to their effective heat capacity (Lakkaraju et al.
Reference Lakkaraju, Toschi and Lohse2014), reducing the intermittency of the temperature and velocity fluctuations.
Imperfections or cavities on a surface, also called crevices, can trap gas and/or vapour and serve as nucleation sites (Harvey et al. Reference Harvey, Barnes, McElroy, Whiteley, Pease and Cooper1944; Atchley & Prosperetti Reference Atchley and Prosperetti1989; Dhir Reference Dhir1998). Nucleating cavities reduce the superheat necessary to obtain a given heat flux when compared to a smooth surface (Griffith & Wallis Reference Griffith and Wallis1960). In such a case, or if the liquid wets the surface well, heterogeneous nucleation can initiate at superheats similar to those for homogeneous nucleation (Carey Reference Carey2008) since all imperfections are filled with liquid. Gas and vapour entrapment in a cavity can occur when the liquid first gets in contact with the surface. Liquid vapour is more likely to be trapped if the surface is hot. Furthermore, gas dissolved in a saturated liquid might come out of solution and form gas bubbles in cavities as the temperature approaches the boiling temperature. Air dissolved in the fluid and entrapped in cavities affects the nucleation process, leading to greater heat-transfer enhancement and to a lower incipient boiling temperature (Murphy & Bergles Reference Murphy and Bergles1972; Steinke & Kandlikar Reference Steinke and Kandlikar2004). Vapour and gas trapped in a cavity, or so-called nuclei, develop into a bubble only if several criteria are fulfilled; there are various models of the incipient wall superheat for boiling from pre-existing nuclei (see Hsu Reference Hsu1962; Han & Griffith Reference Han and Griffith1965; Singh, Mikic & Rohsenow Reference Singh, Mikic and Rohsenow1976). Kubo, Takamatsu & Honda (Reference Kubo, Takamatsu and Honda1999) were some of the first to study boiling heat transfer using fabricated microcavities. Since then, cavity and surface fabrication methods have been refined, facilitating controlled nucleation experiments. An example of this is the recent work by Witharana et al. (Reference Witharana, Phillips, Strobel, Kim, McKrell, Chang, Buongiorno, Berggren, Chen and Ding2012), where the classical theory for bubble nucleation was validated for nano- to micro-size cavities.
Rough surfaces typically have random potential nucleation sites, and the number of active sites becomes larger as the heat transferred by the surface or the surface superheat
 $T-T_{{\it\phi}}$
(where
 $T$
is the surface temperature) is increased. A larger number of active sites, in turn, increases the heat transferred by the surface. Dhir (Reference Dhir1998) obtained a relation between the active site number and the surface superheat for a typical rough surface. The contribution to the total heat flux of an individual site decreases with increasing heat flux due to a drop in the spacing between active sites (see Barthau Reference Barthau1992; Das, Das & Saha Reference Das, Das and Saha2007). Bi et al. (Reference Bi, Christopher, Lin and Li2014) reported that site spacing had an essential influence on bubble coalescence characteristics, bubble departure size, departure frequency and heat-flux distribution on the heating surface. Interactions between two neighbouring active nucleation sites were studied by Zhang & Shoji (Reference Zhang and Shoji2003), finding that the bubble release frequency depended on cavity spacing and identifying four regions in which interactions between nucleation sites were of different nature. They concluded that the influence of each interaction mechanism may be different for different liquid and surface conditions.
Many proposed mechanisms by which heat is transferred by an isolated bubble growing in a quiescent liquid at a surface and eventually departing are reviewed by Kim (Reference Kim2009). He concluded that, for liquids under conditions spanning a
 $\mathit{Ja}$
range of several orders of magnitude, the processes at the wall such as micro-layer evaporation and contact-line heat transfer contributed less than transient conduction and micro-convection. Transient conduction is related to the wall rewetting process as a bubble grows and departs; micro-convection occurs when a bubble departs and perturbs the liquid adjacent to it, disrupting the natural convection boundary layer. The vapour-bubble energy content (latent heat) mostly came from the superheated liquid attained through the bubble cap and not from processes at the wall. Based on experiments in water, Yabuki & Nakabeppu (Reference Yabuki and Nakabeppu2011) concluded that micro-layer evaporation dominantly contributed to the wall heat transfer during the bubble growth period and that the contribution of the wall heat transfer to the bubble growth declined with increasing wall superheat. The recent work by Baltis & van der Geld (Reference Baltis and van der Geld2015) on vapour-bubble growth in forced convection using water showed that most of the latent heat content of the bubbles came through the surrounding superheated liquid and was relatively independent of the bulk liquid velocity. An increasing bulk liquid temperature led to a decrease of the ratio between heat attained from the wall and from the surrounding liquid.
In the present work we experimentally studied well-controlled heat-flux enhancement due to heterogeneous boiling in a mostly liquid-filled turbulent RBC sample. To overcome the lack of control over nucleation sites at the superheated surface, we used silicon wafers with many identically etched micro-cavities arranged in a lattice that acted as vapour-bubble nucleation sites. After they were deactivated by assuring that they were filled with liquid, the heat flux of the superheated flow under the same thermal forcing conditions as for the boiling experiments was measured. We compared the heat flux of boiling and non-boiling superheated flow and determined the heat-flux enhancement due to vapour-bubble formation. This work thus provides insight into heat-flux enhancement as a global flow quantity under well-controlled boiling conditions, and how this enhancement depends on nucleation site density. Supplementary local temperature measurements revealed the effect of bubbles on the temperature in the bulk of the fluid well above the nucleation sites and showed how this temperature strongly correlates with the heat-flux enhancement.
In the next section of this paper we define various quantities needed in the further discussions. Then, in § 3 we describe the apparatus and measurement procedures used. In § 4 the experimental results are discussed, and in § 5 a summary and our conclusions are provided.
2. Control and response parameters of the system
For a given sample geometry, the state of single-phase RBC depends on two dimensionless variables. The first is the Rayleigh number
 $\mathit{Ra}$
, a dimensionless form of the temperature difference
 ${\rm\Delta}T=T_{b}-T_{t}$
between the bottom (
 $T_{b}$
) and the top (
 $T_{t}$
) plates. It is given by
 $$\begin{eqnarray}\displaystyle \mathit{Ra}=\frac{g{\it\alpha}{\rm\Delta}TL^{3}}{{\it\kappa}{\it\nu}}. & & \displaystyle\end{eqnarray}$$
Here,
 $g$
,
 ${\it\alpha}$
,
 ${\it\kappa}$
and
 ${\it\nu}$
denote the gravitational acceleration, the isobaric thermal expansion coefficient, the thermal diffusivity and the kinematic viscosity, respectively. The second dimensionless variable is the Prandtl number,
 $$\begin{eqnarray}\displaystyle \mathit{Pr}={\it\nu}/{\it\kappa}. & & \displaystyle\end{eqnarray}$$
Unless stated otherwise, all fluid properties are evaluated at the mean temperature
 $T_{m}=(T_{b}+T_{t})/2$
.
For samples in the shape of right-circular cylinders like those used here, a further parameter defining the geometry is needed and is the aspect ratio
 ${\it\Gamma}\equiv D/L$
where
 $D$
is the sample diameter.
In a single-component system involving a liquid–vapour phase change, the relevant dimensionless parameter is the Jakob number,
 $$\begin{eqnarray}\displaystyle \mathit{Ja}=\frac{{\it\rho}C_{p}(T_{b}-T_{{\it\phi}})}{{\it\rho}_{v}H}, & & \displaystyle\end{eqnarray}$$
where
 ${\it\rho}$
and
 ${\it\rho}_{v}$
are the densities of liquid and vapour, respectively,
 $C_{p}$
is the heat capacity per unit mass of the liquid,
 $H$
is the latent heat of evaporation per unit mass, and
 $T_{{\it\phi}}$
is the temperature on the vapour–pressure curve at the prevailing pressure (when the dissolved-air concentration in the liquid equals zero). The limit
 $\mathit{Ja}=0$
implies a bubble that is not able to grow or shrink because either the latent heat is infinite or the vapour and liquid are in equilibrium with each other. In our experiments, dissolved air in the liquid reduced the temperature
 $T_{on}$
at the onset of nucleation below
 $T_{{\it\phi}}$
, and in (2.3)
 $T_{{\it\phi}}$
should be replaced by
 $T_{on}$
; see § 3.6.3. We refer to
 $T_{b}-T_{on}$
as the bottom-plate superheat.
The response of the system to the thermal driving is reflected in the vertical heat transport from the bottom to the top plate, expressed in dimensionless form by the Nusselt number
 $$\begin{eqnarray}\displaystyle \mathit{Nu}=\frac{{\it\lambda}_{eff}}{{\it\lambda}}, & & \displaystyle\end{eqnarray}$$
where the effective conductivity
 ${\it\lambda}_{eff}$
is given by
 $$\begin{eqnarray}\displaystyle {\it\lambda}_{eff}=\frac{QL}{A{\rm\Delta}T}, & & \displaystyle\end{eqnarray}$$
with
 $Q$
the heat input to the system per unit time and
 ${\it\lambda}$
the thermal conductivity of the quiescent fluid. In classical RBC, where the entire bottom-plate area is heated,
 $A$
is the cross-sectional area of the cell. In our case, however, only the central circular area
 $A_{h}$
of 2.54 cm diameter is heated. We choose to define
 ${\it\lambda}_{eff}$
by using only the heated area
 $A_{h}$
instead of the total area
 $A$
in (2.5).
The response of the system is also reflected in temperature time series
 $T(z,x,t)$
taken at positions
 $(z,x)$
in the sample interior. Here
 $z$
is the vertical distance, which we choose to measure from the position of the bottom plate, and
 $x$
is the horizontal distance from the vertical sample centreline (see figure 1
b). We measured
 $T(z,x,t)$
and computed time-averaged temperatures
 $T(z,x)$
, as well as the standard deviation
 $$\begin{eqnarray}\displaystyle {\it\sigma}(z,x)=\langle [T(z,x,t)-T(z,x)]^{2}\rangle ^{1/2} & & \displaystyle\end{eqnarray}$$
and the skewness
 $$\begin{eqnarray}\displaystyle S(z,x)=\langle [T(z,x,t)-T(z,x)]^{3}\rangle /{\it\sigma}^{3} & & \displaystyle\end{eqnarray}$$
of their probability distributions
 $p(T(z,x,t))$
, at the two locations
 $(z/L=0.28,x/D=0)$
and
 $(z/L=0.50,x/D=0)$
. Here and elsewhere
 $\langle \cdots \rangle$
indicates the time average.
3. Apparatus and procedures
3.1. The apparatus
(a) A sketch of the apparatus. The apparatus housed a cell connected to two reservoirs that contained liquid and were open to the atmosphere. The cell was filled with liquid except for the vapour bubbles. The apparatus top window and the transparent top plate of the cell allowed for flow imaging from the top. The arrows indicate the direction of the circulating cooling bath. (b) A sketch of the cell cross-section. The locations of thermistors are indicated by the corresponding measured temperatures
 $T_{cc}$
and
 $T_{cb}$
.

The experiments were conducted in two different convection apparatuses that had similar features. Both have been used before: the so-called ‘small convection apparatus’ was described by Ahlers et al. (Reference Ahlers, Cannel, Berge and Sakurai1994); and details of the other one were given by Ahlers & Xu (Reference Ahlers and Xu2000), Xu, Bajaj & Ahlers (Reference Xu, Bajaj and Ahlers2000), Funfschilling et al. (Reference Funfschilling, Brown, Nikolaenko and Ahlers2005) and Zhong et al. (Reference Zhong, Funfschilling and Ahlers2009). Here a brief outline of the main features is presented and sketched in figure 1(a).
A cylindrical convection cell was located inside a dry can. All free space surrounding the cell was filled with foam in order to prevent convective heat transport by the air. The cell was subjected to a vertical temperature difference by a water-cooled top plate and a bottom plate heated by a film heater glued to its underside. The temperatures of both plates were computer-controlled; top and bottom plate had milli-kelvin and centi-kelvin stability, respectively (Zhong et al. Reference Zhong, Funfschilling and Ahlers2009). The cylindrical dry can was inside a larger cylindrical container. The bath water flowed between them: closest to the dry can the water moved upwards, reached the apparatus top where it cooled the top plate of the cell, and then flowed downwards in a cylindrical space separated from the up-flow by a wall made of low-conductivity material.
Reservoir bottles (outside the apparatus) were connected to the top and bottom of the convection cell via thin teflon tubing. The tubing and electrical leads passed through a wider tube, which went from the dry can through the bath to the laboratory. A window in the top of the apparatus and a transparent (sapphire) top plate of the cell enabled visualization of the cell interior. Two cameras (a QImaging Retiga 1300 and a high-speed Photron Fastcam Mini UX100), two lenses (Micro Nikkor 105 mm,
 $f/2.8$
and AF Nikkor 50 mm,
 $f/1.4$
) and three desk lamps (using 13 W, 800 lm bulbs) that remained on throughout all measurements were used to capture images of the flow. Since we investigated differences of heat flux and temperature, the very small effect of the radiation from the lamps did not influence the results significantly.
3.2. The cell and the bottom plate
In both apparatuses a cell with the same features was used. Each cell (shown in figure 1
b) consisted of a polycarbonate sidewall with thickness
 $t=0.63$
cm, height
 $L=8.8$
cm and aspect ratio
 ${\it\Gamma}\equiv D/L=1.00$
(
 $D$
is the cell diameter). The fluid in the cell was confined between a bottom plate and a 0.635 cm thick, 10 cm diameter sapphire plate on the top. The bottom plate consisted of a 10 cm diameter silicon wafer on top of a copper cylinder with diameter
 $D_{h}=2.54$
cm surrounded by a 10 cm outer diameter and 1.26 cm thick plastic ring, and a metal-film heater attached to the bottom of the copper cylinder. All silicon wafers were
 $L_{s}=0.53$
mm thick, with nucleation cavities etched into their upward-facing sides over a central circular area of 2.54 cm diameter. The copper cylinder had a T-shaped cross-section that widened near its bottom from 2.54 to 5.08 cm diameter. The area in contact with and heating the silicon wafer was
 $A_{h}=5.07~\text{cm}^{2}$
. Either a 56
 ${\rm\Omega}$
or a 38
 ${\rm\Omega}$
round Kapton metal-film heater (with nominal diameter of 5.1 cm or 3.8 cm, respectively) was glued to the bottom of the copper piece. The wafer was glued to both the top of the copper piece and the plastic ring. In some cases the glue used was degassed epoxy (Emerson and Cuming, STYCAST 1266). In others it was acrylic pressure-sensitive adhesive or PSA (Minco No. 19), with nominal thickness of 0.051 mm. The plastic ring provided support to hold the cell tightly while it prevented the silicon wafer from breaking. The ring was made of polycarbonate (which has a low thermal conductivity) in order to reduce the heat conducted horizontally towards the cell edge.
In preliminary experiments, heating took place over the entire bottom-plate area (diameter of 10 cm); this led to undesired nucleation sites along the spacing between the sidewall and the bottom plate.
To account for the heat flux across the cell walls and for the heat lost into the apparatus, we measured the heat flux at a temperature difference
 $T_{b}^{\star }-T_{t}^{\star }=20$
K across the empty cell for various
 $T_{m}$
at a pressure smaller than 0.06 bar. This heat flux was due to the heat conducted across the cell wall, to pure conductive heat flux through air in the cell, and to any heat lost through the can (see figure 1
a). After subtracting an estimate of the heat flux due to stagnant air, we obtained the correction. With increasing
 $T_{m}$
the correction ranged from approximately 25 % to approximately 19 % of the one-phase measured heat flux.
3.3. Temperature measurements
A thermistor (Honeywell type 121-503JAJ-Q01) was inserted inside the plastic ring and underneath the cell edge to keep track of the edge temperature
 $T_{e}$
, as shown in figure 1(b). We measured the vertical temperature difference across the edge of the plastic ring by inserting a second thermistor (not shown in figure 1
b) at the lower edge of the ring (below the location of
 $T_{e}$
). This temperature difference was found to be less than 1 % of
 ${\rm\Delta}T$
. Another thermistor of the same type was inserted into the copper piece approximately 1.4 cm below the upper surface and measured
 $T_{b}^{\star }$
(see figure 1
b), which was controlled so as to be constant during a run.
The net thermal resistance
 $R_{w}$
of the silicon wafers depended on the number of cavities
 $N$
etched over an area
 $A_{h}$
. We estimated it by assuming that it was the result
 $R_{w}=R_{s}+R_{s}^{\prime }$
of two resistors in series. Since the conductivity of the fluid in the cavities was negligible compared to that of silicon, we took the first part
 $R_{s}$
to be that of the wafer near the fluid and of thickness
 $L_{c}=100~{\rm\mu}$
m and cross-sectional area
 $A_{h}-NA_{c}$
. Here
 $L_{c}$
is the cavity depth and
 $A_{c}$
is the cavity cross-sectional area. The second resistor
 $R_{s}^{\prime }$
, representing the remainder of the wafer, had a thickness
 $L_{s}-L_{c}$
and a cross-sectional area
 $A_{h}$
. For the wafer etched with
 $N=33\,680$
cavities,
 $R_{w}$
was approximately 5 % larger than
 $R_{w}$
for the wafer with
 $N=570$
cavities.
Photograph of a Honeywell 111-104HAK-H01 thermistor assembled with its 0.8 mm diameter ceramic rod, ready for insertion into the interior of the cell.

The temperature
 $T_{b}$
at the liquid–solid interface of the wafer was obtained by considering the temperature drop across each of the bottom-plate layers, namely the copper, glue and silicon wafer. When epoxy was used as glue, its thickness was determined indirectly by measuring the thermal resistance across all layers (see appendix A). Because of the relatively small heated area and low thermal conductivity of epoxy or PSA compared to those of copper and silicon, even a very thin layer of these materials had a significant effect on the temperature difference between
 $T_{b}^{\star }$
and
 $T_{b}$
. The temperature drop
 $T_{b}^{\star }-T_{b}$
depended on the heat flux and varied between 3 and 5 K for an applied temperature difference
 $T_{b}^{\ast }-T_{t}^{\ast }$
of 20 K.
The top temperature
 $T_{t}^{\star }$
was determined with a thermistor of the same type immersed into the cooling bath through the top side of the apparatus. It was held constant during each run. The temperature drop (of a fraction of a degree) across the top plate was estimated from the thermal conductivity of sapphire and the applied heat current in order to determine the liquid top temperature
 $T_{t}$
.
All thermistors were calibrated against a Hart Scientific Model 5626 platinum resistance thermometer with milli-kelvin precision.
One of the cells had two extra 0.36 mm diameter thermistors (Honeywell type 111-104HAK-H01) inserted into the interior of the cell. Each thermistor had its leads passed through 0.13 mm diameter holes embedded along a ceramic rod 0.8 mm in diameter (Omega ceramic thermocouple insulators type TRA-005132); see figure 2. The rods went through 0.9 mm holes drilled through the sidewall so that both thermistors were on the same vertical plane, one at mid-height (
 $z/L=0.50$
) and the other one 2.54 cm above the wafer surface (
 $z/L=0.28$
). The holes were sealed to the external side of the cell using epoxy. Both thermistors were inserted half-way through the cell diameter (at
 $x/D=0$
); the one at
 $z/L=0.28$
acquired the temperature
 $T_{cb}$
and the one at
 $z/L=0.50$
measured
 $T_{cc}$
. These thermistors were calibrated against the water-bath thermistors. More details about the use and performance of these thermistors are given by He et al. (Reference He, van Gils, Bodenschatz and Ahlers2014) and Wei & Ahlers (Reference Wei and Ahlers2014) and in appendix B. We estimate that the uncertainty of the vertical position of each thermistor is approximately
 $\pm 0.01L$
.
Schematic diagram and images of a wafer with an equilateral triangular lattice of etched cavities. (a) Diagram showing the centre-to-centre distance
 $l$
between neighbouring cavities and the cavity diameter
 $2r=30~{\rm\mu}$
m. (b) A scanning electron microscope image of a diagonal cut through a wafer with
 $l=0.1$
mm. (c) A scanning electron microscope image of a cut through a single cavity with a depth
 $L_{c}=0.10$
mm.

3.4. The etched wafers
We performed experiments using five different silicon wafers (Okmetic, Vantaa, Finland, crystalline orientation (100)) with micrometre-sized cavities on a triangular lattice (see figure 3
a) made by a lithography/etching process on one polished wafer side. The process was carried out under clean-room conditions using a plasma dry-etching machine (Adixen AMS 100 SE, Alcatel). The wafers were plasma-cleaned to remove any fluorocarbon traces remaining from the plasma dry-etching process. In each wafer the cavity lattice covered a 2.5 cm diameter circular area centred on the wafer; outside this area the wafers had a smooth surface (3.46–4.22 Å). The roughness of the cavity walls was less than 500 nm. The etched area accurately coincided with the heated area
 $A_{h}$
. The cooling area extended over the entire top plate; thus it was 15.5 times larger than
 $A_{h}$
. Each wafer had a different centre-to-centre cavity spacing
 $l$
and thus a different cavity density, as listed in table 1. The cavities had a depth of
 $L_{c}=100\pm 5~{\rm\mu}$
m and a diameter of
 $2r=30\pm 2~{\rm\mu}$
m. Figure 3(b) shows an image of a diagonal cut through a sample wafer with
 $l=0.1$
mm. In figure 3(c) the dimensions and shape of a single cavity can be appreciated. Figure 4 shows a snapshot from the top of controlled boiling with
 $l=$
0.60 mm; note that bubble nucleation only takes place at the etched cavities over
 $A_{h}$
.
The total number of cavities,
 $N$
, the centre-to-centre spacing,
 $l$
, and number of cavities per
 $\text{mm}^{2}$
,
 $N/A_{h}$
, for the wafers used in this study.

Snapshot of active nucleating cavities covering a central circular area
 $A_{h}$
of 2.54 cm diameter of the bottom silicon plate. The cavity separation was 0.60 mm. Bright dots correspond to bubbles still attached to the cavity mouths. Detached bubbles already risen to a greater height are out of focus and appear as diffuse grey spots. The flat area outside of the central 2.54 cm diameter area contains no cavities and thus shows no bubble nucleation. A thermistor inserted well above the bottom plate, extending from the top of the image towards the centre, is out of focus.

3.5. The fluid
The working fluid was the fluorocarbon 1-methoxyheptafluoropropane (Novec7000™manufactured by 3M™). We chose this liquid because it has a relatively low boiling temperature of
 $34\,^{\circ }\text{C}$
at atmospheric pressure. At room temperature and a pressure of 1 bar, the solubility of air is approximately 31 % by volume. All relevant properties are given as a function of temperature by the manufacturer and they were evaluated at
 $T_{m}$
unless stated otherwise. In the experiments presented here,
 $T_{m}$
ranged from 35 to
 $18\,^{\circ }\text{C}$
. The Prandtl number (see (2.2)) ranged from 7.5 to 8.2 with decreasing
 $T_{m}$
. The resulting Rayleigh number (see (2.1)) ranged from
 $1.4\times 10^{10}$
to
 $2.0\times 10^{10}$
over the range of
 $T_{m}$
.
3.6. Experimental procedure
3.6.1. Cell filling procedure
The cavities were active nucleation sites when they were filled with gas and inactive when filled with liquid. A carefully defined cell filling procedure had to be followed in order to produce gas-filled cavities while the entire remainder of the cell was filled with liquid.
Initially the cell contained no liquid, and the reservoir connected to the bottom part of the cell (see figure 1 a) contained all the liquid. Both reservoirs were connected to the cell through tubing attached at their lids. The reservoirs also had short tubes at their bottom that could provide a connection to the atmosphere or be closed when, for example, the reservoir filled with liquid was to stand on a solid surface. In order to fill the cell, the reservoir connected to the bottom part of it was held upside down above the bottom-plate level while the other (empty) reservoir was open to the atmosphere.
The filling speed was determined by the vertical position of the reservoir connected to the cell bottom. Filling the cell too rapidly by positioning the reservoir too high above the bottom plate led to deactivation of the cavities positioned closest to the liquid entrance. Not positioning the reservoir high enough prevented the hydrostatic pressure from overcoming the excess pressure due to liquid boiling in the cell and liquid did not flow into it. During filling we used
 $T_{b}^{\star }=45\,^{\circ }\text{C}$
and
 $T_{t}^{\star }=15\,^{\circ }\text{C}$
. Since
 $T_{b}^{\star }$
was above the boiling point,
 $\simeq 34\,^{\circ }\text{C}$
, liquid first touching the hot wafer evaporated and the cavities trapped vapour, thus assuring activation of all cavities as more liquid continued to fill the cell. At the same time, since
 $T_{t}^{\star }$
was colder than
 $34\,^{\circ }\text{C}$
, most of the vapour contained in the cell condensed on the top plate, thus reducing the loss of material by escaping vapour. The increasing amount of liquid in the cell boiled throughout the filling time of approximately 3 h, thus eliminating some of the air dissolved in the liquid. The air accumulating in the vapour phase could escape through the tubing connected to the top part of the cell, which remained open to the atmosphere. When the cell was nearly full, the liquid levels inside the reservoir and the cell were set at equal heights and boiling with a free surface continued for another 60 min. This procedure was intended to lead to a reproducible and reduced air concentration in the liquid phase. Afterwards the reservoir containing the remaining liquid was set higher above the bottom plate. This was done gradually in steps to assure that all cavities remained active; a rapid pressure change in the cell could lead to cavity deactivation.
The final liquid column of 1.16 m above the wafer exerted a constant hydrostatic pressure on the bottom plate of
 $16.0\pm 0.3$
kPa in addition to the prevailing atmospheric pressure. The atmospheric pressure measured over a typical three-day period was
 $101.6\pm 0.2$
kPa. The total pressure on the surface of the wafer thus was
 $P=117.6\pm 0.4$
kPa and remained constant throughout all measurements or runs.
For the wafer with
 $l=2.0$
mm it was more difficult to produce active cavities. In this case we used the higher temperatures
 $T_{b}^{\star }=49\,^{\circ }\text{C}$
and
 $T_{t}^{\star }=16\,^{\circ }\text{C}$
while filling the cell. Nonetheless, some nucleation sites became inactive as the cell slowly filled. During the filling process the cell was tilted to prevent the drops forming under the top plate from landing on the boiling central region. Of the 142 etched cavities, the number of active sites, once the cell was full, was 45 or less.
3.6.2. Measurement protocol
We refer to a run with no active sites as one-phase flow and one with active sites as two-phase flow. For all one- and two-phase runs presented here we used
 $T_{b}^{\star }-T_{t}^{\star }=20$
K. A two-phase run typically started at
 $T_{b}^{\star }=45\,^{\circ }\text{C}$
and
 $T_{t}^{\star }=25\,^{\circ }\text{C}$
(in a few cases it started at
 $T_{b}^{\star }=46\,^{\circ }\text{C}$
and
 $T_{t}^{\star }=26\,^{\circ }\text{C}$
). Once a statistically stationary flow was reached, i.e. when the mean values (over intermediate time intervals) of heat flux and passive temperature signals did not vary in time, measurements continued for a sufficiently long time to determine the mean and standard deviation of the measured quantities over the long time iterval. Then the next data point was set by decreasing both
 $T_{b}^{\star }$
and
 $T_{t}^{\star }$
by typically 1 K (or sometimes by a larger step), waiting for statistically stationary conditions, and again measuring for as long as appropriate. The process continued until all nucleation sites became inactive due to the low temperature and filled with liquid. Then
 $T_{b}^{\star }$
and
 $T_{t}^{\star }$
were increased again in steps to carry out the superheated one-phase runs. Once all sites were inactive,
 $T_{b}^{\star }$
could be increased to temperatures as high as
 $65\,^{\circ }\text{C}$
without producing bubble nucleation. In order to generate a new set of two-phase measurements, the cell had to be emptied and then re-filled in order to reactivate the cavities.
For two-phase flow it could take up to two days for the system to reach a statistically stationary state. For most one-phase runs, stationarity was reached within less than a day. Pictures of the active cavities were taken once the stationary state was reached. In all one-phase runs the cell remained full of liquid. For two-phase flow the cell also was full except for the bubbles forming at the bottom plate and condensing at the top cold plate or along their rising motion. It was necessary to keep
 $T_{b}^{\star }$
equal to or below
 $46\,^{\circ }\text{C}$
so as to avoid vapour accumulating near the top of the cell, thus producing a free liquid surface.
3.6.3. Estimate of dissolved-air concentration
The solubility of air in fluorocarbons is quite high, and dissolved air is known to play an important role in the bubble nucleation process (Murphy & Bergles Reference Murphy and Bergles1972; Steinke & Kandlikar Reference Steinke and Kandlikar2004; Shpak et al.
Reference Shpak, Stricker, Versluis and Lohse2013). If the liquid had been fully degassed, the temperature
 $T_{{\it\phi}}$
on the vapour pressure curve would have been
 $38.5\,^{\circ }\text{C}$
at the hydrostatic pressure
 $P$
exerted on the bottom plate. The fact that bubbles nucleated at temperatures below
 $38.5\,^{\circ }\text{C}$
indicates that air was dissolved in the liquid and reduced the saturation temperature.
Assuming the validity of Henry’s law and a Henry’s law constant independent of temperature over our temperature range, we made an estimate of the dissolved-air concentration. For seven two-phase data sets we extrapolated the excess heat current due to boiling as a function of temperature to the temperature
 $T_{b}$
where it vanished (i.e. where all nucleating sites became inactive; see § 4.2). Averaging over these sets gave
 $30.3\pm 1.1$
°C, which we define here as
 $T_{on}$
. Setting
 $T_{on}$
as the vapour–liquid equilibrium temperature
 $T_{{\it\phi}}(P_{v})$
gave a vapour partial pressure
 $P_{v}=86.2$
kPa. The total pressure of
 $P=117.6$
kPa and assuming that
 $P_{a}=P-P_{v}$
yielded an air partial pressure
 $P_{a}=31.4$
kPa. Using the known solubility of 31 % by volume of air at
 $25\,^{\circ }\text{C}$
and atmospheric pressure (approximately 101 kPa), we estimated Henry’s law constant and used it to find that this value of
 $P_{a}$
corresponds to an air concentration in the liquid of 23 % by volume (for details of the calculation, see appendix C). Given the high solubility of air at ambient conditions, this estimate is reasonable, and the reproducibility of
 $T_{on}$
indicates that the liquid used in our measurements had a reproducible amount of air dissolved in it.
4. Results
4.1. Visualization of the nucleating area
Here we present qualitative features of the two-phase flow obtained by imaging the vapour-bubble-nucleating silicon wafers from above.
Averaged-intensity images of the wafer with cavity spacing
 $l=0.19$
mm of active nucleating sites at the bottom-plate superheats
 $T_{b}-T_{on}$
given: (a) 9.3 K, (b) 7.8 K, (c) 6.9 K, (d) 6.0 K, (e) 5.1 K, (f) 4.2 K, (g) 3.3 K, (h) 2.3 K, (i) 1.4 K. All images cover the same area. In (a) the bright circle corresponds to the heated/etched area
 $A_{h}$
with 2.5 cm diameter. Nearly all 15 460 sites were active. Outside
 $A_{h}$
no bubble nucleation took place and the wafer surface appears black. In (b) most sites were still active. A few larger bubbles (very bright dots) can be seen near the periphery of
 $A_{h}$
. In (c) an inner dark circle of inactive sites started forming; a few sites at the outer rim turned inactive, similar to (d). In (e) the inner inactive circle expanded. In (f–i) more and more sites became inactive.

For wafers with
 $l=0.10$
, 0.19 and 0.60 mm an increasing number of nucleating sites near the rim of the etched area turned inactive as
 $T_{b}$
decreased. This is illustrated in figure 5. There, the nine images show the same area (slightly larger than the etched area
 $A_{h}$
of 2.54 cm diameter) of the wafer with cavity separation
 $l=0.19$
mm (15 460 cavities). Each image is the result of averaging over two sets of 32 snapshots taken within 8 s; the sets were captured at least 2 h apart and once the system had reached a stable state. These averaged images show inactive cavities as dark dots located where, at a higher temperature, there were active cavities revealed by bright dots. Typically, at the beginning of a two-phase run,
 $T_{b}\simeq 40\,^{\circ }\text{C}$
and all cavities were active. Figure 5(a) is for
 $T_{b}=39.60\,^{\circ }\text{C}$
(
 $T_{b}-T_{on}=9.3$
K), where the large majority of sites were still active. As
 $T_{b}$
was decreased, an increasing number of sites deactivated. Merging of several small bubbles resulted in larger bubbles that remained on the surface for much longer times than the departing smaller bubbles. These larger, long-lasting bubbles were identified with larger very bright spots on the images. For this wafer in particular, a circle of inactive sites inside the etched area developed. However, this was not a common feature of other wafers, for which the diameter of the area covered by mostly active cavities typically simply shrank; see below and § 4.6. Silicon wafers processed with a plasma dry-etching process can show structures with unexpected deviations due to non-uniform plasma density, so that individual wafers made with the same recipe can differ from each other. Similar non-uniformities have been reported in the literature (Nagy Reference Nagy1984; Kao & Stenger Reference Kao and Stenger1990).
Bubbles that formed for
 $l=0.10$
and 0.19 mm typically merged with several of their neighbours to form larger bubbles, which either immediately after merging separated from the surface or remained attached to the surface for some time (see the high-speed movie number 1 in the supplementary material available at http://dx.doi.org/10.1017/jfm.2015.701 taken at 500 frames per second (f.p.s.) of the actively nucleating
 $l=$
0.19 mm wafer). For wafers with larger
 $l$
, merging of more than two to three neighbouring nucleating bubbles was not observed and merging in general was less common than for
 $l=0.10$
and 0.19 mm. We found that bubbles growing on a wafer with larger
 $l$
, when they detached, often perturbed the surrounding liquid, which then perturbed neighbouring bubbles. These perturbed bubbles often were observed to oscillate laterally without detaching. The majority of detached bubbles moved horizontally a few centimetres under the influence of the LSC before becoming out of focus due to their vertical motion. Detached bubbles frequently collided and merged. The resulting larger bubble continued moving laterally with the LSC, as illustrated by the high-speed (500 f.p.s.) movie number 2 in the supplementary material, which shows nucleation on the
 $l=0.60$
mm wafer.
Average intensity images of nucleating bubbles on a wafer with cavity spacing
 $l=0.60$
mm at the
 $T_{b}-T_{on}$
values given: (a) 9.3 K, (b) 4.7 K, (c) 3.1 K. In (a) all sites except for six (the six dark dots on the lattice) were active. The edge of the etched area can be seen at the left bottom corner. In (b) and (c) an increasing number of sites became inactive.

Figure 6 shows three images that are each the result of averaging 500 snapshots of bubble nucleation on a wafer with
 $l=0.60$
mm for different
 $T_{b}-T_{on}$
values. All three images cover the same area of the wafer (see the scale bar on figure 6
c). The edge of the etched area
 $A_{h}$
can be seen at the left bottom corner of figure 6(a). As in figure 5, an increasing number of sites, starting at the rim of the etched area, turned inactive as superheat was reduced. Randomly located nucleation sites inside
 $A_{h}$
also deactivated.
The size of a bubble seen in the averaged images for
 $l=0.60$
mm is close to the maximum size, which is reached at departure from the nucleation site. The same is the case for bubbles formed on an
 $l=1.0$
mm wafer. The size of nucleated bubbles close to the outer rim became noticeably smaller with the reduction of
 $T_{b}-T_{on}$
between figure 6(a) and (b). Figure 6(c) shows that with a further decrease of
 $T_{b}-T_{on}$
many sites stopped nucleating and the remaining ones nucleated smaller bubbles. As superheat decreased, the bubble growth rate and detachment frequency decreased as well and a smaller frame rate was enough to capture the bubble evolution. For example, in figure 6(a) 500 f.p.s. captured the typical growth of a vapour bubble, whereas for figure 6(b,c) 50 f.p.s. were sufficient. The mean bubble diameter before departure in figure 6(a) was approximately 0.5 mm and in figure 6(c) approximately 0.2 mm.
We assume that deactivation of more and more sites with decreasing
 $T_{b}-T_{on}$
near the perimeter of the area covered by cavities was a consequence of the localized heating over
 $A_{h}$
. Because of lateral heat flow through the polycarbonate ring and the wafer (see figure 1
b) towards the sidewall, there was a horizontal temperature gradient in the wafer that influenced the bubble nucleation. This is suggested by the normalized measured temperature difference
 $(T_{b}-T_{e})/{\rm\Delta}T\simeq 0.6$
; but it should be noted that most of this lateral temperature change was across the part of the plate outside the central area
 $A_{h}$
across the polycarbonate ring and the wafer above it, while the temperature gradient in the active area
 $A_{h}$
above the high-conductivity copper plug remained small.
In general, the number of sites turning inactive when
 $T_{b}$
was decreased occurred both at the rim of the etched area and inside it at randomly located nucleation sites. We also observed that, at the same superheat, cavities in wafers with larger
 $l$
were more likely to stop nucleating. For example, for a data set obtained with
 $l=1.0$
mm, 60 % of the active sites at
 $T_{b}=40.13\,^{\circ }\text{C}$
deactivated when
 $T_{b}=36.63\,^{\circ }\text{C}$
. This may be compared with a data set measured with an
 $l=0.60$
mm wafer, which showed deactivation of only 23 % when
 $T_{b}$
was reduced from 39.98 to 36.13 °C. In the case of
 $l=0.19$
mm and a very similar
 $T_{b}$
difference (compare figure 5
a and d), far less than 23 % of the active sites became inactive (see figure 5
a). These observations indicate that nucleating sites closer to each other prevent neighbouring sites from early deactivation; results obtained for
 $l=0.1$
mm confirmed this as well. The extreme case was
 $l=$
2.0 mm, which, as described in § 3.6, could not maintain all sites active even for a superheat larger than the highest one used for all other cavity separations. These observations suggest that interacting nucleating sites, which grow smaller bubbles than well-separated sites, prevent cavities from being filled with liquid.
Schematic diagram of the bottom (
 ${\it\lambda}_{T,b}$
) and top (
 ${\it\lambda}_{T,t}$
) one-phase boundary-layer (BL) thicknesses, given that the bulk normalized temperature was
 $(T_{cc}-T_{t})/{\rm\Delta}T\simeq 0.27$
or equivalently
 $(T_{b}-T_{cc})/{\rm\Delta}T\simeq 0.73$
. The bulk flow extends across most of the cell height
 $L$
, which is not shown to scale in the diagram. A fully grown bubble of typical size (hundreds of micrometres) attached to the bottom plate (
 $z=0$
) is displayed for comparison with the thermal BL thickness.

4.2. Heat-flux enhancement
4.2.1. Some considerations regarding the temperature environment of a growing bubble
While it is not possible to quantitatively determine the thermal environment in which bubble nucleation and growth take place in turbulent RBC, it is possible and instructive to arrive at the semi-quantitative picture presented in this subsection.
When
 $T_{b}>T_{on}$
bubbles are surrounded by liquid with a temperature greater than
 $T_{on}$
only within part of the thermal BL of thickness
 ${\it\lambda}_{T}$
above the bottom plate because the bulk temperature above the BL, which is close to
 $T_{cb}\simeq T_{cc}$
, was always below
 $T_{on}$
. For one-phase flow of classical RBC (see e.g. Ahlers et al.
Reference Ahlers, Grossmann and Lohse2009), where the temperature drop across each BL is equal to
 ${\rm\Delta}T/2$
, the BL thickness
 ${\it\lambda}_{T,0}$
is well represented by
 ${\it\lambda}_{T,0}=(L/\mathit{Nu})/2$
, which, for our parameter values, is equal to approximately 60
 ${\rm\mu}$
m. However, in our case the temperature drop across the bottom BL in one-phase flow is
 $T_{b}-T_{cc}\simeq 0.73{\rm\Delta}T$
, and similar arguments yield a bottom BL with thickness
 ${\it\lambda}_{T,b}\simeq 90~{\rm\mu}$
m and a thinner top BL with thickness
 ${\it\lambda}_{T,t}$
(see figure 7 for a schematic representation). It is likely that, given the composition of our bottom plates, some heat flows horizontally across the silicon wafer and outside
 $A_{h}$
(see § 3.3 for the relatively high thermal conductivity of silicon relative to that of the quiescent liquid) and that it enters the flow through a wider effective area than
 $A_{h}$
. In that case, we would expect
 $\mathit{Nu}$
to be smaller, as the effective area would be larger, and
 ${\it\lambda}_{T,b}$
to be larger. Thus
 ${\it\lambda}_{T,b}=90~{\rm\mu}$
m is likely to be a low estimate at the heated area
 $A_{h}$
of the bottom plate. Further, it is unknown how the growing vapour bubbles modify the one-phase BL. Nonetheless, we expect that the observed maximum bubble sizes (of the order of several hundred micrometres; see the end of § 4.1) are significantly larger than
 ${\it\lambda}_{T,b}$
and that only a part of the surface of a fully grown bubble is exposed to temperatures above
 $T_{on}$
. Even when bubbles are first formed, their size presumably is determined by the 30
 ${\rm\mu}$
m diameter of the cavities (see figure 3), and in the BL a significant temperature drop is expected to occur over such a distance.
A bubble can grow by removing heat from the bottom-plate (silicon-wafer) surface, and from the part of the liquid adjacent to it where the temperature is above
 $T_{on}$
. In the upper portion of and above the BL, the time-averaged liquid temperature is below
 $T_{on}$
(see figure 10
b, for instance), bubbles release heat into the liquid, and condense. While attached to the nucleation site, the growth exceeds or is equal to the condensation; after detachment as the bubble travels upwards through the bulk of the fluid there is only condensation until the bubble vanishes. For most parameter values the top plate is never reached, thus avoiding the formation of an extended vapour layer below it. Any dissolved air released into a bubble during the nucleation process then will also be recycled into the fluid and does not escape from the system.
4.2.2. Nusselt-number results
The Jakob number
 $\mathit{Ja}$
(2.3) is the ratio of the available thermal energy to the energy (‘latent heat’) necessary for the liquid vaporization to occur. Although its relevance to the present process is not straightforward since we argued that much of the heat of vaporization is extracted from the bottom plate and superheated liquid within only part of the BL, we think that it still provides a useful indication of the efficiency of the process at the bottom plate and allows for comparison with results from other researchers. Thus, in figure 8(a),
 $\mathit{Nu}$
is plotted as a function of
 $T_{b}$
(lower abscissa) and
 $\mathit{Ja}$
(upper abscissa), for both one-phase (solid symbols) and two-phase (open symbols) flow.
(a) The Nusselt number
 $\mathit{Nu}$
for one- and two-phase flow and (b) the
 $\mathit{Nu}$
difference
 $\mathit{Nu}_{2ph}-\mathit{Nu}_{1ph}$
between one- and two-phase flow as a function of the bottom-plate temperature
 $T_{b}$
and the Jakob number
 $\mathit{Ja}$
. In (a) solid points represent one-phase and open symbols two-phase flow. Data points with the same colour and symbol are for the same data set. Data from different cavity separations
 $l$
are indicated in (a). Besides the colour difference between runs, to distinguish between two data sets measured using the same wafer, the points are connected by a line (solid or dashed). The vertical solid line corresponds to
 $T_{b}=T_{on}$
. The vertical dashed lines correspond to
 $T_{on}\pm {\it\sigma}_{T_{on}}$
where
 ${\it\sigma}_{T_{on}}$
is the standard deviation of the
 $T_{on}$
measurements.

We note that for one-phase flow
 $\mathit{Nu}\simeq 700$
. This is much larger than the result for classical RBC at the relevant
 $\mathit{Ra}\simeq 1.8\times 10^{10}$
, which is
 $\mathit{Nu}\simeq 156$
(Ahlers & Xu Reference Ahlers and Xu2000; Stevens et al.
Reference Stevens, van der Poel, Grossmann and Lohse2013). The reason for this is that in (2.5) we used the area
 $A_{h}=5.07~\text{cm}^{2}$
to define
 $\mathit{Nu}$
, rather than the entire bottom-plate area
 $A=62.1~\text{cm}^{2}$
. If we had used
 $A$
, the result would have been
 $\mathit{Nu}\simeq 61$
, which is smaller than the classical result. One can argue that, at lowest order,
 $\mathit{Nu}$
is proportional to the inverse of a thermal resistance (given by the inverse of
 ${\it\lambda}_{eff}$
; see (2.5)), which in turn is the sum of two resistances, one corresponding to that of the top and the other to that of the bottom boundary layer (Ahlers et al.
Reference Ahlers, Brown, Fontenele Araujo, Funfschilling, Grossmann and Lohse2006), and that in our case
 $A$
should be used at the top and
 $A_{h}$
is relevant to the bottom. In addition, in (2.5) one has to consider that the temperature drop, normalized by
 ${\rm\Delta}T$
, across the bottom (top) BL is 0.73 (0.27); see figure 10(b). One then finds
 $\mathit{Nu}=189$
, which, considering the approximations involved in the lowest-order model that we used, can be regarded as consistent with the classical result.
The results in figure 8(a) are for the wafers listed in table 1 with different cavity spacings and cavity densities. Note that one- and two-phase data sets plotted using the same colour and the same symbol were measured using the same liquid, since the fluid remained inside the cell throughout both sets. Two two-phase sets each with
 $l=1$
mm and
 $l=0.19$
mm, three for
 $l=0.1$
mm and one for
 $l=0.6$
mm were measured. Before each of these, the cell had been emptied and refilled, and in going from one cavity spacing to another the cell had been taken apart and reassembled with a different bottom plate. The one-phase measurements showed reasonable reproducibility.
Data obtained with
 $l=2.0$
mm are excluded from figure 8 because
 $\mathit{Nu}_{2ph}$
was only a little larger than
 $\mathit{Nu}_{1ph}$
due to the fact that only very few sites were active. However, these data will be shown below in figure 9(b). As for all cavity spacings, some sites remained active as
 $T_{b}$
was reduced and some deactivated. Interestingly, for
 $l=2.0$
mm we noted that some inactive sites at a given
 $T_{b}$
activated again at a lower
 $T_{b}$
. This may be due to dissolved air coming out of solution and forming a new nucleating site or due to a detached bubble from a neighbouring site which anchored at a nearby inactive site, activating it.
All two-phase data sets show an enhancement of the heat transport relative to the one-phase data. In all cases the measurements are consistent with the same onset at
 $T_{on}=30.3\pm 1.1\,^{\circ }\text{C}$
. This temperature is lower than the saturation temperature of the pure liquid at the pressure prevailing in the sample, which is
 $T_{{\it\phi}}=38.5\,^{\circ }\text{C}$
. The one-phase Nusselt-number results increased with
 $T_{b}$
(or
 $\mathit{Ja}$
) since the thermal forcing, as expressed by the Rayleigh number
 $\mathit{Ra}$
, also became larger with increasing
 $T_{b}$
.
Each of the eight one-phase
 $\mathit{Nu}$
data sets were fitted over the range
 $26\,^{\circ }\text{C}<T_{b}<43\,^{\circ }\text{C}$
by a third-order polynomial and the fitted values were averaged. The standard deviation from this averaged function increased with
 $T_{b}$
; it varied from 3.5 % to 5.5 % of
 $\mathit{Nu}$
. Any small systematic differences between different sets presumably were due to differences of the dissolved-air concentration and to small variations in the bottom-plate assembly.
(a) The Nusselt-number difference
 ${\it\delta}\mathit{Nu}=\mathit{Nu}_{2ph}-\mathit{Nu}_{1ph}$
(open symbols as in figure 8
b) and the corresponding Nusselt-number difference per cavity
 ${\it\delta}\mathit{Nu}/N$
(with the same symbols and colours, but solid) on a logarithmic scale as a function of
 $T_{b}-T_{on}$
on a linear scale. (b) The Nusselt-number difference per active site
 ${\it\delta}\mathit{Nu}/N_{a}$
on a logarithmic scale as a function of
 $T_{b}-T_{on}$
on a linear scale. The vertical line indicates the value
 $T_{b}-T_{on}=9.9$
K. Symbols:
 $l=2.0$
mm (open and solid hexagonal stars), 1.0 mm (squares with and without horizontal line), 0.60 mm (diamonds), 0.60 mm with blocking ring (stars) and 0.19 mm (triangles). Inset:
 ${\it\delta}\mathit{Nu}/N_{a}$
at
 $T_{b}-T_{on}=9.9$
K as a function of the active cavity density
 $N_{a}/A_{h}$
on double logarithmic scales. The solid line is a power-law fit to the three points at largest
 $N_{a}/A_{h}$
, which yielded an exponent of
 $-0.80$
.

By taking the difference between
 $\mathit{Nu}_{2ph}$
and the value of the corresponding polynomial fit to
 $\mathit{Nu}_{1ph}$
, we obtained the heat-flux enhancement
 ${\it\delta}\mathit{Nu}\equiv \mathit{Nu}_{2ph}-\mathit{Nu}_{1ph}$
for each data set, as shown in figure 8(b). For all wafers the enhancement increased with
 $T_{b}$
or, equivalently, with
 $\mathit{Ja}$
. For instance, at
 $T_{b}\simeq 37\,^{\circ }\text{C}$
we found
 ${\it\delta}\mathit{Nu}\simeq 250$
, which is approximately 35 % of
 $\mathit{Nu}_{1ph}$
.
The data in figure 8 show that the heat-flux enhancement did not have a strong systematic dependence on the cavity density, even though this density varied by a factor of approximately 59 (see table 1). Similarly, in numerical work (Lakkaraju et al.
Reference Lakkaraju, Stevens, Oresta, Verzicco, Lohse and Prosperetti2013), changing the number of bubbles present in boiling Rayleigh–Bénard (RB) flow at
 $\mathit{Ra}=5\times 10^{9}$
by a factor of 15 did not increase the heat-flux enhancement proportionally but only increased it by a factor of approximately two. Lakkaraju et al. (Reference Lakkaraju, Stevens, Oresta, Verzicco, Lohse and Prosperetti2013) also reported that the relative effect of the vapour bubbles on the heat flux was a decreasing function of
 $\mathit{Ra}$
, where the smallest
 $\mathit{Ra}$
in their simulations was
 $2\times 10^{6}$
. Since our measurements were made at a constant
 ${\rm\Delta}T$
and thus an only slightly varying
 $\mathit{Ra}$
, we have no information on the
 $\mathit{Ra}$
dependence of
 ${\it\delta}\mathit{Nu}/\mathit{Nu}_{1ph}$
.
In figure 9(a) we show the data from figure 8(b) as open symbols on a logarithmic scale as a function of
 $T_{b}-T_{on}$
on a linear scale. Also shown, as solid symbols, are the same data divided by the corresponding total number
 $N$
of etched cavities. Note that for increasing
 $T_{b}-T_{on}$
an increasing number of sites turned inactive, at a rate that varied depending on the cavity separation. All solid-symbol curves for
 $l=0.10$
mm and
 $l=0.19$
mm fall on top of each other for most of the measured range. The two
 $l=1.0$
mm curves are very similar above
 $T_{b}-T_{on}>7$
K and deviate from each other for smaller superheat, probably due to the deactivation of more or fewer sites in each run as
 $T_{b}$
decreased or due to a slightly different dissolved-air content in the liquid. The heat-flux enhancement per cavity for
 $l=0.60$
mm was between those for
 $l=1.0$
mm and
 $l=0.10,0.19$
mm.
It is only at the largest superheat values for each cavity separation that all or nearly all etched cavities were equally active (except for
 $l=2.0$
mm) and it is under this condition that the number of active sites
 $N_{a}$
is equal or very close to the total cavity number
 $N$
. We chose heat-flux enhancement data points obtained for superheats
 $T_{b}-T_{on}>9.3$
K so that for wafers with
 $l=1.0,~0.60$
and 0.19 mm we had
 $N_{a}\simeq N$
. From images taken for each data point with
 $l=2.0$
, 1.0 or 0.60 mm we extracted
 $N_{a}$
from average intensity images (similar to figure 5) either by subtracting from
 $N$
the number of sites that were observed to be inactive, or by counting the total number of active sites directly. For
 $l=0.19$
mm we assumed that all sites were active, consistent with what was observed (see figure 5
a). In figure 9(b) the heat-flux enhancement per active site is plotted as a function of superheat. Table 2 contains the
 $N_{a}$
value corresponding to each data point, as well as the number of images considered and the total time over which these were acquired. For
 $T_{b}-T_{on}>9.3$
K the typical bubble departure frequency from the bottom plate was of the order of
 $10~\text{s}^{-1}$
. Therefore taking images of the active sites for 2 s or more was sufficient to capture each of the active sites. Note that the superheat range of data taken with
 $l=0.10$
mm did not reach such large values and the
 $l=0.10$
mm data are therefore not included in the plot; the reason is that the temperature drop across the bottom plate
 $T_{b}^{\star }-T_{b}$
with
 $l=0.10$
mm was larger (due to a larger heat flux) than for the other wafers; see § 3.3. For
 $l=2.0$
mm interference between bubbles from adjacent nucleating sites was weak or absent, and the corresponding normalized Nusselt enhancement
 ${\it\delta}\mathit{Nu}/N_{a}$
is essentially that of a single and isolated nucleating site under the influence of the turbulent convective flow. Also shown is one data set measured with
 $l=0.60$
mm with a ring around the etched area (stars), which is discussed in § 4.5.
Centre-to-centre spacing
 $l$
, the bottom-plate superheat
 $T_{b}-T_{on}$
, symbol used in figure 9(b), number of active sites
 $N_{a}$
, and the total number of images acquired over the acquisition time used to determine
 $N_{a}$
.

In order to study the dependence of
 ${\it\delta}\mathit{Nu}$
on the site density more quantitatively, we fixed the superheat at
 $T_{b}-T_{on}=9.9$
K (the vertical line in figure 9
b), and plotted the Nusselt-number difference per active site
 ${\it\delta}\mathit{Nu}/N_{a}$
as a function of active site density
 $N_{a}/A_{h}$
as shown in the inset of figure 9(b) on double logarithmic scales. The three data points for the largest
 $N_{a}/A_{h}$
were fitted by a power law, which yielded an exponent of
 $-0.80$
, showing that for decreasing active site density, or equivalently for increasing cavity separation, the contribution to the total heat-flux enhancement per active site becomes larger. The exponent implies that
 ${\it\delta}\mathit{Nu}\propto N_{a}^{0.20}$
. It is interesting to note that this result is consistent with the numerical work of (Lakkaraju et al.
Reference Lakkaraju, Stevens, Oresta, Verzicco, Lohse and Prosperetti2013). Those authors found that increasing the number of bubbles injected into the RB flow by a factor of 15 increased
 ${\it\delta}\mathit{Nu}$
only by a factor of two or so. Our result would imply a factor of
 $15^{0.20}\simeq 1.7$
.
The data point at the smallest
 $N_{a}/A_{h}$
shows that the heat-flux enhancement per active site eventually saturates for a small enough cavity density, as one would expect for a non-interacting active nucleating site. For the superheat of 9.9 K the data give a saturation value close to
 ${\it\delta}\mathit{Nu}/N_{a}\simeq 1.0$
.
(a) Temperature difference
 $T_{cc}-T_{cb}$
, normalized by
 ${\rm\Delta}T$
, as a function of
 $T_{b}-T_{on}$
, and (b) normalized temperature difference across the bottom 0.28 of the cell height. Symbols: solid symbols, one-phase data; open symbols, two-phase data; triangles,
 $l=0.19$
mm; diamonds,
 $l=0.60$
mm; squares,
 $l=1.0$
mm.

4.3. Temperature measurements
The thermistors inserted through the sidewall into the flow (see figure 1
b) measured local temperatures along the vertical axis (
 $x/D=0$
) at heights of
 $0.28L$
and
 $0.50L$
. These temperatures are denoted as ‘cb’ (centre-bottom) and ‘cc’ (centre-centre), respectively. The measurements for both wafers with
 $l=1.0$
mm and
 $l=0.60$
mm were sampled at a frequency of 0.25 Hz, and the data for
 $l=0.19$
mm at a frequency of 16 Hz. To acquire sufficiently good statistics, the measurements at 0.25 Hz were made over typically 24 h once a statistically stationary state was reached, which yielded of the order of
 $2\times 10^{4}$
points. The 16 Hz measurements were acquired over approximately 5 h, thus collecting
 $2\times 10^{5}$
data points. The data were used to compute time-averaged temperatures
 $T_{cc}$
and
 $T_{cb}$
and the temperature probability distribution functions.
4.3.1. Time-averaged temperatures
In figure 10(a) we show the normalized temperature difference
 $(T_{cc}-T_{cb})/{\rm\Delta}T$
in the bulk of the sample. For the one-phase case (solid symbols) this variation is seen to be quite small (approximately 0.03 % of
 ${\rm\Delta}T$
), as is the case also for the classical RBC geometry (Tilgner, Belmonte & Libchaber Reference Tilgner, Belmonte and Libchaber1993; Brown & Ahlers Reference Brown and Ahlers2007; Wei & Ahlers Reference Wei and Ahlers2014). As in classical RBC with
 $4.4\lesssim \mathit{Pr}\lesssim 12.3$
, the gradient was found to be stabilizing. The two-phase flow enhances the gradient, with the excess, due to the heat carried by the bubbles, varying approximately linearly with
 $T_{b}-T_{on}$
(see also § 4.4 below). However, the temperature difference remained quite small and generally was below 0.1 % of
 ${\rm\Delta}T$
.
In figure 10(b) the normalized vertical temperature difference
 $(T_{b}-T_{cb})/{\rm\Delta}T$
across the bottom part of the sample (up to
 $z/L=0.28$
) is shown as a function of
 $T_{b}-T_{on}$
for both one-phase and two-phase flow. It is approximately three orders of magnitude larger than the temperature variation in the bulk (see figure 10
a) because it includes the bottom boundary layer, which, although estimated to be thin (90
 ${\rm\mu}$
m to lowest order), sustains a major part of the applied temperature difference. For one-phase flow the mean temperature
 $T_{cc}$
at the sample centre was smaller than
 $T_{m}$
, as opposed to classical RBC where (in the Oberbeck–Boussinesq approximation (Oberbeck Reference Oberbeck1879; Boussinesq Reference Boussinesq1903)) the centre of the sample is at
 $T_{m}$
. For our one-phase experiment
 $(T_{m}-T_{cc})/{\rm\Delta}T\simeq 0.24$
. Since the temperature difference across the bulk was small, almost all of the shift of
 $T_{cc}$
relative to
 $T_{m}$
was due to different temperature drops across the boundary layers near the top and bottom plates. The shift is, of course, almost entirely a consequence of the difference between the area over which the heat current could enter the sample at the bottom and that over which it could leave it at the top. The result also implies that in one-phase flow both
 $T_{cc}$
and
 $T_{cb}$
remained on average below
 $T_{on}$
over the entire range of
 $T_{b}$
.
Normalized standard deviations from the mean of the temperatures on the sample centreline at different heights (see labels) as a function of
 $T_{b}-T_{on}$
: (a)
 ${\it\sigma}_{cb}$
,
 $z/L=0.28$
and (b)
 ${\it\sigma}_{cc}$
,
 $z/L=0.5$
. Symbols as in figure 10.
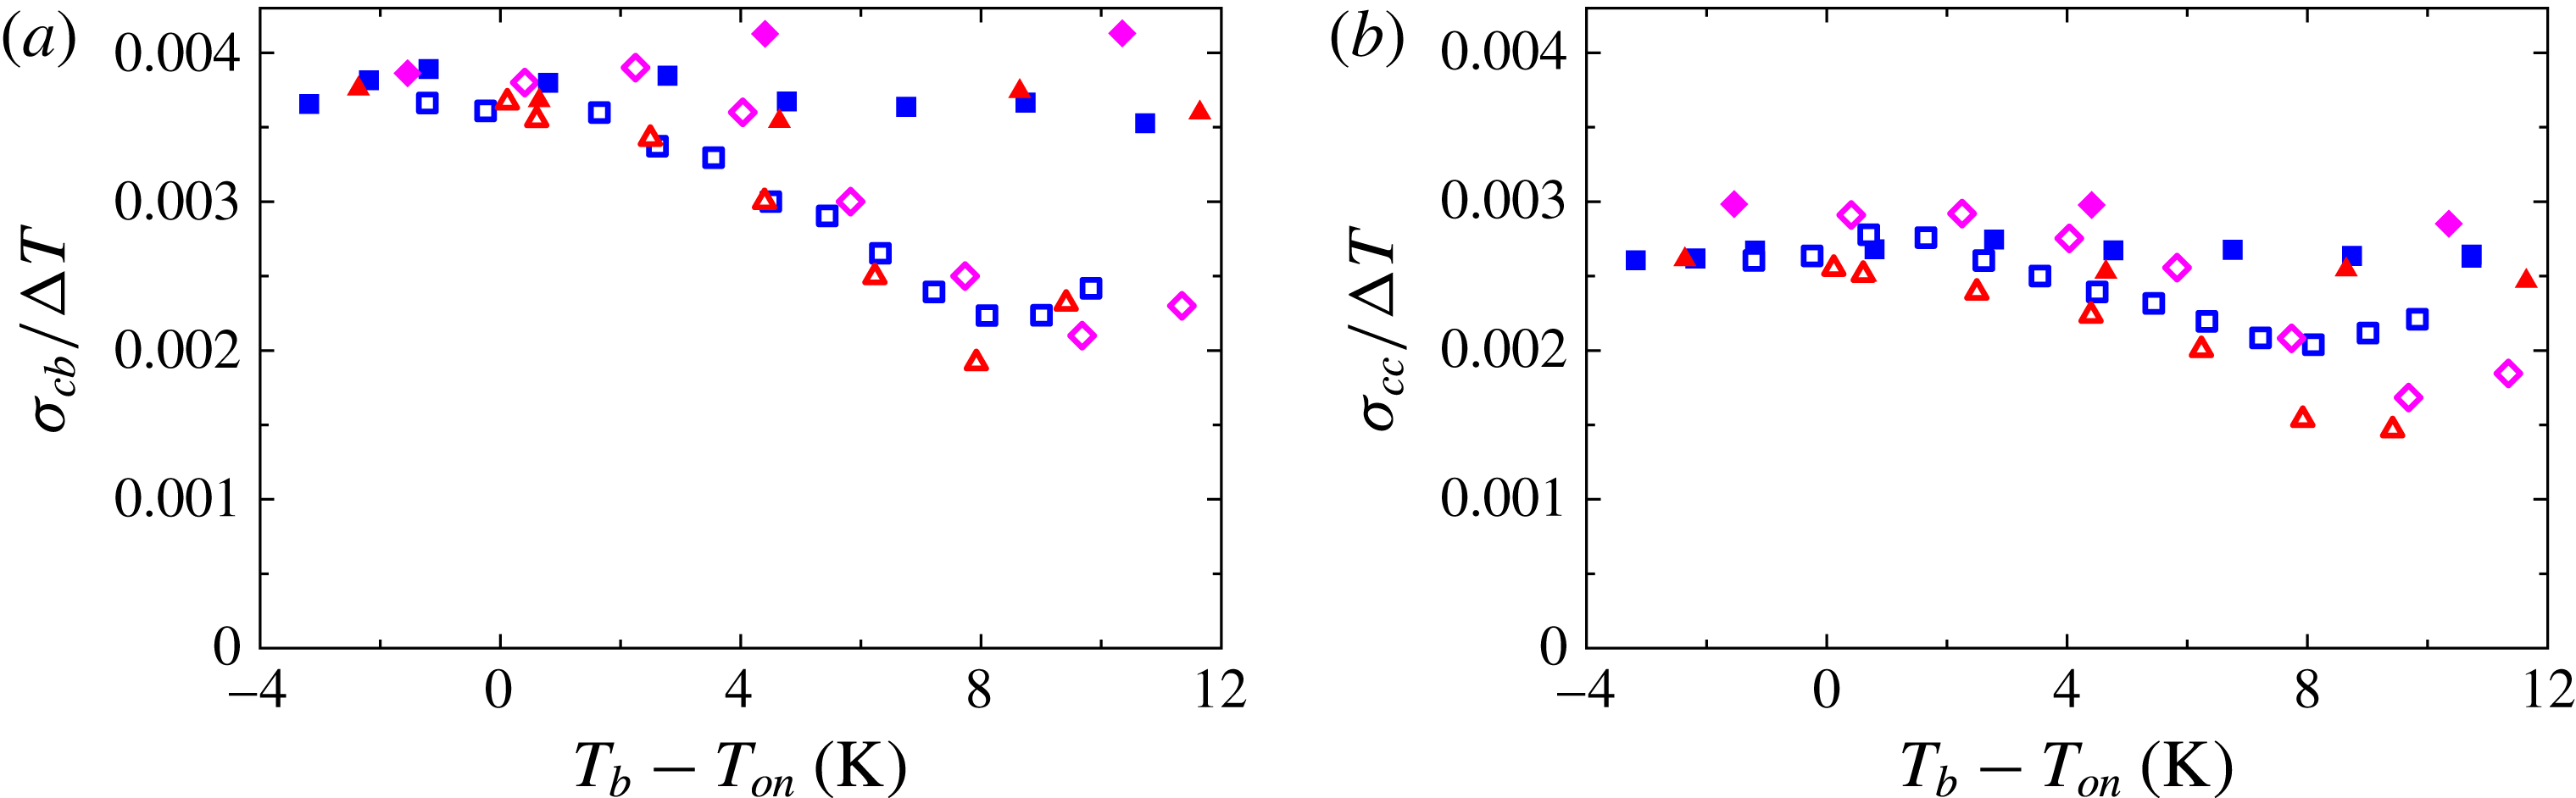
From figure 10(b) it is apparent that vapour bubbles increased the local mean temperature in the bulk of the sample or, equivalently, reduced
 $(T_{b}-T_{cb})/{\rm\Delta}T$
. From the small values of
 $(T_{cc}-T_{cb})/{\rm\Delta}T$
shown in figure 10(a), as well as from the data shown in figure 10(b), one sees that this increase was nearly the same at the two vertical positions in the bulk. Thus, the increase occurred primarily in or near the boundary layer above the bottom plate. We note that the mean temperatures in the two-phase flow at
 $z/L=0.50$
and
 $z/L=0.28$
were above
 $T_{on}$
only for the largest
 $T_{b}-T_{on}\simeq 11.35$
K, and then only by approximately 0.3 K.
4.3.2. Standard deviations of temperatures
The standard deviations (2.6) of the local temperatures from their mean at
 $z=0.28L$
and
 $0.50L$
, normalized by
 ${\rm\Delta}T$
, are plotted as a function of
 $T_{b}-T_{on}$
in figure 11(a) and (b), respectively. Over the entire range of
 $T_{b}-T_{on}$
the standard deviations for the one-phase flows were larger at
 $z=0.28L$
than they were at mid-height. At both locations the standard deviation was reduced by the presence of vapour bubbles. Although this reduction was not very large at
 $z/L=0.5$
, at
 $z/L=0.28$
it reached almost a factor of two for the largest
 $T_{b}-T_{on}$
.
Comparison of the data in figure 11(a,b) with those for
 $(T_{cc}-T_{cb})/{\rm\Delta}T$
in figure 10(a) shows that the standard deviations were larger than the differences between the mean temperatures at
 $0.50L$
and
 $0.28L$
. By comparing figures 11(a) and 10(b), one sees that the normalized temperature difference across the bottom
 $0.28$
of the cell height and the normalized temperature standard deviation at
 $z/L=0.28$
had similar dependences on
 $T_{b}-T_{on}$
for both one-phase and two-phase flow, even though they differ in size by over two orders of magnitude.
According to Lakkaraju et al. (Reference Lakkaraju, Schmidt, Oresta, Toschi, Verzicco, Lohse and Prosperetti2011, Reference Lakkaraju, Toschi and Lohse2014), bubbles have a two-fold effect on the flow fluctuations. On the one hand, due to their fixed surface temperature, bubbles tend to smooth the liquid temperature differences by absorbing or releasing heat, thus leading to less intermittency in the thermal fluctuations (Lakkaraju et al.
Reference Lakkaraju, Toschi and Lohse2014). On the other hand, due to their buoyancy, moving bubbles agitate the flow, thereby enhancing mixing of the thermal field, and add vertical momentum to it. The thermal feedback provided by the bubbles explains the observed temperature standard deviation reduction as
 $T_{b}-T_{on}$
increased up to approximately 8 K. For even larger superheats the reduction remained approximately constant.
4.3.3. Temperature probability distributions
Probability density functions
 $p$
of
 $(T_{cb}(t_{i})-T_{cb})/{\it\sigma}_{cb}$
for time series of two-phase flow (where
 $T_{cb}(t_{i})$
is the instantaneous value of the time series at time
 $t_{i}$
) measured at
 $z/L=0.28$
for superheats
 $T_{b}-T_{on}$
and cavity separations
 $l$
as shown in the labels. The vertical dotted lines are located at
 $(T_{cb}(t_{i})-T_{cb})/{\it\sigma}_{cb}=0$
.

In classical RBC one expects on the basis of symmetry arguments and indeed finds from experiment (see e.g. Belmonte, Tilgner & Libchaber Reference Belmonte, Tilgner and Libchaber1995) that the skewness
 $S$
(see (2.7)) vanishes at the sample centre. It is known to be positive along the centreline closer to the bottom plate. This positive skewness is attributed to the effect of hot plumes emitted by the bottom-plate boundary layer, which influence the bottom portion of the sample but then travel mostly close to the sidewall where they rise towards the top while cold plumes descend near the wall on the opposite side.
Our sample was not symmetric about the horizontal mid-plane and there was no reason for
 $S$
to vanish at the sample centre. Indeed, the time series for both
 $T_{cc}$
and
 $T_{cb}$
of one-phase flow, and of two-phase flow with modest
 $T_{b}-T_{on}$
, had probability distributions with positive skewness. However, for two-phase flow
 $S$
became smaller and eventually negative at large
 $T_{b}-T_{on}$
. Examples of distributions at
 $z/L=0.28$
with different
 $T_{b}-T_{on}$
are shown in figure 12. In each panel two data sets at similar superheat values are shown. They were taken at different acquisition rates (see § 4.3) using wafers with different cavity spacings. One sees that the cavity spacing and acquisition rate had no significant influence, except that the distributions for
 $l=0.19$
mm have longer tails due to the larger number of points in the time series.
The skewness
 $S$
of the probability distributions of temperature time series measured at the locations ‘cb’ (
 $z/L=0.28$
) and ‘cc’ (
 $z/L=0.50$
) as a function of the bottom-plate superheat
 $T_{b}-T_{on}$
of (a) one-phase flow and (b) two-phase flow. Squares, diamonds and upward-pointing triangles: ‘cb’. Circles, stars and downward-pointing triangles: ‘cc’. Stars and diamonds:
 $l=0.60$
mm. Squares and circles:
 $l=1.0$
mm. Upward- and downward-pointing triangles:
 $l=0.19$
mm. Straight-line fits to one-phase ‘cb’ (dashed line) and ‘cc’ (solid line) data for the three
 $l$
are shown in both panels.

In figure 13(a,b) we show
 $S$
as a function of
 $T_{b}-T_{on}$
for one-phase and two-phase flow, respectively. For one-phase flow and two-phase flow with modest superheat, up to
 $T_{b}-T_{on}\lesssim 6$
K, the results are very similar. Along the sample centreline,
 $2\lesssim S\lesssim 4$
and is only weakly dependent on
 $T_{b}-T_{on}$
. The reason for the relatively large value of
 $S$
was, we believe, that the plumes emitted from the more localized heat source in our geometry tended to travel more nearly vertically and thus influenced the temperature distribution even at the geometric centre of the sample. We note that
 $S$
measured at
 $z/L=0.50$
was smaller than at
 $z/L=0.28$
, as one would expect if the plumes disperse laterally as they travel upwards. For each height,
 $S$
was fitted as a function of
 $T_{b}-T_{on}$
by straight lines, as shown in figure 13 by solid and dashed curves.
As
 $T_{b}-T_{on}$
increased beyond approximately 6 K for two-phase flow,
 $S$
decreased, and at the largest
 $T_{b}-T_{on}$
became negative. The decrease of
 $S$
(measured relative to
 $S$
of one-phase flow) was larger closer to the heated surface where bubbles were bigger. One sees that the thermal capacity of the bubbles homogenized the temperature field in the bulk, thereby reducing the temperature gradients associated with plumes. It is somewhat surprising that for all data sets the decrease of
 $S$
began relatively suddenly as
 $T_{b}-T_{on}$
exceeded approximately 6 or 8 K, with no noticeable effect for smaller
 $T_{b}-T_{on}$
. This phenomenon warrants further investigations.
(a) The normalized differences
 ${\it\delta}T_{cc}/{\rm\Delta}T$
(solid symbols) and
 ${\it\delta}T_{cb}/{\rm\Delta}T$
(open symbols) between two-phase and one-phase flow of
 $(T_{b}-T_{cc})/{\rm\Delta}T$
and
 $(T_{b}-T_{cb})/{\rm\Delta}T$
as a function of
 $T_{b}-T_{on}$
. The results for ‘cb’ and ‘cc’ are nearly identical. Symbols (open and solid) for different cavity spacings
 $l$
are as in (b). (b) The normalized difference
 ${\it\delta}T_{cb}/{\rm\Delta}T$
as a function of the Nusselt-number difference between two-phase and one-phase flow. The straight line is a fit (forced through the origin) to
 $\mathit{Nu}_{2ph}-\mathit{Nu}_{1ph}\lesssim 190$
data for
 $l=1.0$
mm.

4.4. Correlated quantities
In this section we show how the heat-flux difference between one- and two-phase flows (see figure 8 b) was correlated with locally measured quantities.
The normalized local temperature increase
 $$\begin{eqnarray}\displaystyle {\it\delta}T_{cc}/{\rm\Delta}T\equiv ((T_{b}-T_{cc})/{\rm\Delta}T)_{2ph}-((T_{b}-T_{cc})/{\rm\Delta}T)_{1ph}, & & \displaystyle\end{eqnarray}$$
due to bubble nucleation at the vertical location ‘cc’, and the similarly defined
 ${\it\delta}T_{cb}$
for ‘cb’ (see figure 10
b), were determined by fitting straight lines to each of the one-phase data sets and obtaining the differences between the corresponding two-phase measurements and these fits. Note that
 ${\rm\Delta}T$
did not have exactly the same value in one- and two-phase flows due to temperature corrections (see § 3.3). In figure 14(a),
 ${\it\delta}T_{cc}/{\rm\Delta}T$
and
 ${\it\delta}T_{cb}/{\rm\Delta}T$
are both plotted as a function of
 $T_{b}-T_{on}$
. One sees that they are nearly indistinguishable from each other. The results obtained for the three different cavity separations were close to each other except for
 $T_{b}-T_{on}\gtrsim 8$
K, when the
 $l=0.60$
and 1.0 mm data sets reversed their trends but the 0.19 mm data set kept a decreasing
 ${\it\delta}T_{cc}/{\rm\Delta}T$
trend.
In figure 14(b) the normalized temperature difference between two- and one-phase flows at
 $z/L=0.28$
is shown as a function of the heat-flux enhancement. One sees that these two quantities were correlated. In view of the results shown in figure 14(a), the same relationship was found also for
 $z/L=0.5$
. In the
 ${\it\delta}T_{cc}/{\rm\Delta}T$
range between 0 and approximately
 $-0.05$
(or equivalently
 $T_{b}-T_{on}\leqslant 8$
K) and
 ${\it\delta}\mathit{Nu}\lesssim 190$
, the data are consistent with a straight line passing through the origin. Separate fits to the data for
 $l=1.0$
mm,
 $l=0.60$
mm and
 $l=0.19$
mm gave slopes of
 $-(2.34\pm 0.02)\times 10^{-4}$
,
 $-(2.39\pm 0.03)\times 10^{-4}$
and
 $-(2.52\pm 0.01)\times 10^{-4}$
, respectively. For
 ${\it\delta}\mathit{Nu}\gtrsim 190$
,
 ${\it\delta}T_{cc}/{\rm\Delta}T$
reversed its trend for
 $l=1.0$
mm and
 $l=0.60$
mm. It decreased further for
 $l=0.19$
mm, albeit not with the same linear dependence as for
 ${\it\delta}\mathit{Nu}\lesssim 190$
. For this case of largest
 ${\it\delta}T_{cc}/{\rm\Delta}T$
, also the largest value of
 ${\it\delta}\mathit{Nu}$
was reached.
In the presence of bubbles, the normalized bulk temperature difference between
 $z/L=0.5$
and
 $z/L=0.28$
(see figure 10
a), although quite small, increased with increasing
 $T_{b}-T_{on}$
. To quantify the effect of the bubbles on the bulk temperature, a straight line was fitted to each one-phase data set, and that straight line was subtracted from the corresponding two-phase difference. This yielded
 $$\begin{eqnarray}\displaystyle ({\it\delta}T_{2ph}-{\it\delta}T_{1ph})/{\rm\Delta}T\equiv [(T_{cc}-T_{cb})/{\rm\Delta}T]_{2ph}-[(T_{cc}-T_{cb})/{\rm\Delta}T]_{1ph}, & & \displaystyle\end{eqnarray}$$
and is plotted in figure 15(a) as a function of
 $T_{b}-T_{on}$
. The data point at the largest superheat measured for the
 $l=0.19$
mm wafer showed a
 $({\it\delta}T_{2ph}-{\it\delta}T_{1ph})/{\rm\Delta}T$
value nearly twice as large as those measured for the other two wafers at nearly the same
 $T_{b}-T_{on}$
value. Figure 15(b) shows the normalized bulk temperature difference between one- and two-phase flow as a function of the heat-flux enhancement. The small stabilizing thermal gradient in the bulk became larger with increasing
 $T_{b}-T_{on}$
in the presence of vapour bubbles and was positively correlated with the heat-flux enhancement. Note that the largest value of
 $({\it\delta}T_{2ph}-{\it\delta}T_{1ph})/{\rm\Delta}T$
also corresponded to the largest
 ${\it\delta}\mathit{Nu}$
.
(a) The normalized change
 $({\it\delta}T_{2ph}-{\it\delta}T_{1ph})/{\rm\Delta}T$
of the temperature difference between the two locations
 $z/L=0.50$
and
 $z/L=0.28$
due to the bubbles in two-phase flow (see (4.2)). (b) The normalized change
 $({\it\delta}T_{2ph}-{\it\delta}T_{1ph})/{\rm\Delta}T$
as a function of the Nusselt-number difference between two-phase and one-phase flow. The cavity spacing
 $l$
is indicated.

(a) The changes
 ${\it\delta}{\it\sigma}_{cb}/{\rm\Delta}T$
and
 ${\it\delta}{\it\sigma}_{cc}/{\rm\Delta}T$
of the normalized standard deviations due to the bubbles of two-phase flow at
 $z/L=0.28$
and at
 $z/L=0.50$
as a function of
 $T_{b}-T_{on}$
. (b) The same changes as a function of the Nusselt-number difference between two-phase and one-phase flow. Open symbols stand for ‘cb’ and solid symbols designate ‘cc’ measurements, taken with a cavity spacing
 $l=0.19$
mm (triangles),
 $l=0.60$
mm (diamonds) and
 $l=1.0$
mm (squares).

The normalized standard deviations of the temperatures measured at both vertical positions (see figure 11) were larger for one-phase flow than that for two-phase flow, and that difference was larger at
 $z/L=0.28$
than at
 $z/L=0.50$
. We fitted the one-phase data sets at each height with straight lines and subtracted the fits from the corresponding two-phase values to get
 $$\begin{eqnarray}\displaystyle {\it\delta}{\it\sigma}_{cc}/{\rm\Delta}T\equiv ({\it\sigma}_{cc}/{\rm\Delta}T)_{2ph}-({\it\sigma}_{cc}/{\rm\Delta}T)_{1ph}, & & \displaystyle\end{eqnarray}$$
and similarly we defined and determined
 ${\it\delta}{\it\sigma}_{cb}/{\rm\Delta}T$
. The results are plotted as a function of
 $T_{b}-T_{on}$
in figure 16(a). For
 $T_{b}-T_{on}\lesssim 8$
K the change due to the vapour bubbles increased with increasing
 $T_{b}-T_{on}$
at both heights. For superheats larger than 8 K,
 ${\it\delta}{\it\sigma}_{cb}/{\rm\Delta}T$
increased slightly at
 $z/L=0.28$
for all
 $l$
and at
 $z/L=0.50$
only for
 $l=1.0$
mm.
The dependence on the heat-flux enhancement is plotted in figure 16(b). Up to
 ${\it\delta}\mathit{Nu}\simeq 200$
a larger heat-flux enhancement was correlated with a larger decrease of the temperature fluctuations due to the vapour bubbles. For larger
 ${\it\delta}\mathit{Nu}$
the slope of the correlation between these quantities changed sign.
4.5. Large-scale circulation effect
From images of boiling above the bottom plate it was found that, after detaching from the surface, most of the bubbles moved rapidly in nearly the same horizontal direction (see the movies in the supplementary material). The horizontal displacement found for
 $l=1.0$
and 0.60 mm was approximately 2 cm before the bubbles were out of focus due to their vertical motion. The horizontal motion is attributable to the LSC. In order to test whether the bubble growth and heat-flux enhancement were affected significantly by the LSC, a 1.12 cm tall polycarbonate ring (inner diameter of 3.81 cm and wall thickness of 0.64 cm) was positioned with its axis coincident with the sample axis and glued to the
 $l=$
0.60 mm wafer; see figure 17(b). In figure 17(a) the Nusselt-number enhancements are shown with and without the blocking ring as stars and open diamonds, respectively. The value of
 $T_{b}$
at which
 $\mathit{Nu}_{2ph}-\mathit{Nu}_{1ph}$
reached zero with the ring was larger than it was without the ring by approximately 2 K. This difference suggests that the dissolved-air concentration in the two cases was slightly different, being larger in the case without the ring.
(a) The Nusselt-number enhancement due to vapour bubbles nucleating on an
 $l=0.60$
mm wafer as a function of
 $T_{b}-T_{on}$
in the presence and absence of a ring around the etched area of the wafer blocking the large-scale circulation, as illustrated in (b) by the thick, short lines emanating from the bottom plate.

Taking into account the effects that a larger air concentration in the liquid had on the system and that the data set with the ring had a higher superheat value at which all sites became inactive as well as a larger
 ${\it\delta}\mathit{Nu}$
for
 $T_{b}-T_{on}>6$
K as shown in figure 17(a), we suggest that the bubble nucleation and growth processes were influenced by the LSC (which is assumed to be absent in the presence of the blocking ring). By considering
 ${\it\delta}\mathit{Nu}/N_{a}$
(see figure 9
b) with and without the ring we confirmed that there was an increase in the heat-flux enhancement per active site due to the presence of the ring.
(a) The Nusselt-number enhancement due to bubble nucleation in the absence and presence of a partially thermally insulating
 $0.97L$
tall tube around the etched area of the
 $l=0.19$
mm wafer, as illustrated in (b) by the thick, long lines emanating from the bottom plate.

4.6. Effect of thermally isolating a heated-liquid column
As discussed in § 4.3.1, a consequence of having a reduced heating area at the bottom plate was that the temperature drop across the bottom BL was larger than that across the top BL. This asymmetry led to a reduction of the temperature at the sample centre below the mean temperature
 $T_{m}$
(see figures 7 and 10
b), which is expected in classic RBC in the Boussinesq approximation. Rising bubbles that encounter warmer liquid on their way to the top plate would experience delayed condensation. Delayed bubble condensation would increase the effective flow buoyancy and therefore increase the heat-flux enhancement.
We investigated the effect of thermally and physically isolating the liquid column above the heated area from the liquid outside it by gluing a 0.32 cm thick polycarbonate tube (inner diameter of 2.86 cm and height of 8.5 cm; see figure 18
b) to the silicon wafer with epoxy. The tube was shorter than the cell by 0.3 cm, thus leaving a gap below the top plate. We performed the same experiments as for the case without the tube. Each panel of figure 19 shows the average intensity of 40 images (taken within 56 s) of the etched area. In all images part of the tube can be seen in the bottom right corner. As the superheat decreased, an increasing number of sites became inactive. This process started mostly at the outer rim of
 $A_{h}$
, but also some sites in the interior of the etched area stopped nucleating bubbles. Larger and longer-lasting bubbles, identified as very bright spots, appeared within the etched area. They first formed at the periphery (figure 19
b) but, as superheat was further reduced, they only formed in the interior (figure 19
c,d).
This particular
 $l=0.19$
mm wafer did not show the inner ring of deactivated sites inside the active area that was observed for
 $T_{b}-T_{on}=6.9$
K in figure 5.
Average intensity images of nucleating sites on a
 $l=0.19$
mm wafer at different superheat values (see labels): (a) 6.7 K, (b) 5.0 K, (c) 3.1 K, (d) 2.2 K, (e) 1.3 K, (f) 0.4 K. All images cover the same area and show part of the isolating tube at their bottom right corner. In (a) the bright circle corresponds to the heated/etched area
 $A_{h}$
with 2.5 cm diameter. Nearly all 15 460 sites were active. In (b–d) a few larger bubbles (very bright dots) appeared. Starting at (c) sites at the rim of
 $A_{h}$
deactivated and (d–f) this process continued as superheat was further decreased.

In figure 18(a) two sets of
 ${\it\delta}\mathit{Nu}$
are plotted as a function of
 $T_{b}-T_{on}$
. One set was measured with the insulating tube and is compared with one of the data sets presented in previous sections without the tube. The data sets show very similar
 $T_{b}-T_{on}$
values at which a few sites were still active before complete deactivation took place at the next lower superheat. This indicates that the dissolved-air concentration in these sets was very similar and that any difference in the heat-flux enhancement between them was due not to a different air content but rather to a different mechanism responsible for the larger heat transport from bottom to top. A strict comparison between these data sets is only possible for
 $T_{b}-T_{on}>7$
K, since the ring of inactive sites developed for
 $T_{b}-T_{on}<7$
K in the data set without the isolating tube. For
 $7~\text{K}\lesssim T_{b}-T_{on}\lesssim 10$
K the difference between the two sets increased as
 $T_{b}-T_{on}$
became larger and reached approximately 160 at the largest superheat where
 ${\it\delta}\mathit{Nu}\simeq 500$
with the tube and
 ${\it\delta}\mathit{Nu}\simeq 340$
without it.
5. Summary and conclusions
In this paper we reported on turbulent convection in an aspect ratio
 ${\it\Gamma}=1.00$
RB cell with and without vapour-bubble nucleation at a locally heated area of the bottom plate. Cylindrical cavities of 30
 ${\rm\mu}$
m diameter and 100
 ${\rm\mu}$
m depth and arranged on a triangular lattice, when filled with vapour, served as nucleating sites fixed in space, allowing for well-controlled boiling conditions. The working liquid (Novec7000) wetted the wafer surface well and, when it filled the cavities, the nucleating sites turned inactive and did not reactivate. Thus direct comparison of one- and two-phase turbulent convective flows under the same thermal forcing was possible. The temperature difference across the sample was kept fixed at approximately 16 K while the bottom-plate temperature varied. The Rayleigh number (defined for one-phase flow) ranged from
 $1.4\times 10^{10}$
to
 $2.0\times 10^{10}$
as the mean sample temperature changed.
We observed nucleating bubbles for
 $T_{b}>T_{on}\simeq 30.3$
K. Bubbles nucleating on wafers with a smaller cavity separation
 $l$
were less susceptible to deactivation at a given superheat value
 $T_{b}-T_{on}$
. The extreme case was found for
 $l=2.0$
mm where, even for superheats larger than usual, only a few cavities randomly located (less than one-third of the total number) stayed active, making the interaction with neighbouring active sites negligible. The other extreme cases were cavity separations
 $l=0.1$
and 0.19 mm, for which neighbour nucleating bubbles did not grow much before interacting with their neighbours. Typically, this led to merging of several growing bubbles. The large density of the growing bubbles and/or their stronger thermal interactions led to the deactivation of a smaller fraction of cavities. For all wafers an increasing number of cavities deactivated as the superheat values became smaller. For the wafers with cavity separation large enough to optically identify single bubbles (
 $l=0.60$
, 1.0 and 2.0 mm), we observed that bubbles grew less before departure and the average departure frequency diminished as the superheat values became smaller, which is in accord with the decrease of the global heat flux as the superheat was reduced.
We measured the total heat-flux enhancement, defined as the difference between the Nusselt number of the two-phase and the one-phase flows. We found that
 $\mathit{Nu}_{2ph}-\mathit{Nu}_{1ph}$
depended only weakly on the cavity spacing
 $l$
. The cavity density, and thus their number, varied by a factor of 59 between the second smallest (
 $l=1.0$
mm) and the largest density (
 $l=0.1$
mm). However, smaller cavity densities implied fewer nucleation sites but bigger bubbles, while larger densities meant more sites nucleating smaller bubbles. We conclude that the influence of the bubble number and size on the heat flux nearly cancelled.
The heat-flux enhancement increased with superheat (which can also be expressed in terms of the Jakob number
 $\mathit{Ja}$
), reaching values up to 50 %. The time-averaged heat-flux enhancement per active site
 ${\it\delta}\mathit{Nu}/N_{a}$
(measured at the higher superheats for which all or most of the sites were equally active) increased with decreasing cavity density until it saturated at
 ${\it\delta}\mathit{Nu}/N_{a}\simeq 1.0$
for very low density (large separation
 $l$
). For the higher densities the data could be represented by the power law
 ${\it\delta}\mathit{Nu}/N_{a}\propto (N_{a}/A_{h})^{-0.80}$
. This result implies that
 ${\it\delta}\mathit{Nu}\propto N_{a}^{0.20}$
, which is consistent with the numerical work of Lakkaraju et al. (Reference Lakkaraju, Stevens, Oresta, Verzicco, Lohse and Prosperetti2013), who found that increasing the number of bubbles injected into the RB flow by a factor of 15 increased
 ${\it\delta}\mathit{Nu}$
only by a factor of two or so. Our result would imply a factor of
 $15^{0.20}\simeq 1.7$
.
Bubbles interacted with the large-scale circulation (LSC) once they had detached from the hot surface and were dragged horizontally as they also rose due to their buoyancy. This was documented by high-speed movies. By blocking the LSC passage across the nucleating area with a ring around it, the heat-flux enhancement was found to be somewhat larger than measured without a blocking ring. This indicated that the bulk-liquid flow velocity affected the bubble growth at and the detachment from the surface, which led to a reduction of the heat-flux enhancement.
Measurements of the local temperature along the centreline of the sample at two different heights
 $z/L=0.50$
and
 $z/L=0.28$
showed a stabilizing gradient in one-phase flow that did not depend on superheat. This normalized gradient was enhanced in the two-phase flow and was found to be an increasing function of superheat. As a consequence of the modified RB geometry in our experiments, the bottom portion of the cell, up to
 $z/L=0.28$
, sustained a major part of the temperature difference across the sample. This temperature difference was reduced in the presence of vapour bubbles. The bubbles homogenized the temperature field in the bulk due to their large heat capacity. This was reflected in a decrease of the temperature deviations from the mean (especially closer to the bottom plate) and in the reduction of the positive skewness obtained from the one-phase temperature distributions. This effect was more significant closer to the bottom plate than at mid-height, which was a consequence of the eventual disappearance of the bubbles as they reached higher levels. The vapour-bubble modifications of the mean local temperatures and the temperature standard deviations were found to correlate with the net heat-flux enhancement.
By thermally insulating the liquid column above the heated area with a low-thermal-conductivity tube, we found an even larger heat-flux enhancement. We attribute the increase to bubbles encountering warmer liquid as they rose, thus delaying their condensation and increasing the effective buoyancy of the flow.
Acknowledgements
This work was supported by an ERC-Advanced grant, and by the US National Science Foundation through grant DMR11-58514. The authors would like to thank P. Wei for assembling the thermistors inserted into the flow and for insightful discussions.
Supplementary movies
Supplementary movies are available at http://dx.doi.org/10.1017/jfm.2015.701.
Appendix A. Epoxy layer thickness measurement
Two of the several assembled bottom plates used in this study were glued using degassed epoxy. The method yielded an epoxy layer thickness that was not reproducible. Without exactly knowing the epoxy layer thickness
 $L_{e}$
, the actual liquid–wafer interface temperature
 $T_{b}$
, and thus the Nusselt number, could not be determined precisely.
Sketch of the experimental configuration (vertical dimensions not to scale) for measuring the epoxy layer thickness that glued the silicon wafer to the copper piece with the plastic ring.

Direct measurements of
 $L_{e}$
were not precise enough. Thus we measured
 $L_{e}$
indirectly. We placed a copper cylinder with a thermistor embedded in it (acquiring temperature
 $T_{c}$
) on top of the silicon wafer glued to the other parts, as shown in figure 20. The copper cylinder had the same diameter as
 $A_{h}$
and its proper alignment with the heated area was secured by using a second plastic ring with the same dimensions as the one of the bottom plate. Clamps forced both the plastic rings and the two copper pieces together, assuring good thermal contact between the silicon wafer and the copper cylinder. This configuration was isolated from room-temperature variations and possible convection of surrounding air by adding several layers of thick foam around it (not shown here).
The bottom-plate temperature
 $T_{b}^{\star }$
was controlled by the same digital feedback loop as in the one- and two-phase experiments. In order to achieve a significant heat per unit time
 $Q$
,
 $T_{b}^{\star }$
was set to
 $35\,^{\circ }\text{C}$
while the top cooled to the ambient air. The temperature difference between thermistors
 $T_{b}^{\star }-T_{c}$
was measured. The thermal resistivities
 $R$
of all layers were defined in terms of
 $A_{h}$
, assuming the heat flowed only across that area. The temperature drop measured is expressed in terms of
 $R$
of each layer:
 $$\begin{eqnarray}\displaystyle T_{b}^{\star }-T_{c}=Q(R_{b}+R_{e}+R_{w}+R_{c}), & & \displaystyle\end{eqnarray}$$
where
 $R_{b}$
,
 $R_{e}$
,
 $R_{w}$
and
 $R_{c}$
correspond respectively to the copper piece part of the bottom plate, the epoxy layer, the silicon wafer and the copper cylinder where
 $T_{c}$
was measured. Similarly as explained in § 3.3,
 $R_{w}$
depended on the number
 $N$
of cavities, in this case filled with air. The silicon wafer net thermal resistivity
 $R_{w}$
was obtained by considering the thermal resistivity of the air contained in
 $N$
cavities,
 $R_{a}=L_{c}/(NA_{c}{\it\lambda}_{a})$
, where
 ${\it\lambda}_{a}$
is the thermal conductivity of air;
 $R_{w}$
was assumed to be parallel to the fraction of
 $A_{h}$
occupied by silicon
 $R_{s}$
over the cavities depth
 $L_{c}$
; the thermal resistance over the length of the wafer
 $L_{s}-L_{c}$
over which no cavities were etched
 $R_{s}^{\prime }$
was considered to be in series with both
 $R_{a}$
and
 $R_{s}$
. This gave
 $R_{w}=(1/R_{a}+1/R_{s})^{-1}+R_{s}^{\prime }$
. No convection took place inside the cavities filled with air. Finally, the epoxy layer thickness was computed by substituting
 $R_{e}=L_{e}/({\it\lambda}_{e}A_{h})$
into (A 1). This method was tested and found to work very well by using a bottom plate assembled with PSA, where it yielded an accurate value for the known PSA layer thickness.
Appendix B. Spectral measurements
The measurements of the temperature distribution functions require that the thermistors have a fast enough time response and spatial resolution. To check whether this is the case for the 0.36 mm thermistors used by us, we compared the normalized power spectrum
 $P(f)$
measured for one-phase flow with the power spectra obtained by He et al. (Reference He, van Gils, Bodenschatz and Ahlers2014) for the same type of thermistor, and for a bigger and a smaller one with diameters of 1.13 and 0.18 mm. In figure 21
 $P(f)$
is plotted for the three thermistors used in their work and for the thermistor we used to acquire data at
 $z/L=0.50$
(our results at
 $z/L=0.28$
are very similar).
Note that He et al. (Reference He, van Gils, Bodenschatz and Ahlers2014) had a Rayleigh number
 $\mathit{Ra}\simeq 10^{15}$
, nearly five orders of magnitude larger than our
 $\mathit{Ra}=2.0\times 10^{10}$
. Further, their Prandtl number was approximately 0.8, while we have
 $\mathit{Pr}=8.2$
. For both reasons the turbulence in the flow of He et al. (Reference He, van Gils, Bodenschatz and Ahlers2014) is expected to be more fully developed, with larger Reynolds numbers, than is the case in our experiments. Nonetheless, the spectra suggest that the characteristic time scales in physical units of the two experiments turn out to be similar.
The spectra of all three thermistors used by He et al. (Reference He, van Gils, Bodenschatz and Ahlers2014) showed the same frequency responses up to a critical value
 $f_{c1}\simeq 0.05$
Hz (see dotted vertical line) beyond which the spectrum of the 1.13 mm diameter thermistor (dotted curve) fell below the other two. Assuming attenuation was due to a diffusive process, the critical frequency of the smaller thermistors should be larger than
 $f_{c1}$
by the square of the corresponding thermistor size. This assumption yielded the critical frequency
 $f_{c2}\simeq 0.5$
Hz. Indeed, for frequencies above 0.5 Hz, the spectrum of the 0.36 mm thermistor fell below the spectrum of the smallest one (see dashed vertical line in figure 21). Using the same argument, He et al. (Reference He, van Gils, Bodenschatz and Ahlers2014) anticipated the critical frequency of the 0.18 mm thermistor to be
 $f_{c3}\simeq 2.0$
Hz (solid vertical line).
Normalized power spectra
 $P(f)$
of
 $(T-\langle T\rangle )/{\rm\Delta}T$
from He et al. (Reference He, van Gils, Bodenschatz and Ahlers2014) for thermistors with different diameters (see key). The vertical lines show the frequencies above which the spectrum of the corresponding thermistor is noticeably attenuated due to its thermal response time or size. Also shown are our measurements with a thermistor at
 $z/L=0.50$
.

The spectra obtained from our time series lie between the curves of the 0.36 mm and the 0.18 mm thermistors up to
 $f\simeq 3.0$
Hz. Thus we are confident that the size of the thermistors we used did not attenuate the spectrum for frequencies below
 $f_{c3}\simeq 2.0$
Hz. The integral of
 $P(f)$
in the frequency range
 $0<f<2$
Hz is essentially equal to the total power (the variance) of the signal.
Appendix C. Calculation of dissolved-air concentration
The equilibrium concentration
 $c$
of a gas dissolved in a liquid is proportional to the partial pressure
 $P$
of its gas phase as expressed by Henry’s law:
 $$\begin{eqnarray}\displaystyle c=k_{H}(T)P. & & \displaystyle\end{eqnarray}$$
Here
 $k_{H}$
is known as Henry’s coefficient and is a decreasing function of the temperature
 $T$
and specific to each gas–liquid pair.
The liquid manufacturer (3M) provided the concentration (in volume percentage) of air dissolved in the liquid (Novec7000) only at
 $T=25\,^{\circ }\text{C}$
and atmospheric pressure
 $P_{atm}$
. Given that information, we calculated
 $k_{H}$
. In order to obtain the concentration of air given the conditions in our experiments, we assumed no dependence of
 $k_{H}$
on temperature.
The mole number
 $n_{l}$
of Novec7000 per unit of liquid volume
 $V_{l}$
is
 $$\begin{eqnarray}\displaystyle \frac{n_{l}}{V_{l}}=\frac{{\it\rho}_{l}}{m_{l}}, & & \displaystyle\end{eqnarray}$$
where
 ${\it\rho}_{l}$
is the liquid density and
 $m_{l}=0.2~\text{kg}~\text{mol}^{-1}$
is the molecular weight.
Concentration expressed by volume fraction
 $c_{V}$
is normally defined as
 $c_{V}=V_{a}/(V_{l}+V_{a})$
, where
 $V_{a}$
is the volume of air. However, the manufacturer provided concentration in volume fraction defined as
 $c_{V}=V_{a}/V_{l}$
. In what follows the definition
 $c_{V}=V_{a}/V_{l}$
is adopted. The concentration of air in the liquid at
 $T=25\,^{\circ }\text{C}$
in volume percentage is 31 % (personal communication with the manufacturer), and therefore
 $c_{V}=0.31$
. The vapour pressure curve of the liquid evaluated at
 $T=25\,^{\circ }\text{C}$
gives
 $P_{v}(25\,^{\circ }\text{C})=64.6$
kPa, and the partial pressure of air is thus
 $P_{a}=P_{atm}-P_{v}(25\,^{\circ }\text{C})$
.
The mole number of air
 $n_{a}$
per unit of liquid volume is obtained from the ideal gas law,
 $$\begin{eqnarray}\displaystyle \frac{n_{a}}{V_{l}}=\frac{(V_{a}/V_{l})P_{atm}}{RT}, & & \displaystyle\end{eqnarray}$$
where
 $R$
is the universal gas constant and
 $T=25.0+273.15$
K is the absolute temperature. For this temperature
 $k_{H}$
is obtained as
 $$\begin{eqnarray}\displaystyle k_{H}=\frac{n_{a}/V_{l}}{P_{a}(n_{l}/V_{l})}. & & \displaystyle\end{eqnarray}$$
Using
 ${\it\rho}_{l}$
at
 $T=25\,^{\circ }\text{C}$
and
 $P_{a}$
, we obtain
 $k_{H}=5\times 10^{-8}~\text{mol}~\text{Pa}^{-1}~\text{mol}^{-1}$
.
In our experiments the hydrostatic pressure exerted at the bottom plate was
 $P_{tot}=117.6$
kPa. The average temperature at which all nucleation sites became inactive was
 $T_{on}=30.3\,^{\circ }\text{C}$
(
 $T_{exp}=T_{on}+273.15~\text{K}$
). From the vapour-pressure curve of the liquid one finds that
 $P_{v}(30.3\,^{\circ }\text{C})=86.2$
kPa, and thus the partial pressure of air in the interior of a bubble was approximately
 $P_{a,exp}=31.4$
kPa, neglecting the pressure drop across the liquid–vapour interface. The liquid in contact with the bottom plate at
 $T_{on}$
had a density
 ${\it\rho}_{l,on}$
, from which
 $n_{l,exp}/V_{l}={\it\rho}_{l,on}/m_{l}$
was calculated.
From (C 4) we solve for
 $n_{a}/V_{l}$
and substitute
 $P_{a,exp}$
and
 $n_{l,exp}/V_{l}$
in the expression to obtain
 $n_{a,exp}/V_{l}$
. We draw on the ideal gas law to finally obtain an approximate value of the air concentration expressed as volume fraction for our experiments:
 $$\begin{eqnarray}\displaystyle c_{V,exp}\simeq \frac{n_{a,exp}}{V_{l}}\frac{RT_{exp}}{P_{tot}}=0.23. & & \displaystyle\end{eqnarray}$$
Thus the experiments reported here were done with a concentration of air dissolved in the liquid of approximately 23 % by volume. Since
 $k_{H}(T)$
is a decreasing function of temperature, we expect 23 % to be a lower bound of the air dissolved in the liquid.



