


What drives policy change? The full answer is surely complex, involving, among other things, turnover in government personnel, the emergence of new policy problems, and the availability of potential solutions (e.g., Kingdon Reference Kingdon1995). But in a democracy, policy change should also be driven by citizens’ policy preferences: elected officials should respond to public opinion by moving policy in its direction. Dynamic responsiveness of this kind can be thought of as a minimal standard for democratic representation. If policy change has no empirical relationship with mass preferences, then it is unlikely that citizens exercise the kind of control over government that lies at the core of democratic theory.Footnote 1
Dynamic responsiveness has been documented primarily at the national level, especially in the United States but also in Canada and the United Kingdom. National policymaking has been shown to respond both to policy-specific changes in mass opinion (Page and Shapiro Reference Page and Shapiro1983) and to the public’s overall “policy mood”—its global preference for more or less government activity (Stimson, MacKuen, and Erikson Reference Stimson, MacKuen and Erikson1995; Soroka and Wlezien Reference Soroka and Wlezien2010). Moreover, responsiveness to public mood has been found to operate through two main channels: partisan selection (the election of candidates of one partisan type rather than another) and adaptation (driven primarily by elected officials’ anticipation of voter sanctions). While the dynamic responsiveness literature leaves plenty of room for policy determinants other than public opinion, the seemingly robust relationship between mass preferences and policy change offers reassuring evidence of citizens’ influence over government policies.
These optimistic conclusions, however, have been subject to trenchant critiques. Achen and Bartels (Reference Achen and Bartels2016, 456), for example, argue that the impact of adaptation pales relative to the effect of partisan control of government offices. They thus conclude that “citizens affect public policy—insofar as they affect it at all—almost entirely by voting out one partisan team and replacing it with another,” that is, through partisan selection. Indeed, notwithstanding the contrary arguments of Stimson, MacKuen, and Erikson (Reference Stimson, MacKuen and Erikson1995), the prevailing scholarly view is that partisan selection dominates adaptation as a mechanism of responsiveness in the United States—and in recent decades, increasingly so (Levitt Reference Levitt1996; Ansolabehere, Snyder, and Stewart Reference Ansolabehere, Snyder and Stewart2001; Lee, Moretti, and Butler Reference Lee, Moretti and Butler2004; Poole Reference Poole2007; Fowler and Hall Reference Fowler and Hall2017). This has in turn raised normative concerns about “leapfrog representation” by partisan extremists, whose actions may be responsive to, but are rarely congruent with, the preferences of the relatively moderate public (Bafumi and Herron Reference Bafumi and Herron2010; see also Poole and Rosenthal Reference Poole and Rosenthal1984; Lax and Phillips Reference Lax and Phillips2012).
To some degree, these divergent conclusions stem from differences in research design. Most studies that emphasize ideological adaptation examine how policymaking responds to mass opinion in a single country over time (e.g., Stimson, MacKuen, and Erikson Reference Stimson, MacKuen and Erikson1995; Soroka and Wlezien Reference Soroka and Wlezien2010; but see Kousser, Lewis, and Masket Reference Kousser, Lewis and Masket2007). By contrast, work that stresses the dominance of partisan selection is overwhelmingly cross-sectional, typically examining roll-call voting in a single legislature.Footnote 2 Each approach has its advantages and limitations. Time-series studies have the advantage of being explicitly dynamic in orientation and also of focusing on government policies, which are arguably the ultimate metric of representation. But due to the inherent limitations of time-series analysis (small samples, model dependence, etc.), the results of within-country studies tend to be somewhat fragile. For their part, cross-sectional studies tend to have large sample sizes and often employ stronger identification strategies, such as regression-discontinuity (RD) designs. But they too are limited by their focus on within-legislature variation in roll-call voting or other forms of position-taking, which means that they cannot detect governments’ collective responsiveness to popular preferences (Weissberg Reference Weissberg1978).
The U.S. states offer potentially fertile ground for overcoming these limitations. By examining 50 states over many years, we can employ combined time-series–cross-sectional (TSCS) analyses that avoid many of the pitfalls of either approach on its own. Moreover, by using state policies as the outcome of interest, we can explore how public opinion influences not only the positions politicians take, but what governments actually do. A further advantage of state politics is that variation across states provides a natural point of comparison or benchmark for assessing the substantive magnitude of dynamic responsiveness.
Notwithstanding these methodological attractions, the U.S. states present something of a hard case for dynamic responsiveness. Due to fiscal federalism and other constraints on state governments, structural and economic conditions may dominate public opinion as determinants of state policies (Dye Reference Dye1966; Oates Reference Oates1972). Moreover, the lower salience of state politics and increasing nationalization of elections mean that state elections are powerfully affected by national tides, undermining the direct accountability relationship between state-level officials and their electorates (Rogers Reference Rogers2016; Hopkins forthcoming). Thus, despite the “awesome” cross-sectional association between the liberalism of state policies and publics (Erikson, Wright, and McIver Reference Erikson, Wright and McIver1993; see also Gray et al. Reference Gray, Lowery, Fellowes and McAtee2004; Lax and Phillips Reference Lax and Phillips2012), public opinion may be only one relatively minor causal factor among the many that explain change in state policies (see Ringquist and Garand Reference Ringquist, Garand, Weber and Brace1999). Finally, studying dynamic responsiveness in the states presents formidable measurement challenges, for doing so requires yearly summaries of policy outputs and public preferences in each state over many decades.
Fortunately, recent methodological advances have made such an analysis possible. Using newly developed models for estimating the ideological orientation of state publics and policies, we construct dynamic measures of mass and government policy liberalism in each year between 1936 and 2014. Our mass liberalism scores, estimated separately for economic and social issue domains, are based on a dataset of approximately 1.5 million individuals’ responses to over 300 domestic policy questions. From the same dataset, we also derive analogous time series of party identification (PID) in each state-year. The government policy liberalism scores, also estimated separately for economic and social policies, are based on an annual dataset of nearly 150 continuous and categorical state policies. Combining these measures with data on party control of state offices, we use a series of dynamic panel models to examine the extent of state-level dynamic responsiveness as well as its mediators and moderators.
Our analyses reveal that on both economic and (especially) social issues, the policy liberalism of state publics is a robust predictor of future changes in the liberalism of state policies. In other words, when a state’s citizens are comparatively liberal, its policies tend to become more liberal relative to other states. Dynamic responsiveness is gradual, however. Large policy shifts are the result of the cumulation of incremental responsiveness over many years. Mass liberalism also predicts the election of more Democratic officials, though less strongly than does the state-level balance of mass PID. Democratic control of state government in turn leads to more liberal policies, suggesting that partisan selection does indeed mediate dynamic responsiveness. But we also find that policy reacts directly to citizen liberalism, holding constant the party that controls the government. This suggests that adaptation is an important, and perhaps dominant, mechanism of dynamic responsiveness.
In addition to examining the mediators of the opinion–policy relationship, we also investigate what factors moderate this relationship. Our most robust finding is that dynamic responsiveness has increased over time, on both social and economic issues. We find that the cross-sectional relationship between opinion and policy has always been stronger outside the South, and we find some evidence of differential dynamic responsiveness between regions as well, though primarily in recent decades. We also consider various laws and institutions thought to influence representation—including suffrage restrictions, campaign contribution limits, direct democracy, and legislative professionalism—but find no reliable evidence that they moderate dynamic responsiveness.
We close our article with a discussion of the normative implications of our findings. This is a difficult issue, for dynamic responsiveness is but one indicator of the quality of representation, and, under some circumstances, an increase in responsiveness may even degrade other indicators, such as proximity or congruence (Achen Reference Achen1978; Matsusaka Reference Matsusaka2001; Bafumi and Herron Reference Bafumi and Herron2010; Lax and Phillips Reference Lax and Phillips2012). We conclude, however, that our findings are, on the whole, normatively positive. In addition to being powerfully related to citizen policy liberalism at any point in time, state policy liberalism is also responsive on the margin to shifts in public preferences. Given the many reasons for doubting the existence of policy voting and responsiveness (Achen and Bartels Reference Achen and Bartels2016)—reasons that are, if anything, more compelling at the state than the national level—the mere existence of state-level dynamic responsiveness is reassuring. On the other hand, the magnitude of opinion-induced policy changes should not be exaggerated. At least in the short term, within-state shifts are small relative to policy differences across states at a given point in time. States’ relative policy liberalism thus does not swing wildly from year to year, but rather evolves incrementally over time.
THEORETICAL FRAMEWORK
As a theoretical framework for our analysis, we sketch a dynamic model of representation, building on the work of Achen (Reference Achen1978) and others. In our framework, ideological variation is assumed to be one-dimensional within a given policy domain. We presume that governments respond on the margin to mass preferences, making policy more liberal when the public moves left and more conservative when it moves right. Such responsiveness does not imply, however, that policies are necessarily congruent with mass preferences. Rather, due to factors ranging from state governments’ resource constraints to inequality of policy influence across citizens, policies may be systematically biased relative to what the average citizen desires. Nor is responsiveness necessarily proportionate; governments may respond by moving policy less than the public desires, or alternatively they may overreact to public opinion and oscillate between extreme policy positions.
Furthermore, in our model—and here we depart from cross-sectional models like Achen’s—responsiveness need not be immediate. This acknowledges the numerous sources of status-quo bias in policymaking, including the prevalence of budgetary incrementalism, the veto power of pivotal legislators, limited space on the political agenda, and incumbents’ insulation from midterm removal. Together, these barriers conspire to make it difficult to overturn existing policies. Thus, even if elected officials are perfectly representative, they will often be unable to bring all policies immediately in line with new configurations of mass preferences. Rather, a sudden one-time change in mass liberalism will be incorporated incrementally into policy liberalism, as in each year the state updates a portion of its policies. Eventually, if mass opinion remains stable, this model predicts that the state will reach a new policy equilibrium that reflects both the influence of the mass public and the persistent sources of policymaking bias in that state. In short, a dynamic model of representations implies that responsiveness should be incremental, with modest short-term effects potentially cumulating into large long-run differences.Footnote 3
Mechanisms
In a representative democracy, there are two main mechanisms by which mass publics can influence policymaking, which we refer to as selection and adaptation (compare Miller and Stokes Reference Miller and Stokes1963; Stimson, MacKuen, and Erikson Reference Stimson, MacKuen and Erikson1995; Fearon Reference Fearon, Przeworski, Stokes and Manin1999). In the selection mechanism, citizens influence government policymaking by electing candidates whose ideological type best represents their views. In the contemporary American two-party system, this generally entails choosing between Democrats and Republicans—that is, partisan selection. For partisan selection to be an effective channel for responsiveness, a two-step process is required. First, mass liberalism must affect which party wins elections. Second, the partisan outcome of elections must affect policy liberalism. Partisan selection is thus the part of mass liberalism’s effect on policy that is mediated by party control of government offices.
Adaptation, by contrast, is the portion of responsiveness not mediated by party control—that is, with party control held constant. Most theoretical work on adaptation has focused on individual incumbents’ incentives to avoid electoral sanctions by responding preemptively to public sentiment (Downs Reference Downs1957; Mayhew Reference Mayhew1974; Kingdon Reference Kingdon1989; Snyder and Ting Reference Snyder and Ting2003). In principle, such individual-level adaptation can result in perfect responsiveness without the replacement of a single incumbent (and thus without any change in party control). As we define it in this article, however, adaptation also encompasses within-party turnover: the replacement of moderate incumbents with more extreme members of the same party, or vice versa.
On the whole, the empirical literature on responsiveness emphasizes the dominance of selection over adaptation (Levitt Reference Levitt1996; Ansolabehere, Snyder, and Stewart Reference Ansolabehere, Snyder and Stewart2001; Lee, Moretti, and Butler Reference Lee, Moretti and Butler2004; Poole Reference Poole2007; but see Stimson, MacKuen, and Erikson Reference Stimson, MacKuen and Erikson1995; Kousser, Lewis, and Masket Reference Kousser, Lewis and Masket2007). There is certainly ample evidence for the second step in the selection mechanism, partisan effects on policy. At the state level, for example, electing Democrats rather than Republicans leads to much more liberal legislative representation and to modestly more liberal state policies (Shor and McCarty Reference Shor and McCarty2011; Caughey, Tausanovitch, and Warshaw Reference Caughey, Tausanovitch and Warshaw2017; Caughey, Warshaw, and Xu Reference Caughey, Warshaw and Xu2017; Fowler and Hall Reference Fowler and Hall2017). In the legislature, partisan effects on policy seem to be driven predominantly by shifts in majority control, with the size of the majority having little independent effect on policy (Caughey, Warshaw, and Xu Reference Caughey, Warshaw and Xu2017). The evidence for the first step—mass liberalism’s effect on elections—is less robust, especially in studies of dynamic responsiveness. Achen and Bartels, for example, stress the fragility and model-dependence of the evidence for partisan selection in national politics, leading them to conclude that mass policy preferences “are of relatively little importance in determining who wins” elections (Reference Achen and Bartels2016, 46). Though there is less empirical work on the subject, the dynamic relationship between mass liberalism and election outcomes is likely to be even weaker in the states, where electoral shifts are dominated by exogenous national conditions (Rogers Reference Rogers2016). In short, notwithstanding the evidence for party effects, it is unclear how much of state policy responsiveness is mediated through party control.
On the other hand, there is reason to believe that adaptation is a more important mechanism of state policy responsiveness than the existing literature suggests. Most existing studies focus on roll-call voting in a single legislature, which means that they cannot measure collective responsiveness to public opinion. Thus, if a state public moves to the right and all officials respond equally to this shift, a comparison of state legislators’ roll-call votes will not detect any adaptation, only cross-sectional ideological differences between legislators.Footnote 4 The relatively few studies that examine opinion effects on policy rather than roll calls, whether in cross section (Erikson, Wright, and McIver Reference Erikson, Wright and McIver1993) or time series (Erikson, MacKuen, and Stimson Reference Erikson, MacKuen and Stimson2002), tend to find greater evidence for responsiveness unmediated by party control. In sum, we expect adaptation to be a more important mechanism of state policy responsiveness than the more general literature on responsiveness suggests.
Variation Across Issue Domains
Nearly all studies that have found strong evidence of state-level policy responsiveness either employ general measures of liberalism–conservatism that combine different policy domains (e.g., Erikson, Wright, and McIver Reference Erikson, Wright and McIver1993) or else focus almost exclusively on social policies (e.g., Lax and Phillips Reference Lax and Phillips2009, Reference Lax and Phillips2012). What evidence there is for responsiveness on economic issues tends to be somewhat weaker (Pacheco Reference Pacheco2013).Footnote 5 This is not surprising, for there are several reasons to expect states to be less responsive on economic than social issues.
First, states tend to have less policymaking discretion on economic issues. Federal and state governments share responsibility over many policy areas, and a large share of state government monies come from the federal government (Pew Charitable Trusts 2016), which is largely unresponsive to shifts in state-level public opinion. State taxing and spending choices are also constrained by economic competition with other jurisdictions. Thus, regardless of their citizens’ preferences, states can increase taxes and regulations only so much before businesses and higher-income citizens vote with their feet by moving to other states (Oates Reference Oates1972; Bailey and Rom Reference Bailey and Rom2004).
Economic and social issues differ at the mass level as well. Because social policies tend to be more symbolic than technical and to concern ends rather than means, they are more likely than economic policies to be “easy” issues for citizens. Citizens are thus likely to find it easier to “calculate relative positioning of parties and candidates” on social issues (Carmines and Stimson Reference Carmines and Stimson1980, 82). Citizens’ policy preferences on social issues are also likely to be more stable and coherent than their economic preferences, making it easier for politicians to discern signal from noise in public opinion.Footnote 6 In short, because social policies are both more amenable to state control and easier for citizens to understand, we should expect state-level responsiveness to be stronger on social than economic issues.
Institutional Moderators
In addition to varying across issue domains, dynamic responsiveness may also vary across institutional and other contexts. Indeed, as Lax and Phillips (Reference Lax and Phillips2012, 158) note, “many of the largest debates in the state politics literature involve which, if any, institutional features of state government enhance or undercut the relationship between policy and opinion.” We explore this possibility by examining four sets of institutions that might moderate state policy responsiveness.
The past eight decades have witnessed large changes in the institutional structure of American democracy, none more important than the 1960s-era dismantlement of suffrage restrictions, mainly in Southern states (Key Reference Key1949; Mickey Reference Mickey2015). These restrictions both changed the demographic and ideological composition of the electorate and reduced voter turnout overall (Kousser Reference Kousser1974; Springer Reference Springer2014). As a result, one might hope and expect that the elimination of undemocratic institutions in the South led to greater responsiveness to citizens’ policy preferences in those states. On the other hand, there is recent evidence to suggest that the one-party South was not obviously less responsive to the eligible electorate than the two-party North (Caughey forthcoming). Since the preferences of different social groups tend to move in parallel with one another (Page and Shapiro Reference Page and Shapiro1992), dynamic responsiveness to one group often implies responsiveness to the public as a whole (Stimson Reference Stimson2009). To the extent that this is true, then the elimination of suffrage-restricting institutions may not have had a substantial effect on dynamic responsiveness in the South.
There are also reasons to believe that campaign contribution limitations may influence policy responsiveness by affecting politicians’ incentives to focus on the preferences of the median voter. Indeed, contributions from corporations and wealthy individuals could incentivize elected officials to focus more on their opinions than the opinion of the median voter (Bartels Reference Bartels2008; Gilens Reference Gilens2012). We therefore expect limits on campaign contributions to increase the responsiveness of policy to public opinion. Several previous studies have examined the direct effect of campaign finance limits on state legislators’ ideology (Barber Reference Barber2016; La Raja and Schaffner Reference La Raja and Schaffner2015) and state policy (Besley and Case Reference Besley and Case2003; Werner and Coleman Reference Werner and Coleman2013), but no previous study has examined the effect of campaign finance rules on the responsiveness of state policies to public opinion.
Another set of institutions that possibly improve responsiveness are reforms designed to enhance what might be called citizen governance, such as direct democracy and term limits. Direct democracy might do so by giving citizens the ability to circumvent elected officials and enact their preferred policy through the ballot box (Matsusaka Reference Matsusaka2008). In addition, the threat of the initiative may lead elected officials to change their behavior to preempt future ballot measures (Gerber Reference Gerber1996). Finally, even if elected officials do not actively seek to preempt future initiatives, the results of initiatives may help them learn about voter preferences (Matsusaka Reference Matsusaka2008). Despite sound theoretical reasons to expect that direct democracy might improve responsiveness, empirical studies of its effects have been ambiguous.Footnote 7
Term limits might increase responsiveness by inducing greater turnover among legislators. This could lead to the election of legislators who better reflect constituents’ (current) preferences. On the other hand, term limits could lead to shirking, particularly among legislators not planning to seek another office (Clark and Williams Reference Clark and Williams2014). It could also lead to less experienced legislators, which might reduce their capacity to assess and respond to public opinion. Term limits may also reduce incentives to respond to public opinion by limiting the value of a seat in the legislature (Kousser Reference Kousser2005). There have been few empirical studies of the effect of term limits on representation, but one recent study finds that cross-sectional responsiveness is stronger in states with term limits (Lax and Phillips Reference Lax and Phillips2012).
Finally, legislative professionalism may affect state governments’ responsiveness to public opinion. Some states, such as California, have very professional legislatures that resemble the U.S. Congress, whereas others, such as Vermont, have part-time legislators that meet for only a few weeks a year (Squire Reference Squire1992, Reference Squire2007). Professional chambers can use their resources to assess changes in mass opinion. Also, there are greater incentives for lawmakers in professional chambers to be responsive to the public to retain office (Maestas Reference Maestas2000). As a result, we might expect states with more professionalized legislatures to be more responsive to public opinion. Two recent studies find that states with higher levels of legislative professionalism are more responsive to public opinion (Pacheco Reference Pacheco2013; Lax and Phillips Reference Lax and Phillips2012), while another recent study finds no effect on responsiveness (Lax and Phillips Reference Lax and Phillips2009).
MODELING STRATEGY
Achen (Reference Achen1978) argues that citizens’ influence over the government can be measured by the expected difference in government outputs associated with a given difference in the preferences of the average citizen—that is, the regression slope, which he labels responsiveness.Footnote 8 Defined this way, responsiveness is a descriptive quantity: it simply captures the covariation between citizens’ preferences and governmental outputs. Due to data limitations, most previous studies have focused on this cross-sectional link between the mass public’s policy preferences and government policy. But a major problem with cross-sectional analyses of representation is that it is very difficult to rule out the possibility that some third, unmeasured characteristic of states—its political culture, for example—confounds the relationship between mass liberalism and policy liberalism, or even the possibility that policy liberalism causes mass liberalism.
The normative significance of responsiveness, however, largely hinges on whether the relationship is causal—that is, on whether government outputs would have differed had citizens’ preferences been different.Footnote 9 Estimating responsiveness in a causal sense requires isolating exogenous variation in citizens’ preferences, a tall order indeed. Nevertheless, such causal inferences can be made more credible by exploiting temporal variation in citizens’ preferences. As Stimson, MacKuen, and Erikson (Reference Stimson, MacKuen and Erikson1995, 543) note, representation is a process that is “inherently structured in time.” We therefore follow Stimson, MacKuen, and Erikson (Reference Stimson, MacKuen and Erikson1995) and Soroka and Wlezien (Reference Soroka and Wlezien2010) in examining the dynamic relationship between mass liberalism and policy liberalism, accounting for policy liberalism’s recent history.
Where we depart from these authors is in our use of TSCS data. A time-series–cross-sectional approach offers considerable advantages over a purely time-series one. It enables us to estimate a dynamic panel model that includes not only a lagged dependent variable (LDV), as a typical time-series model would, but also state and year fixed effects (FEs). The state and year FEs enable us to rule out two threats to causal inference that time-series data alone cannot: time-invariant state-specific confounders and year-specific shocks that affect all states equally (Angrist and Pischke Reference Angrist and Pischke2009).Footnote 10 In substantive terms, the state FEs in particular can be interpreted as capturing the policymaking bias unique to each state. The inclusion of an LDV is also very important, however, for past policies are just the sort of time-varying state-specific confounders that FEs alone cannot account for.Footnote 11 Including an LDV also enables us to analyze how mass liberalism affects policy liberalism over both the short and the long term. In sum, while our dynamic panel model cannot rule out all confounders of the opinion–policy relationship, it provides a firmer basis for causal inference than either time-series or cross-sectional analysis alone.
Before describing the details of data and measures, we note a final important element of our empirical strategy, which is to account for the measurement error in our key variables. The main independent and dependent variables in this study—mass liberalism and policy liberalism in each issue domain—are latent quantities whose values must be inferred rather than directly observed. Measurement error in latent variables can bias point estimates and standard errors. Thus, in all of our regression analyses, we account for measurement error in these variables (as well as in PID) using a technique known as the “method of composition” or “propagated uncertainty” (Tanner Reference Tanner1996, 52; Treier and Jackman Reference Treier and Jackman2008, 215–6; Kastellec et al. Reference Kastellec, Lax, Malecki and Phillips2015, 791–2).Footnote 12 The main consequence of these adjustments is to attenuate the estimated effects of mass liberalism by about one-third relative to the unadjusted estimates (see Supplementary Appendix E).
DATA AND MEASURES
This section describes the data and measures we use in our analysis. For summary statistics on our key variables, see Supplementary Appendix C.
Mass Policy Preferences
Estimating the relationship between mass preferences and state policies requires measures of each construct for each state in each year. A major difficulty with obtaining such annual measures is that, although thousands of Americans have been surveyed on their policy preferences in each year since 1936, the specific survey questions asked have been sparsely and unevenly distributed across time. Moreover, there are often small samples available in any particular year, particularly for smaller states. These challenges make it practically impossible to examine policy-specific responsiveness at the state level over any long time span. The most ambitious existing effort is Pacheco’s (Reference Pacheco2013) analysis of the responsiveness of state education and welfare spending to public preferences for more spending, issues where state-level polling has been particularly dense in the period she covers (1977–2000). Even so, to address sparse survey samples Pacheco smooths the state estimates with multilevel regression coupled with a 5-year moving average, which improves the reliability of estimates in smaller states but dampens yearly fluctuations in state opinion (see also Pacheco Reference Pacheco2011). Aside from Pacheco (Reference Pacheco2013), all other studies have dealt with the problem of sparse survey data by using proxies for mass policy preferences derived from ideological self-identification, presidential vote, or the roll-call records of the state congressional delegation (e.g., Erikson, Wright, and McIver Reference Erikson, Wright and McIver1993; Levitt Reference Levitt1996; Berry et al. Reference Berry, Ringquist, Fording and Hanson1998).
We take an alternative approach: inferring the latent policy liberalism of state publics by aggregating responses to many distinct policy questions across many polls. We do so using a dynamic, hierarchical group-level item-response model (Caughey and Warshaw Reference Caughey and Warshaw2015; see Supplementary Appendix for more details). While conceptually similar to the estimates of “public policy mood” estimated by Stimson (Reference Stimson1991) at the national level and by Enns and Koch (Reference Enns and Koch2013) in the states, our mass liberalism measures differ from mood in two respects.Footnote 13 First, mood is a relative measure; it captures whether the public wants more or less government, relative to what is being currently provided. By contrast, our mass liberalism estimates are based only on policy questions that do not explicitly or implicitly reference the policy status quo and are thus intended as measures of absolute, not relative, liberalism. This is important because the overwhelming majority of survey questions in our data pertain either to national policy or to policy in the abstract, not state policies specifically. Our conception of mass liberalism as an absolute measure is thus primarily a practical concession to the available polling data.
A second difference is that we estimate mass liberalism separately for economic and social issues (compare Treier and Hillygus Reference Treier and Hillygus2009; Stimson, Thiébaut, and Tiberj Reference Stimson, Thiébaut and Tiberj2012).Footnote 14 We do so because mass policy preferences across domains have exhibited distinct temporal dynamics and were, until recently, only weakly correlated. This is true not only at the level of individuals, whose lack of issue constraint is well known, but also at the level of geographic or partisan groups, who typically exhibit much more ideological structure than individuals. Thus, while treating mass liberalism as unidimensional is often a reasonable approximation in contemporary American politics (see, e.g., Jessee Reference Jessee2009; Tausanovitch and Warshaw Reference Tausanovitch and Warshaw2013), the long time span of our study makes it much less tenable.
To estimate mass liberalism in each domain, we rely on a dataset of survey responses to over 300 domestic policy questions spread across nearly 1,000 public-opinion surveys fielded between 1936 and 2014. Overall, the responses of nearly 1.5 million distinct individuals are represented in the data. This dataset includes nearly all policy questions asked on U.S. national surveys in more than 1 year and the vast majority of questions asked for only a single year, particularly early in the time period when policy questions were sparse. It includes canonical academic surveys, such as the American National Election Study and the General Social Survey, as well as hundreds of polls from commercial polling organizations such as Gallup, CBS News/NYTimes, ABC News/Washington Post, and many others. Out of the 3,846 state-years in our dataset, 95% contain at least some opinion data on social issues, and 98% contain at least some data on economic opinion.
As noted above, we estimate economic and social liberalism separately. The economic questions cover issues such as taxes, social welfare, and labor regulation. The social questions include ones about alcohol, abortion, gay rights, women’s rights, school prayer, and other cultural (but not racial) issues. To ensure the comparability of our estimates over time, we use question series with consistent question wording, substantive meaning, and response categories as bridge items. While no individual survey item is asked consistently between 1936 and 2014, there are many survey questions that are asked consistently for shorter periods of time. These items glue our estimates from one time period together with our estimates for other time periods. Since almost all these surveys also include a question about PID, we use the same dataset to estimate the proportions of Democrats, Republicans, and Independents in each state-year.
To construct our measure of mass liberalism, we first used a dynamic group-level IRT model to estimate annual average liberalism in groups defined by state, race, and urban residence.Footnote 15 Then, using data from the U.S. Census (Ruggles et al. Reference Ruggles, Alexander, Genadek, Goeken, Schroeder and Sobek2010), we poststratified the group estimates to match the groups’ proportions in the state population to produce estimates of average liberalism in each state-year. Finally, to aid interpretability of the estimates, we standardized them within each Monte Carlo iteration to have a mean of 0 and a variance of 1 across state-years.
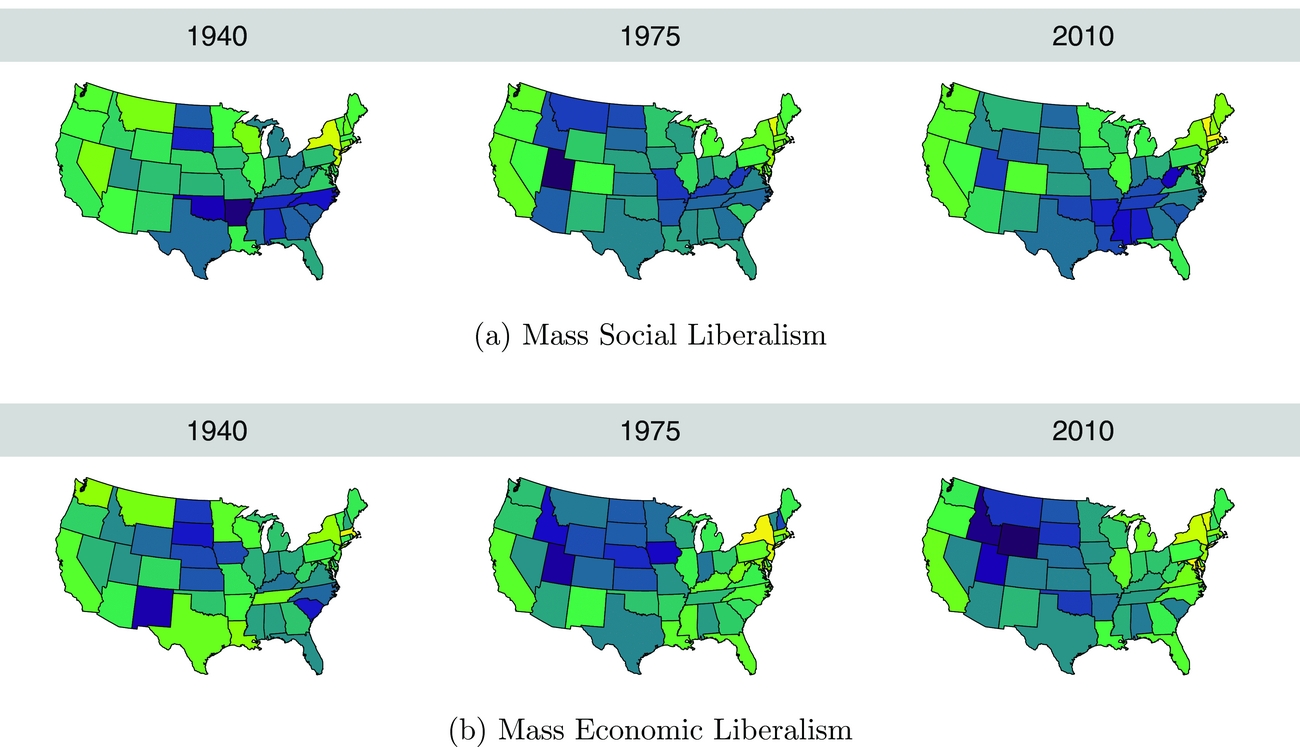
Figure 1 maps our estimates of mass social and economic liberalism in 1940, 1975, and 2010. The cross-sectional patterns are generally quite sensible—New York and Massachusetts are always among the most liberal states, and states like Utah and South Dakota among the most conservative. However, it is worth noting that Southern states are typically more conservative on the social dimension than the economic dimension. Moreover, consistent with Erikson, Wright, and McIver’s (Reference Erikson, Wright, McIver and Cohen2006) conclusion that state publics have changed relatively little in terms of ideological identification, we find that mass policy liberalism in the states has also remained fairly stable, shifting substantially in only a few states. These exceptions include Vermont, which has become more liberal on both dimensions, as well as several Southern and Western states, such as Idaho and Louisiana, which have become more conservative.
Mass Liberalism by State, 1940–2010. Darker shading indicates more conservative opinion. To accentuate the color contrasts, the estimates in this figure are standardized within year.

State Policies
We next require a measure of the liberalism of state policies. For consistency with our domain-specific measures of mass liberalism, we separate state policy liberalism by domain as well, using the measures of economic and social policy liberalism estimated by Caughey and Warshaw (Reference Caughey and Warshaw2016). It is worth noting, however, that throughout the period we examine, there has consistently been a much higher correlation between the liberalism of states’ economic and social policies than between the economic and social liberalism of state mass publics.
These measures of domain-specific policy liberalism are based on a total of nearly 150 individual state policies. The scores are estimated using a dynamic Bayesian factor-analytic model for mixed data, which allows the inclusion of both continuous and ordinal indicators of state policy.Footnote 16 The policy dataset underlying the policy liberalism scores is designed to include all politically salient state policy outputs on which comparable data are available for at least 5 years.Footnote 17 The economic dimension covers a wide range of policy areas, including social welfare (e.g., AFDC/TANF benefit levels), taxation (e.g., income tax rates), labor (e.g., right-to-work), and the environment (e.g., state endangered species acts). The social dimension includes women’s rights (e.g., jury service for women), morals legislation (e.g., anti-sodomy laws), family planning (e.g., ban on partial birth abortion), religion (e.g., public schools can post the Ten Commandments), criminal justice (e.g., death penalty), and drugs (e.g., marijuana decriminalization).
Institutions
Our data on potential institutional moderators of dynamic responsiveness are drawn from various sources. We obtained data on suffrage restrictions (poll taxes and literacy tests) from Springer (Reference Springer2014). We drew our data on campaign finance regulations (limits on the contributions of individuals, corporations, and unions) from a wide range of sources. These include state statutes, academic analyses (Stratmann and Aparicio-Castillo Reference Stratmann and Aparicio-Castillo2006; La Raja and Schaffner Reference La Raja and Schaffner2014), various editions of The Book of the States and the FEC’s Analysis of Federal and State Campaign Finance Law, and other reference works (e.g., Ford Reference Ford1955; Alexander and Denny Reference Alexander and Denny1966). Data on reforms intended to enhance citizen governance (direct democracy and term limits) were obtained from Matsusaka (Reference Matsusaka2008) and from the National Conference of State Legislatures. There are no existing measures of legislative professionalism that span our entire time period.Footnote 18 Thus, we construct a simple proxy for legislative professionalism using the natural log of the number of days that each state legislature is in session during a 2-year period based on data from the The Book of the States.Footnote 19 Data on the partisanship of state officials comes from Klarner (Reference Klarner2013).
RESPONSIVENESS: CROSS-SECTIONAL AND DYNAMIC
We now turn to the relationship between mass liberalism and the liberalism of government policies. We begin with a cross-sectional analysis typical of most studies of responsiveness. Figure 2 plots the state-level relationship between mass liberalism and policy liberalism separately by policy domain (social and economic), time period (before and since 1972), and region (South and non-South). States’ mass and government liberalism have been standardized within years and then averaged across years within period, so these relationships can be interpreted roughly as the average cross-sectional responsiveness in each domain, period, and region.
Cross-sectional Relationship between Mass and Government Policy Liberalism, by Region, Era, and Issue Domain.

Figure 2 reveals several noteworthy patterns. First, in the period before 1972, when disenfranchisement and lack of partisan competition were still very much live issues in Southern states, mass and government policy liberalism were essentially uncorrelated within that region.Footnote 20 By contrast, in the more democratic non-South, government policy liberalism has always had a robust relationship with mass liberalism. The relationship in the non-South has strengthened somewhat over time, with the correlation increasing from 0.6 to 0.8 on both social and economic issues. (These correlations and subsequent regression estimates are all corrected for measurement error.) On social issues the cross-sectional correlation has increased in the South as well (to 0.6 in the post-1972 period), but the economic policies of Southern states remain essentially uncorrelated with public opinion as well as substantially more conservative than those of non-Southern states.
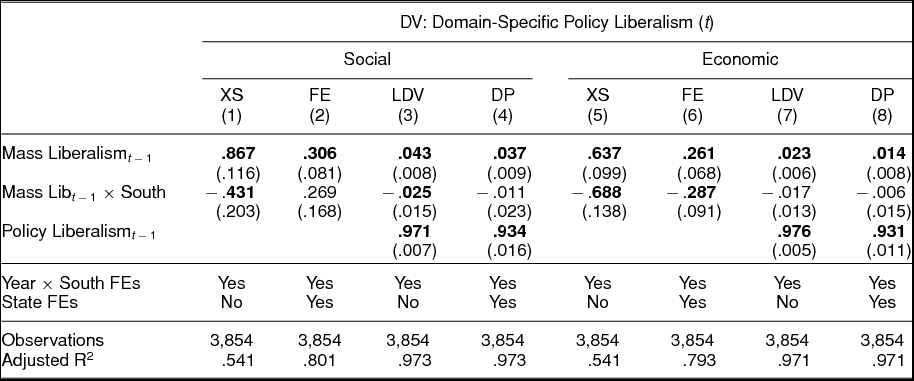
These regional differences in cross-sectional responsiveness can also be seen in columns (1) and (4) of Table 1, which report estimates of cross-sectional responsiveness on social and economic issues, respectively, averaged over the entire 1936–2014 period. All the variables in this table are scaled within iteration to have a standard deviation (SD) of 1 across state-years. As the main effect of Mass Liberalism t − 1 in column (1) indicates, outside the South there is nearly a one-to-one cross-sectional relationship between mass and policy liberalism on social issues: a 1-SD difference on one is associated with a 0.87-SD difference in the other. On economic issues, the opinion–policy relationship in the non-South is only modestly weaker. But as the interactions with South show, cross-sectional responsiveness on social issues is about half as strong in the South as in the non-South, and on economic issues is wholly absent.
Cross-sectional and dynamic responsiveness, by issue domain and region. XS = pooled cross-sectional regression; FE = two-way fixed effects; LDV = lagged dependent variable; DP = dynamic panel. In all specifications, year intercepts are allowed to vary by region. Standard errors are clustered by state and are robust to autocorrelation. Variables are scaled to have a standard deviation of 1. Estimates are corrected for measurement error. Bold coefficients are statistically significant at the 10% level.

Quite a different conclusion emerges, however, if we examine responsiveness from a dynamic rather than cross-sectional perspective. A first cut at such an over-time perspective is provided by columns (2) and (5) of Table 1, which report the results of specifications that include FEs for state as well as year. These specifications capture the opinion–policy relationship within states net of national trends, thus eliminating the influence of time-invariant state-specific confounders. The estimates indicate that, in both regions, state-years in which mass liberalism was higher than average for that state also tended to have higher-than-average policy liberalism. Taken at face value as causal estimates, the coefficients from the two-way FE model are strikingly large. They imply that in the non-South, a 1-SD change in mass liberalism has an immediate effect of 0.31 SDs on social policy liberalism and 0.26 SDs on economic policy liberalism. On economic issues, the opinion–policy relationship again disappears in the South, but on social issues it is, if anything, stronger than in the non-South.
These inferences, however, hinge on the standard assumptions of two-way FE models, notably that there are no state-specific time-varying confounders. One very obvious such confounder is past state policies, which influence future policies in the direct sense of being path dependent and difficult to change. The responsiveness estimates in column (3) and (6), which control for lagged policy liberalism instead of state FEs, are an order of magnitude smaller in magnitude. As indicated by the lag coefficients, policy liberalism in both domains is powerfully predicted by its past values (though both lag coefficients are clearly less than 1, indicating mean-reversion). Adding state FEs back in, as in columns (4) and (8), shrinks the estimates only a little further. Nevertheless, all specifications supply evidence that non-Southern states are responsive to their publics. Although the regional interactions in the dynamic panel models are statistically insignificant, we also cannot reject the hypothesis of zero responsiveness in the South, especially on economic issues (we explore this further in our discussion of moderators below).
Consistent with our expectations regarding differences across policy domains, the substantive magnitude of dynamic responsiveness appears to be greater on social than economic issues. Averaging across regions, the dynamic panel model estimates a standardized opinion effect of 0.035 (SE = 0.009) for social policy as compared to 0.013 (0.007) for economic policy. That is, the estimated policy effect of a 1-SD difference in mass opinion is almost three times as large on social issues as on economic ones. Even on social issues, however, the immediate effect of mass liberalism is still an order of magnitude smaller than what the two-way FE estimates naively imply.Footnote 21
Due to policy liberalism’s strong persistence over time, however, the long-term effects of mass liberalism are much larger than the immediate effect. One way to see this is to calculate the long-run multiplier of Mass Liberalism t − 1, which can be interpreted as the total effect of a permanent one-unit increase in mass liberalism over all future time periods (De Boef and Keele Reference De Boef and Keele2008, 191). On social issues, the estimated long-run multiplier of Mass Liberalism t − 1 is 0.57 (SE = 0.16) in the non-South and 0.38 (0.33) in the South. On economic issues, the analogous estimates are 0.20 (0.11) for the non-South and 0.12 (0.21) for the South. That is, if the public of a non-Southern state suddenly became 1 unit more liberal on social issues, we would expect the state’s social policy liberalism to eventually settle at a new equilibrium 0.57 units above its old equilibrium (assuming no national trends in social liberalism).Footnote 22 The effect would occur gradually, however. It would take more than a decade, for example, for 50% of the long-run effect to be realized, and half a century for 95% to be realized. Note that compared to the immediate dynamic effects of Mass Liberalism, the long-run effects are much closer in magnitude to the cross-sectional relationships reported in Table 1. This is consistent with the hypothesis that the strong contemporaneous correlation between state policies and opinion is the product of the long-term, gradual accumulation of incremental policy responses to mass preferences.
MECHANISMS: PARTISAN TURNOVER AND ADAPTATION
As noted earlier, dynamic responsiveness to popular preferences can occur by two main mechanisms: partisan selection and adaptation. Partisan selection is a two-step process. First, voters’ liberalism must affect their probability of electing candidates of one party over another. Second, the newly elected officials must implement different policies than their opponents would have. In short, if greater liberalism in the public causes the election of more Democrats, and electing more Democrats causes policies to become more liberal, then partisan selection mediates the effect of opinion on policy. Adaptation, by contrast, is that portion of dynamic responsiveness not mediated by the selection of candidates of one party or another, but rather is the result of officials in each party responding directly to shifts in public sentiment. In sum, evaluating the relative importance of partisan selection and adaptation entails estimating three causal effects: the effect of mass liberalism on party control of government, the effect of party control on policy liberalism, and the effect of mass liberalism on policy liberalism with party control held constant.
We begin our empirical analysis with the first effect, that of mass liberalism on party control. To measure the latter concept, we create indicators for whether the Democratic Party controls the governorship, the lower house of the state legislature, and the upper house. We combine these indicators into a single summative index of Democratic Control, normalized to range from 0 to 1.Footnote 23 Except in rare circumstances, Democratic Control can change only in years following state elections, which in all but four states occur in even years. We therefore subset to years that follow a state house election, estimating the effect on Democratic Control of mass liberalism in the preceding election year.
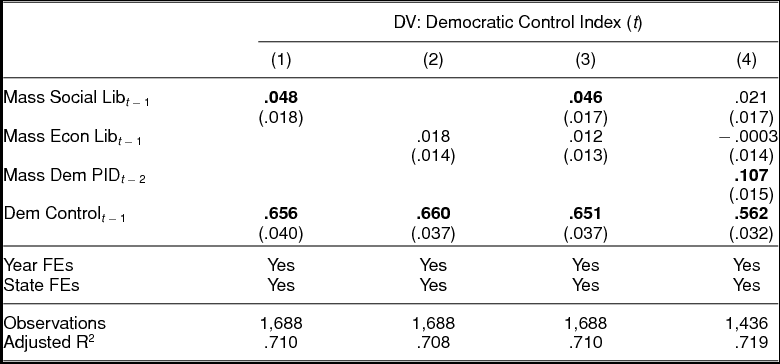
Table 2 summarizes the results of this analysis, which employs a dynamic panel specification similar to Table 1. As indicated by the coefficients for Democratic Control t − 1 in the bottom row, the partisan composition of the legislature is moderately autocorrelated, but not nearly as much so as policy, suggesting a fairly strong tendency towards alternation in party control over time.Footnote 24 More relevant to our purposes here, the first and second rows of Table 2 show that Mass Liberalism t − 1 (that is, in the most recent election year) has a modest effect on changes in party control. A 1-SD difference in mass social liberalism increases Democratic Control t by 0.05 (column 1), and an analogous increase in economic liberalism does so by 0.02 (column 2), though the 95% confidence interval of the latter estimate includes zero. When mass social and economic liberalism are included in the same specification (column 3), their estimated coefficients remain stable, and their sum (0.06, SE = 0.02) remains clearly positive.
Effect of mass policy preferences and partisanship on partisan turnover. The data have been subsetted to years following state house elections, which in most states are odd years. Standard errors are clustered by state and are robust to autocorrelation. The Democratic Control Index ranges from 0 to 1. Other variables are scaled to have a standard deviation of 1 across state-years.

One potential concern with these results is that the apparent effect of mass liberalism may be confounded by Democratic PID. That is, the proportion of Democratic identifiers in the public may affect both mass liberalism and voters’ willingness to elect Democrats. Column (4) assesses this possibility by controlling for Mass Democratic PID t − 2, the year before mass liberalism is measured. Mass Democratic PID t − 2 clearly has a powerful effect on Democratic Control t, increasing the proportion of government controlled by Democrats by 0.11 for each SD change.Footnote 25 Accounting for mass PID reduces the magnitude and statistical significance of both mass liberalism coefficients, to the point where the estimated effect of mass economic liberalism is essentially zero. Clearly, mass partisanship is a much more powerful predictor of partisan turnover than is mass liberalism.
Nevertheless, together the preceding analyses suggest that mass liberalism does increase the odds that the Democrats will control state government.Footnote 26 For partisan selection to be a mechanism of dynamic responsiveness, however, the partisan composition of the government must also affect the liberalism of state policies. As many classic studies of state politics emphasize, the cross-sectional relationship between Democratic control and policy liberalism is actually close to 0, or even negative (e.g., Erikson, Wright, and McIver Reference Erikson, Wright and McIver1993). But more recent analyses employing panel and RD designs have confirmed that Democratic control of the governorship or legislature modestly increases the liberalism of state policies (e.g., Brown Reference Brown1995; Caughey, Warshaw, and Xu Reference Caughey, Warshaw and Xu2017).
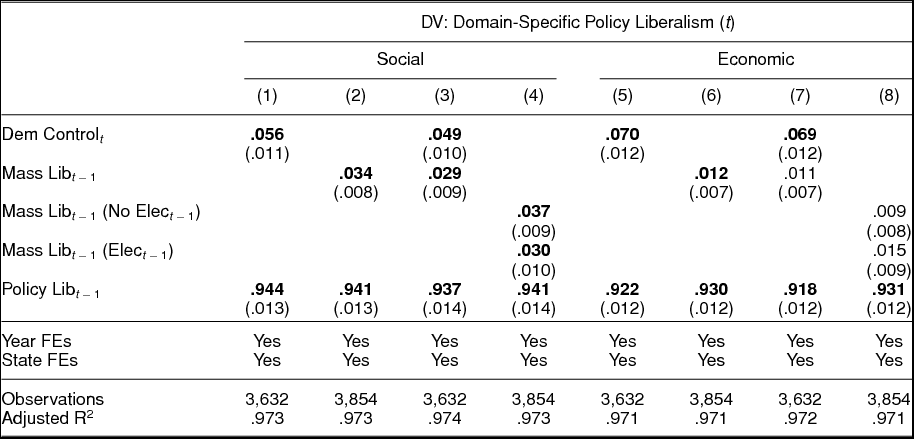
We replicate this latter finding in columns (1) and (5) of Table 3, which show the effect of Democratic Control t on Policy Liberalism t in the economic and social domains, respectively. (For this analysis we use the full sample of years.) In both domains, going from full Republican to full Democratic control of the elected branches increases domain-specific policy liberalism in that year by 0.05–0.07 SDs.Footnote 27 Such complete switches in party control are rare, however. The SD of Democratic control is 0.39, which corresponds to a shift in approximately one of the three government institutions that compose the index. By this standard, the effect of Democratic control is roughly comparable to that of mass liberalism. The standardized effect of Democratic control is 0.02 for social policy and 0.03 for economic, about the same size as the standardized effect of mass liberalism in each domain.
Partisan selection and adaptation as mechanisms of dynamic responsiveness. Standard errors are clustered by state and are robust to autocorrelation. The Democratic Control Index ranges from 0 to 1. Other variables are scaled to have a standard deviation of 1 across state-years. Bold coefficients are significant at the 10% level.

To assess the degree to which the effect of opinion on policy is mediated by party control (that is, through the mechanism of partisan selection), we rely on three complementary analyses. The first is to simply multiply the estimated effects of mass liberalism on Democratic control and Democratic control on policy liberalism. This method estimates the mediated effect to be 0.0027 (SE = 0.0011) for social policy and 0.0013 (0.0010) for economic. These estimates are about 7–11% of the total effects of mass liberalism reported in columns (2) and (6) of Table 3. Similar results are obtained if we use a different method: subtracting the controlled direct effect of Mass Liberalism t − 1 (column 3/7) from its estimated total effect (column 2/6).Footnote 28
Finally, the same basic pattern appears if we hold Democratic control fixed by design rather than through statistical control. We do this by comparing dynamic responsiveness in years that follow an election, when party control could conceivably change, with years not following an election, when it will generally be the same as in the previous year. Responsiveness in years where only adaptation is possible is captured by the coefficients labeled “Mass Libt − 1 (No Elect − 1)” in columns (4) and (8). Responsiveness on economic issues is estimated to be slightly stronger after an election, but the opposite is true for social issues. The economic estimates lose also statistical significance when we split the sample. The essential point, however, is that the coefficient estimates for election and nonelection years are very similar to each other and to their counterparts in columns (3) and (7).
Given the imprecision of the mediation estimates and the strong assumptions required to interpret them causally, we should not focus too much on their exact magnitude. It is nevertheless striking how little support the mediation analyses provide for partisan selection as a mechanism of responsiveness. This is true not because party control has no policy effects—they are in fact quite large and robust—but rather because mass liberalism is only weakly related to shifts in party control. These results thus leave substantial scope for responsiveness in the absence of changes in party control. It is also worth noting that the final analysis, by examining nonelection years separately, implicitly holds constant each party’s internal composition as well as the between-party balance of power. The fact that this analysis yields results very similar to those from controlling explicitly for party control suggests that within-party turnover does not account for much of dynamic responsiveness.Footnote 29 Thus, while we cannot determine exactly how important within-party turnover is, the evidence supports the hypothesis that the adaptation of reelection-motivated incumbents to shifts in public sentiment is an important, and perhaps the dominant, mechanism of responsiveness.
HETEROGENEITY: TIME, REGION, AND INSTITUTIONS
In addition to operating through multiple mechanisms, dynamic responsiveness may also be stronger under certain conditions than others. In other words, there may be factors that moderate the effect of opinion on policy. Here we examine six such factors: time, region, suffrage restrictions, campaign contribution limits, reforms designed to enhance citizen participation in government, and legislative professionalism. Unlike time and region, the last four moderators are institutions that could potentially be manipulated to influence the quality of responsiveness. We emphasize, however, that the interaction effects in the analysis below are purely correlational, and nothing about the research design ensures that the effects are not confounded by other attributes of the states where these institutions were adopted. Moreover, an increase in responsiveness due to a particular institution does not necessarily imply that it makes policy more congruent with mass preferences (Matsusaka Reference Matsusaka2001). Instead, greater responsiveness could indicate overreactions to constituent preferences (Erikson, Wright, and McIver Reference Erikson, Wright and McIver1993, 93–4).
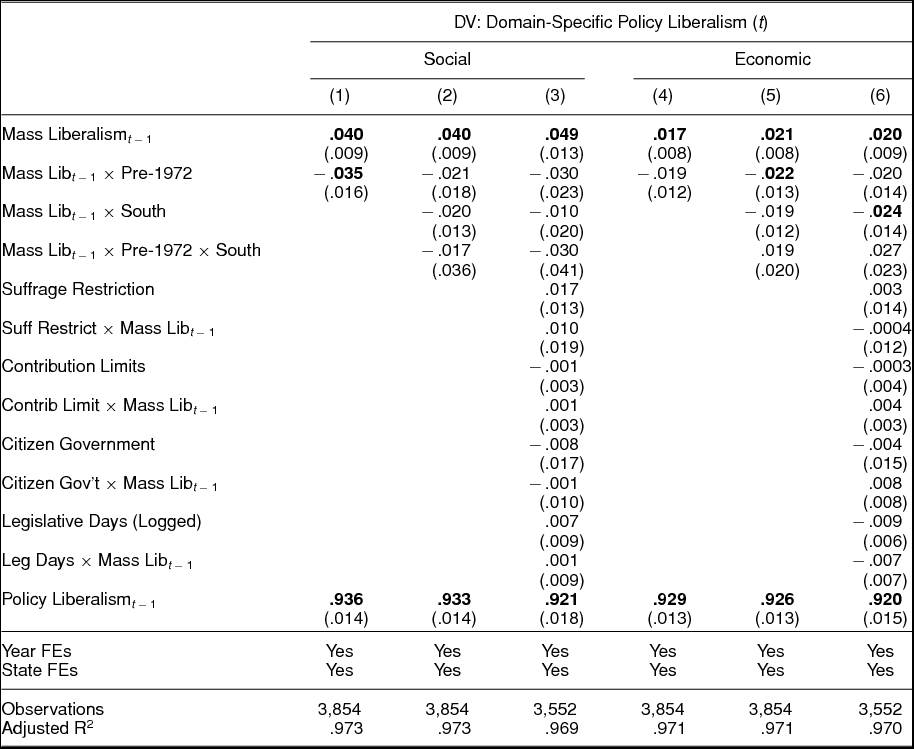
That being said, it is nonetheless interesting and important to assess whether and how dynamic responsiveness differs across contexts. The first context we examine is historical era. Has dynamic responsiveness increased over time? The answer seems to be yes.Footnote 30 We can see this most clearly in columns (1) and (4) of Table 4, which interact Mass Liberalism t − 1 with an indicator for years before 1972. On both social and economic issues, dynamic responsiveness appears to be stronger after 1972. In fact, the point estimates for the earlier period are close to 0.
Moderators of dynamic responsiveness. Standard errors are clustered by state and are robust to autocorrelation. Continuous variables are scaled to have a standard deviation of 1 across state-years. Bold coefficients are significant at the 10% level.

Why might dynamic responsiveness have increased over time? One natural hypothesis is that it was driven by the democratization of the South, which was not fully democratic until the early 1970s (Mickey Reference Mickey2015). Surprisingly, we actually find little firm evidence for this conjecture. This can be seen in columns (2) and (5), which include a three-way interaction between mass liberalism, era, and region. The estimates in the second row, which now capture temporal differences in the non-South only, are of similar magnitude to those in columns (1) and (4). The coefficients in the third row indicate that responsiveness has been lower in the South even in the post-1972 period. Moreover, the triple interaction in the fourth row provides no firm evidence that the regional gap in dynamic responsiveness was once larger than it is now. In fact, column (5) seems to suggest that, on economic issues, Southern and non-Southern states were once about equally (un)responsive, whereas in recent years dynamic responsiveness has increased in the non-South but not in the South.Footnote 31
One possible response to this puzzling finding is that undemocratic institutions such as poll taxes were not confined to Southern states, nor did all Southern states employ these devices over the entire pre-1972 period. It would be better, therefore, to examine the moderating effects of suffrage restrictions directly. By the same token, states have adopted numerous other reforms designed to limit the influence of money in politics and enhance citizens’ participation in policymaking. State legislatures have also generally become more professionalized over time, though at different rates, and this too may have influenced responsiveness.
To assess these possibilities, we examine whether the effect of Mass Liberalism t − 1 is moderated by three indices of related policies—suffrage restrictions (poll tax and literacy test), campaign contribution limits, and citizen governance (direct democracy and term limits)—and by the number of days a legislature spends in session (a proxy for professionalism). We present the analysis of these policies as indices (all centered at 0) to ameliorate the multiplicity problem of testing many interaction effects. On the whole, we find little evidence that any of the institutions we consider moderate the effect of opinion on policy. Controlling for era and region, none of eight index interactions is statistically significant. Footnote 32 Essentially the same picture emerges if we analyze each institution individually (see Supplementary Appendix H).Footnote 33
In sum, our main findings are that the dynamic effect of opinion on policy is definitely stronger in the present era than it was before 1972, and that, in the modern era, dynamic responsiveness seems to be stronger in non-Southern states. We find little evidence that any institution that we examined moderates dynamic responsiveness. Given that the interaction effects are essentially correlational estimates, however, we should not draw firm conclusions either way about the causal effect of these institutions. It is possible, for example, that reforms such as contribution limits are implemented precisely to counteract a particularly unresponsive state government, masking these reforms’ positive effects. Thus, while our results suggest that previous studies may overstate the responsiveness-enhancing effects of these institutional reforms, this is clearly an area where more research is needed.
DISCUSSION
What do our findings suggest about the character and functioning of American democracy? At the most basic level, they indicate that state policymaking responds to mass policy preferences, though more strongly on social than economic issues and more so now than in the past. Given the particularly high barriers to responsiveness in state politics—limited state control over some policies, the competitive constraints of federalism, citizens’ inattentiveness to state politics—this fact alone should provide a counterweight to more pessimistic accounts of American democracy. Our results also call into question an emerging scholarly sense, approaching a consensus, that partisan selection is the dominant if not exclusive means by which voters affect government policies. Manifestations of this quasiconsensus can be seen in theoretical work that stresses candidates’ inability to commit to moderate policies (e.g., Alesina Reference Alesina1988; Besley and Coate Reference Besley and Coate1997), causal analyses that find little evidence of adaptation or convergence in Congress (e.g., Lee, Moretti, and Butler Reference Lee, Moretti and Butler2004; Fowler and Hall Reference Fowler and Hall2016), and studies that emphasize the “leapfrog” nature of representation in the contemporary United States (e.g., Bafumi and Herron Reference Bafumi and Herron2010; Lax and Phillips Reference Lax and Phillips2012). By contrast, our finding that adaptation is a major and perhaps the dominant mechanism of responsiveness is consistent with classic studies that emphasize politicians’ attentiveness to public sentiment and their capacity and incentives to adapt to shifts in mass opinion (e.g., Mayhew Reference Mayhew1974; Arnold Reference Arnold1990; Stimson, MacKuen, and Erikson Reference Stimson, MacKuen and Erikson1995).
It should be emphasized that partisan selection is a comparatively minor mechanism of responsiveness not because party control has no policy effects, but rather because mass policy preferences explain relatively little of the variation in party fortunes. In other words, both public opinion and party control affect state policies, but variation in one is not strongly related to the other. This suggests an important qualification to the dim view, expressed by Achen and Bartels (Reference Achen and Bartels2016) and others, that the apparently weak relationship between mass liberalism and partisan fortunes implies that citizens have little influence over government policies. Rather, mass liberalism and party control seem to exert fairly independent, and roughly equally important, effects on policy change. This pattern is consistent with Erikson et al.’s (Reference Erikson, Wright and McIver1993) “statehouse democracy” model, in which the platforms of Democratic and Republican parties in a given state diverge from one another (resulting in partisan effects on policy) but are roughly centered on the state’s median voter (resulting in adaptation). Contrary to some fears, however, neither party control nor mass liberalism seems to cause dramatic swings in policymaking. Even a full switch in party control, for example, changes policy liberalism in the short term by less than a tenth of an SD. In general, large shifts in policy liberalism occur only through the compounding of many small responses to party control and mass preferences. It is the cumulation of such incremental changes over many decades that arguably accounts for the strong cross-sectional relationship between opinion and policy.
In these respects, then, our findings provide some reassurance regarding the health of American democracy. In other respects, however, our analyses are indeterminate or even pessimistic. First, since our measures of mass and state policy liberalism are not on the same scale, we cannot directly evaluate whether state policies are congruent with mass preferences at any given moment (cf. Achen Reference Achen1978; Matsusaka Reference Matsusaka2001; Lax and Phillips Reference Lax and Phillips2012). In particular, the fact that state policymaking is responsive on the margin does not preclude the existence of ideological bias in state policies. Indeed, the persistent gap in policy liberalism between Southern and non-Southern states with similar mass publics (see Figure 2) implies that the policies of at least one set of states are systematically biased in a liberal or conservative direction. Relatedly, our results do not rule out the possibility of differential responsiveness across subsets of the population, such as racial minorities or the poor (e.g., Gilens Reference Gilens2012). Finally, our analysis of institutional moderators, though hardly the final word on the subject, suggests little reason for faith in institutional reforms, at least among those that have been widely implemented at the state level, as a means of increasing (or decreasing) dynamic responsiveness.
SUPPLEMENTARY MATERIAL
To view supplementary material for this article, please visit https://doi.org/10.1017/S0003055417000533.
Replication material can be found on Dataverse at https://doi.org/10.7910/DVN/K3QWZW.





Comments
No Comments have been published for this article.