INTRODUCTION
The area of winter oilseed rape (OSR) grown in Germany has risen to about 1·5 M ha in recent years to take up 0·13 of the total arable land. This is due to its profitability, its value as a crop to precede cereals and as a feedstock for biofuel production on set-aside land. In northern Germany, up to 0·20 of the total arable land has been sown with OSR (Statistisches Bundesamt 2007). OSR demands high amounts of N fertilizer often exceeding 200 kg N/ha to achieve maximum yields, but N offtake by the seeds is comparatively low, leading to low nitrogen harvest indices and high N balance surpluses (fertilizer N minus N offtake by the seed; Shepherd & Sylvester-Bradley Reference Shepherd and Sylvester-Bradley1996; Sieling et al. Reference Sieling, Schröder and Hanus1998, Reference Sieling, Günther-Borstel, Teebken and Hanus1999; Sieling & Kage Reference Sieling and Kage2006; Rathke et al. Reference Rathke, Behrens and Diepenbrock2006; Henke et al. Reference Henke, Breustedt, Sieling and Kage2007). Excessive N fertilization rates can boost soil mineral nitrogen (NO3-N plus NH4-N: SMN) after harvest, which can lead to high N leaching rates during periods of heavy rainfall (Shepherd & Sylvester-Bradley Reference Shepherd and Sylvester-Bradley1996; Beaudoin et al. Reference Beaudoin, Saad, van Laethem, Machet, Maucorps and Mary2005). For the protection of water bodies, the implementation of the EU Nitrate Directive in Germany restricts N balance surpluses to 60 kg N/ha averaged over 3 years, starting in 2009 on the farm level. Compared to cereals, N balance surpluses of OSR can rise to more than 100 kg N/ha (Henke et al. Reference Henke, Breustedt, Sieling and Kage2007) and as a consequence the threshold of 60 kg N/ha over a 3-year rotation may be exceeded. An exact estimation of fertilizer N demand therefore becomes increasingly important, in addition to achieving high seed yields and maximum economic returns. In Germany, N fertilizers are commonly applied according to crop growth stage (Rathke et al. Reference Rathke, Behrens and Diepenbrock2006) taking SMN at the start of spring growth into account by the Nmin method (Wehrmann & Scharpf Reference Wehrmann and Scharpf1979). In general, high canopy N is considered in the calculation of N fertilization rates by subtracting a fixed value of 20 kg N/ha. However, this hardly accounts for the large variation in canopy development and corresponding N amounts taken up by the canopy that can exist before fertilization. In the UK, the Fertilizer Recommendation Handbook RB209 relates fertilizer practice to soil nitrogen supply (SNS) which incorporates estimated canopy N content for both cereal and OSR crops (MAFF 2000). An approach using balance sheets has been developed in France, which takes the mineralization of soil-borne N and the amount of N in the OSR canopy at the end of autumn growth and at the beginning of spring growth into account (Reau et al. Reference Reau, Wagner, Palleau, Borin and Sattin1994; Makowski et al. Reference Makowski, Maltas, Morison and Reau2005). The results of both UK and French systems promote a reduced N fertilization of OSR when soil and canopy N are taken into account. However, a detailed investigation of fertilization strategies under different climatic conditions is necessary and extremely important, because different boundary conditions strongly influence N dynamics in the plant-soil system and consequently N fertilization needs.
The aim of the present study was to analyse possible functional relationships between the optimum N fertilization rate (Nopt), SMN at the beginning of spring growth and the amount of canopy N at the end of autumn and beginning of spring growth.
MATERIALS AND METHODS
Field trials
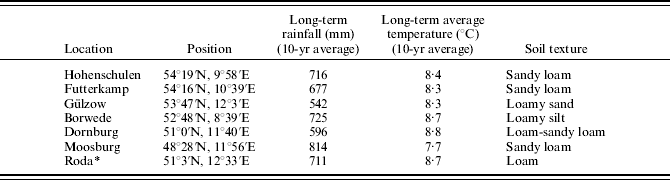
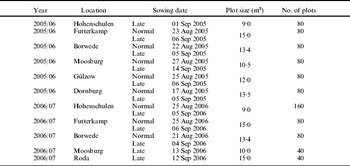
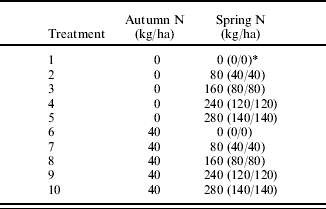
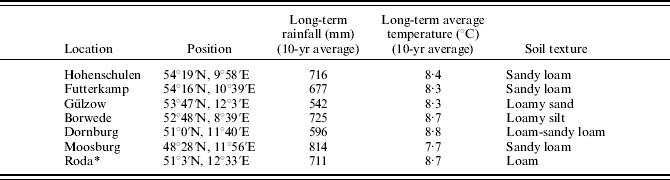
The experimental data originate from a series of field trials established in 2005/06 and 2006/07 at seven locations (Table 1) in Germany (Hohenschulen, Futterkamp, Borwede, Dornburg, Guelzow, Roda and Moosburg). The cultivar Trabant (hybrid) was grown at Futterkamp, Borwede and Dornburg, and the cultivar NK Fair (open pollinating) at Guelzow, Moosburg and Roda. At Hohenschulen, both cultivars were tested. Two different sowing dates (normal and late) and two levels of N fertilization in autumn (0 and 40 kg N/ha) were used to establish variation in canopy size in the autumn. The normal sowing was carried out from 17 to 27 August and the late one from 1 to 14 September (Table 2). Fertilizer N in autumn was applied to both sowing dates at emergence of the late sown crop. In order to estimate Nopt based on a N response curve, five different levels of N fertilization (0, 80, 160, 240 or 280 kg N/ha) were applied in the spring with half applied at the start of spring growth and half at the beginning of stem elongation (Table 3) as calcium ammonium nitrate (270 g N/kg).
Geographical position, climate and soil characteristics of field trials
* Only 2006/07.
Sowing date, plot size and number of plots of field trials in both years

Fertilization treatments (autumn/spring) in each sowing date
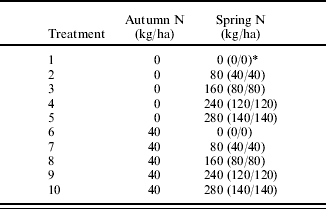
* First application at the beginning of spring growth, second application at the beginning of stem elongation.
All plots were ploughed to incorporate straw from the preceding crop (mostly barley). Fungicides and other crop management practices (e.g. herbicides and insecticides) were applied according to normal commercial practice. The design was a split-plot design with four replicates. The main factor ‘sowing date’ was not repeated within a single site, whereas the fertilization treatments (autumn and spring) were fully randomized within both sowing dates.
In both years, the trials were well developed in autumn and at the beginning of spring growth. However, due to plant losses and drought stress in several plots in spring, canopies at some locations were seriously damaged. Therefore, trials at Hohenschulen (normal sowing) in 2005/06 and at Guelzow, Dornburg, Roda and Moosburg (normal sowing) in 2006/07 were omitted from the data analysis.
Plant and soil samples were taken at the end of autumn growth (end of November) and the beginning of spring growth before the first N fertilization (end of February) in all replicates of treatments 3 and 8 in each sowing date. From the plant samples (1×1·5 m) the number of plants and the above ground dry matter (DM) were determined. Nitrogen concentration in DM was determined using near infrared spectrometry (NIRS 5000, Foss).
Soil samples for SMN (three cores per plot, bulked to one sample) were taken at the same time as plant sampling from 0 to 0·3 and 0·3 to 0·6 m horizons and stored until analysis. After thawing overnight at room temperature, NO3-N and NH4-N were extracted using 0·0333 N CaCl2 and analysed colorimetrically. The plots were harvested by combine harvester and yield was standardized to t/ha based on 90 g moisture/kg.
Statistical analysis
Because of the failure of some field trials, the data differed between years. Therefore, analysis of variance for autumn canopy N, spring canopy N and SMN in spring was done separately for each year using the GLM procedure of the SAS statistical package (SAS Institute 1989). Standard errors (s.e.d.) for sowing date were based on location×sowing date interactions, those for N fertilization in the autumn based on location×sowing date×N fertilization in autumn interaction effects.
Nopt was calculated underlying a quadratic yield response function (Colwell Reference Colwell1994; Henke et al. Reference Henke, Breustedt, Sieling and Kage2007). This function is specified by three parameters:

where Y is the seed yield (t/ha), X the N application rate (kg N/ha), a the intercept, b the linear coefficient, c the quadratic coefficient and ε the error term. The parameter values were estimated using the REG procedure of the SAS statistical package (SAS Institute 1989). Although quadratic response functions estimate higher Nopt values compared to ‘linear response and plateau’ functions or other statistical models, this function was chosen because ‘linear response and plateau’ functions systematically underestimate Nopt and overestimate yields at Nopt (Cerrato & Blackmer Reference Cerrato and Blackmer1990; Henke et al. Reference Henke, Breustedt, Sieling and Kage2007). Additionally, Henke et al. (Reference Henke, Breustedt, Sieling and Kage2007) found that quadratic response functions are more stable with regard to parameter estimation uncertainty. Nopt was defined as the rate at which maximum economic returns were produced, calculated by marginal value product=marginal factor cost=nitrogen price (Henke et al. Reference Henke, Breustedt, Sieling and Kage2007). The assumed market price for OSR was 470 €/t and for N 1·00 €/kg N.
Regression analyses of Nopt on the measured parameters SMN at the start of spring growth, canopy N in autumn and canopy N in spring were done using the GLM procedure of the SAS statistical package (SAS Institute 1989). All locations and years were pooled for each regression analysis. The regression model was:

where Y is Nopt, X canopy N in autumn, canopy N in spring or SMN in spring, a the intercept and b the linear coefficient. In an initial covariance analysis the interactions year×location, all three measured parameters (SMN at the beginning of spring growth, canopy N in autumn, canopy N in spring)×location, all three measured parameters×year and all three measured parameters×location×year were not significant (P>0·05). As a consequence, these interactions were omitted in the regression model. The effect of year was also not significant (P>0·05) and was therefore not considered in the regression model. The location effect was significant (P<0·05) and therefore the intercept a was estimated separately for each location.
RESULTS
Canopy N in autumn, canopy N in spring and SMN in spring
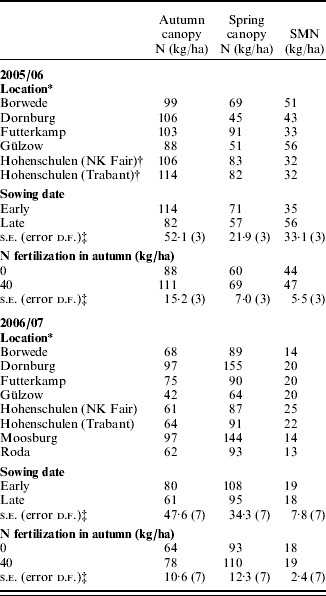
In 2005, the canopy in autumn had accumulated 114 kg N/ha in the plots sown at the normal time and 82 kg N/ha in the late sown ones (Table 4); but this difference was not significant. Nitrogen fertilization in autumn significantly (P<0·05) increased canopy N from 88 to 111 kg N/ha in autumn 2005. Leaf losses during winter 2005/06 significantly (P<0·05) lowered canopy N in spring compared to autumn, decreasing from 114 to 71 kg N/ha in the normal sowing date and from 82 to 57 kg N/ha in the late sown treatment. Differences between the sowing dates were not significant. The mean decrease over winter was 28 kg N/ha in the treatments without autumn N fertilization and 42 kg N/ha in treatments with autumn N. Canopy N in spring 2006 differed significantly (P<0·05) between the autumn N fertilizer treatments. SMN in the spring of 2006 was significantly different (P<0·05) between the normal (35 kg N/ha) and late (56 kg N/ha) sowing dates, but was not affected by autumn N fertilization.
Autumn and spring canopy N (kg/ha) and soil mineral N (SMN, 0–0·6 m) in spring (kg/ha) at all locations in 2005/06 and 2006/07

* No error estimate possible.
† Only data of the early sowing date, trials were omitted for statistical analyses.
‡ Standard errors for sowing dates are based on location×sowing date interactions, those for N fertilization in autumn based on location×sowing date×N fertilization in autumn interactions.
In autumn 2006, sowing date did not affect above ground N accumulation. In the unfertilized treatments, autumn canopy N was 64 kg N/ha on average. Nitrogen fertilization in autumn significantly increased canopy N in autumn by 14 kg N/ha. During winter 2006/07, leaf losses were minimal because severe frosts did not occur and as a consequence, crops continued to accumulate N until spring, and canopy N rose significantly (P<0·05) from 80 to 108 kg N/ha in the normal sowing date and from 61 to 95 kg N/ha in the late sowing date. On average, canopy N in spring 2007 differed significantly (P<0·05) between 93 kg N/ha in the unfertilized treatment to 110 kg N/ha in the fertilized treatment. Differences in SMN in spring were small and not statistically significant.
Regression of Nopt on canopy N in autumn and spring and SMN in spring
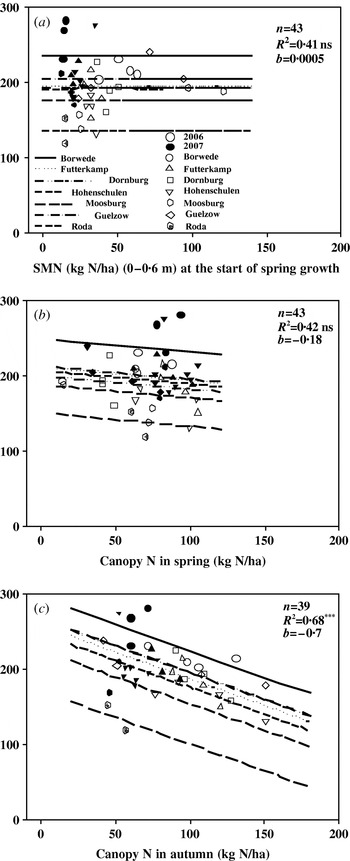
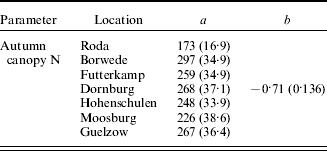
The level of estimated Nopt between the locations differed remarkably (Fig. 1, Table 5) ranging from 120 kg N/ha at Roda in 2007 to 283 kg N/ha at Borwede in 2007. The regression line of Borwede lies clearly above that of Roda. The difference between the regression lines of Borwede and Roda is 124 kg N/ha in the regression of Noptv. canopy N in autumn. The regression lines of all other locations are intermediate.
Regression of Nopt (y-axis) (a) on SMN at the start of spring growth, (b) on canopy N in spring and (c) on canopy N in autumn for seven experimental locations in Germany in 2 years.

Intercept (a) and linear coefficient (b) of the regression Nopt v. autumn canopy N (s.e.±), model: Y=a(location)+bX
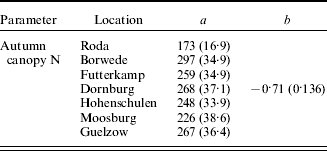
Regression analyses showed no significant relationship between Nopt and SMN at the start of spring growth (Fig. 1a) or between Nopt and canopy N in spring (Fig. 1b). However, Nopt and canopy N in autumn correlated significantly (Fig. 1c). The slope of the regression line (−0·7) indicates a negative correlation between canopy N in autumn and Nopt in spring (Fig. 1c). Canopy N in autumn was the only parameter revealing a significant relationship to Nopt in spring in the regression analysis (Table 5).
DISCUSSION
The aim of the present study was to investigate the relationship between the optimal amount of spring N fertilization (Nopt), SMN at the beginning of spring growth, canopy N in autumn and in spring under different environmental conditions in Germany in order to improve site-specific N fertilization.
Variation in canopy size in the autumn was achieved by varying the sowing date and autumn N fertilization. Since spring N fertilization was the same for all sowing date×autumn N combinations, treatments with autumn N received 40 kg N/ha more than those without autumn N. This additional N increased autumn and spring canopy N as well as SMN in autumn, especially in the late sown plots (data not shown). However, on average of all sites, autumn N did not significantly increase seed yield (0·06 and 0·07 t/ha in 2006 and 2007, respectively). In addition, the autumn N×spring N interaction on seed yield was not significant.
Compared to cereals, OSR has the potential to take up large amounts of N with more than 100 kg N/ha in autumn, as reported by several authors (Reau et al. Reference Reau, Wagner, Palleau, Borin and Sattin1994; Sieling Reference Sieling2000). The 2 years of field trials conducted in the present study were favourable for OSR autumn growth because the accumulated temperature from September to the end of November was exceeded in 2005/06 by 160°C days and in 2006/07 by 280°C days when compared to the long-term average (1974–2004). As a consequence of the favourable weather conditions, OSR was able to take up large amounts of N in autumn.
Mineralization of soil organic N over winter under the climatic conditions experienced in Germany is usually quite low, but leaching losses occur regularly. Therefore, the amounts of SMN are likely to decrease over winter and differences in SMN between fields at the beginning of spring growth are smaller compared to those at the end of autumn (Sieling et al. Reference Sieling, Günther-Borstel, Teebken and Hanus1999). In the present study, SMN at the beginning of spring growth averaged over all treatments and locations was 41 (24–70) kg SMN/ha (except for three sites with SMN>70 kg/ha) in 2005/06 and 19 (10–35) kg SMN/ha in 2006/07. The low amounts of SMN at the beginning of spring growth, together with a small variation between sites and/or treatments, are unlikely to be a suitable indicator for calculating N fertilization rates in OSR. The regression analysis showed no relationship between SMN at the start of spring growth and Nopt in spring.
For farmers, it is normally expensive and time-consuming to determine DM and crop N concentration separately in order to calculate canopy N. In France, an approach has been developed to roughly estimate canopy N from the crop fresh matter, which can easily be measured by farmers (H. Hébinger 2004, personal communication). Estimating canopy N by weighing a defined area of crop with several replications is based on the assumption that DM content and crop N concentrations vary little during early growth stages in autumn and in late winter before stem elongation starts. Reau et al. (Reference Reau, Wagner, Palleau, Borin and Sattin1994) found a nearly constant N concentration of 45 mg N/g DM in late winter. Colnenne et al. (Reference Colnenne, Meynard, Reau, Justes and Merrien1998) described a critical N dilution curve for winter OSR with a constant N concentration of 44·8 mg N/g DM before stem elongation. N concentration decreased when DM (t/ha) exceeded 1 t DM/ha following the equation Nconc=4·48 W−0·25, where Nconc is the N concentration in the aerial DM (expressed as % N) and W the shoot DM (t/ha). Results from several trials published by Sieling (Reference Sieling2000), Sieling & Kage (Reference Sieling and Kage2008) and Henke (Reference Henke2008) revealed an average N concentration of 45 mg N/g DM in aerial biomass, confirming the results of Reau et al. (Reference Reau, Wagner, Palleau, Borin and Sattin1994) and Colnenne et al. (Reference Colnenne, Meynard, Reau, Justes and Merrien1998). Assuming a DM content of 100 g/kg and N concentration of 45 mg/g DM, N uptake (kg N/ha) can be calculated by multiplying the fresh matter (kg/m2) by a conversation factor of 45 (Henke Reference Henke2008).
Leaf losses and consequently N losses over winter highly influence canopy N at the beginning of spring growth (Bilsborrow et al. Reference Bilsborrow, Evans and Zhao1993; Dejoux et al. Reference Dejoux, Meynard, Reau, Roche and Saulas2003). In the present study, canopy N at the beginning of spring growth varied largely especially in the 2006/07 season (65–115 kg N/ha). In 2005/06, N losses due to leaf losses occurred, whereas in 2006/07, N in the canopy increased during winter because of continued plant growth. This high variability could be a simple explanation for the missing relationship between canopy N in spring and Nopt. In contrast, regression results showed that there was a significant negative relationship between canopy N in autumn and Nopt. The slope of this regression was −0·7, indicating that these N amounts should at least partly be taken into account when calculating N fertilization rates. Experimental results about the impact of canopy N in autumn or at the beginning of spring growth on Nopt are scarce. Gabrielle et al. (Reference Gabrielle, Denoroy, Gosse, Justes and Andersen1998) and Dejoux et al. (Reference Dejoux, Meynard and Reau1999, Reference Dejoux, Recous, Meynard, Trinsoutrot and Leterme2000) reported N losses caused by leaf losses due to frost over winter. Dejoux et al. (Reference Dejoux, Recous, Meynard, Trinsoutrot and Leterme2000) found a recovery of the N losses over winter by the OSR crop in spring of about 0·40 under the climatic conditions of their experimental site located in the Paris Basin (France). This recovery could be explained by the synchronization of lost leaf decomposition and N uptake by OSR in spring (Dejoux et al. Reference Dejoux, Recous, Meynard, Trinsoutrot and Leterme2000) as the N is quickly mineralized and available for uptake in spring. On the other hand, Dejoux et al. (Reference Dejoux, Recous, Meynard, Trinsoutrot and Leterme2000) also estimated the fraction of gaseous N losses from the unrecovered 15N to be 0·4 of N applied with frozen leaves. These results indicate that N from lost leaves over winter is likely to be recovered in spring to some extent and as a consequence N fertilization rates can be reduced. This recovery potential is totally neglected when canopy N in spring is used as an indicator for N fertilization rates in spring. Additionally, Dejoux et al. (Reference Dejoux, Meynard, Reau, Roche and Saulas2003) reported that differences between canopies which varied largely in autumn growth decreased during the course of the winter. Consequently, N fertilization rates would be over-estimated if canopy N in spring was used for deriving N fertilization rates. For these reasons, canopy N in autumn seems to be more suitable compared to canopy N in spring when deriving N fertilization rates in spring. Besides the recovery of N derived from fallen leaves in spring, N uptake of unfertilized OSR canopies in autumn could be an indicator for the N mineralization potential of the location. In the case of insignificant leaf losses over winter, a well-developed canopy showed a higher leaf area index (LAI) at the beginning of spring growth than a poor canopy, which, as a consequence, allows for reduced N fertilization rates (Mendham et al. Reference Mendham, Shipway and Scott1981).
The present results, based on 2 years and several sites in Germany, revealed no effect of SMN (0–0·6 m) in spring on Nopt, presumably because of the low values and their small variation. This can be partly due to the fact that the sites showed similar soil types and that mostly barley was grown as preceding crop leaving only small amounts of N in the soil. However, in humid climates SMN under OSR at the beginning of spring growth is quite low in most of the years, due to crop uptake and/or N leaching during winter, whatever the amount of SMN in autumn (Sieling Reference Sieling2000). In some years and/or sites, SMN might be high at the start of spring growth, e.g. low winter rainfall, cool conditions, etc., so this should be taken into account. In order to identify these situations, further investigations at more sites and over a longer period are needed.
According to the present study, canopy N in autumn seems to be a suitable indicator for optimizing N fertilization rates. For instance, at Futterkamp calculated Nopt was 150 kg N/ha when canopy N in autumn was 120 and 210 kg N/ha when canopy N in autumn was 53 kg N/ha. However, differences in Nopt between the different locations varied largely. Different yield levels could not account for the tremendous Nopt differences. For instance, at Borwede OSR yielded 5·0 t/ha in 2006 and 3·3 t/ha in 2007 averaged over all treatments; however, the relationships between Nopt and N amounts in autumn seem to be similar. In both years, yields at Futterkamp were higher, but the Nopt level was lower than at Borwede. Detailed investigation of the N mineralization potential in spring at the experimental sites and further yield analysis could contribute to the site-specific characteristics in the N response of OSR. In general, indicators considering soil mineralization dynamics are not easily introduced in practical N fertilization recommendations and must be an important research topic in future. Nevertheless, although it is not possible to give absolute recommendations, the derived relationship between Nopt and canopy N in autumn seems to warrant further consideration for a relative correction of site-specific usual fertilizer rates which correspond to long-term average canopy development and corresponding canopy N in OSR. However, besides a reduction of N fertilization if canopy N is high, the present study does not indicate that N fertilizer rates need to be increased if canopy N in autumn is very poor.
The conclusions from the results of the trials conducted in the present study (which were carried out on similar soils and following mostly barley as preceding crop), showed amounts of SMN at the beginning of spring growth were usually low with only small variation and, therefore, no relationship between SMN at the beginning of spring growth and Nopt could be observed. Additionally, no significant correlation between canopy N in spring and Nopt were determined. However, in the present investigations, canopy N in autumn was significantly correlated with Nopt. Farmers could roughly estimate canopy N (kg N/ha) by a simple field method which consists of weighing fresh crop biomass from a 1 m2 area and multiplying by a conversion factor of 45. Together with the canopy N estimation method, canopy N in autumn should be taken into account when deciding the optimal N fertilization rates in spring. The implementation of this approach into practical use by farmers is based on an average OSR canopy with 50 kg N/ha accumulated in the autumn which will be fertilized in spring according to the official recommendation (e.g. 200 kg N/ha). Each kg N/ha exceeding the threshold of 50 kg N/ha reduces the N fertilization in spring by 0·7 kg N/ha. However, it is not possible to give absolute recommendations.
The authors thank Dr Gerhard Rave for providing the statistical analysis. Furthermore, we thank Mrs Jutta Gronow for collecting the yield data and supervising the field trials and Dr Ralf-Rainer Schulz, Dr Gerhard Baumgärtel, Dr Erhard Albert, Mr Torsten Graf and Mr Andreas Baer for their collaboration conducting the field trials. This project was kindly funded by the Union zur Förderung von Öl- und Proteinpflanzen e.V. (UFOP).