Introduction
Several memorable moments of the 2012 US presidential election campaign featured arguments over a yellow puppet. During a debate between the candidates, PBS journalist and moderator Jim Lehrer challenged Republican nominee Mitt Romney to state specific ways he would reduce the federal budget deficit. Romney replied he would eliminate government funding for public broadcasting:
I’m sorry, Jim, I’m going to stop the subsidy to PBS…. I like PBS, I love Big Bird…. [But] I’m not going to keep on spending money on things to borrow money from China to pay for. That’s number one
(Commission on Presidential Debates, 2012).
Romney’s proposal set off a storm of protest, but his remarks raise a legitimate issue. In fiscal year 2009, the US Corporation for Public Broadcasting received $400 million in federal appropriations (Corporation for Public Broadcasting, 2012). Public broadcasters in other countries receive far more. For example, the Canadian Broadcasting Corporation received US $925 million in government support for operating subsidies alone that year, (CBC-Radio Canada, 2009) while the British Broadcasting Corporation took in US $6.45 billion in subsidies for 2008 (BBC, 2008). Romney questioned whether a country gets anything for that taxpayer money that commercial broadcasting cannot provide.
This article suggests broadcasting subsidies create better informed and more equally informed citizens. Although other authors have suggested as much (Soroka et al., Reference Soroka, Andrew, Iyengar, Curran, Coen, Hayashi, Jones, Mazzoleni, Woong Rhee, Rowe and Tiffen2013), I build on previous work by specifically identifying structures that differentiate public broadcasters from commercial broadcasters and precisely analyze the effects that those structures have on political knowledge. The key insight is that public broadcasters that rely on government subsidies can break out of the shareholder-profit model embraced by commercial broadcasters. This consistent revenue stream allows them to focus on goals other than attracting the largest audience and provide more political coverage. This in turn creates higher levels of political knowledge among viewers of public broadcasting and works to blunt knowledge variations created by differences in class and political interest.
Foundational assumptions about political information and sources
Two assumptions are necessary to proceed:
-
1. Citizens need political information to make decisions and
-
2. They get a portion of their political information from mass media, specifically broadcast media.
I critically examine these assumptions in this section.
On the first assumption, much research argues that majorities of citizens possess little political knowledge and use party affiliation as a filter in making political decisions, limiting the role political information plays in decision making (Campbell et al., Reference Campbell, Converse, Miller and Stokes1960; Converse, Reference Converse1964). Since then, many political scientists have argued that low-information voters make use of similar cues and act as they would as if they were high-information voters (Lupia, Reference Lupia1992; Sniderman et al., Reference Sniderman, Brody and Tetlock1993; Lupia, Reference Lupia1994; Lupia and McCubbins, Reference Lupia and McCubbins1998). Other works have additionally argued that low-information voters do not matter because their choices amount to random noise that does not interfere with the true preference of the electorate (Page and Shapiro, Reference Page and Shapiro1992).
However, even this work acknowledges that some political information is necessary for a voter to make her preferred choice. Lupia (Reference Lupia1994) recognizes voters need to know the cue in order to effectively use the shortcut. This need is especially vital when political leaders manipulate policy proposals to hide their true costs for voters (Bartels, Reference Bartels2005; Hacker and Pierson, Reference Hacker and Pierson2005). Furthermore, other research challenges the ideas that cues allow low-information voters to fully behave like their more knowledgeable counterparts (Batels, Reference Batels1996). Other work finds that imputing high levels of knowledge to all voters leads to significant shifts of public opinion on fiscal policy, reflecting the new weight of low-information voters, who tend to be poorer (Althaus, Reference Althaus1996). Field experiments also suggest that citizens’ beliefs change based on their levels of political knowledge (Fishkin, Reference Fishkin1996; Luskin et al., Reference Luskin, Fishkin and Jowell2002). Based on these works, it seems reasonable to assume that information plays an important role in helping citizens make political decisions.
On the second assumption, citizens have to get much of their political information from professionalized mass media because it is impossible for all citizens to deliberate simultaneously in a modern democracy (Page, Reference Page1996). Survey data show that many individuals report receiving political information from the media. Print media retains influence among certain sectors of the media, especially in northern European countries. Internet news consumption is increasing rapidly in industrialized countries, especially among younger viewers. However, television remains the mass media of choice for a large share of residents of industrialized democracies, as the Eurobarometer data show (Papacostas, Reference Papacostas2010). Surveys in the United States show since the early 1960s that a majority of respondents have reported getting their political information from television (Chafee and Kanihan, Reference Chafee and Kanihan1997).
Defining public and commercial broadcasters
Before proceeding, we still face the definitional issue of what a public broadcaster is and what sets it apart from a commercial broadcaster. Past scholarship on the effects of public broadcasting merely provides a fuzzy definition at best.
Some authors use an ad hoc ‘I know it when I see it’ conception of public broadcasting. For example, Iyengar et al.’s (Reference Iyengar, Curran, Brink-Lund, Salovaara-Moring, Hahn and Coen2010) recent work simply identifies PBS, the BBC, and certain TV stations in Denmark, Finland, and Switzerland as public broadcasters. Though their classifications are defensible, their lack of clear definition of commercial and public broadcasters muddles scholarship.
Most attempts at more formal definitions note that there is an element of state regulation or ownership implied by public broadcasting. For example, Hallin and Mancini (Reference Hallin and Mancini2004: 41) state that public broadcasting is perhaps the most important form of ‘state intervention’ in the media. Djankov et al. (Reference Djankov, McLiesh, Nenova and Sheifer2003) examine patterns of media ownership among newspapers and television outlets in 97 countries of varying countries and uses majority ownership to determine whether or not a system is public or private. Baek (Reference Baek2009) later uses these classifications as a way to determine whether or not markets, dominated by public broadcasting, increase political knowledge.
But noting that public broadcasting involves state intervention lacks completeness. State intervention is not public broadcasting. For example, regulations like libel, right-of-reply, and shield laws exist independently of public broadcasters (Hallin and Mancini, Reference Hallin and Mancini2004: 43). Nor would state-dominated broadcasters like North Korean television fit well in the concept of public broadcasting, as audiences in developed democracies understand it.
To bring some clarity, I identify three key components to delineate a public broadcaster from a commercial broadcaster:
-
1. Public broadcasters are non-profit. A broadcaster might have goals unrelated to making a profit, including informing the public and providing cultural enrichment. Public broadcasters emphasize these goals over financial gain.
-
2. Public broadcasters have broad government involvement in their management, though not necessarily direct government ownership or funding. The BBC, for example, was a public corporation, though it now is officially a non-profit trust, and the governing board is appointed by Parliament.
-
3. Though there is a great deal of government involvement, public broadcasters have insulation from direct governmental interference. This part of the definition sets public broadcasters apart from state broadcasters. All public broadcasters have a charter or legal guarantee that provides editorial independence from the government. Beyond the charter, insulation takes a wide variety of forms, including an independent funding stream, long-term appointments to the board of governors and requiring a parliamentary supermajority to appoint board members to the broadcaster. Many broadcasters use multiple forms.
In contrast to the varied goals of public broadcasters, commercial broadcasters exist to make money for shareholders and generally fund themselves through advertising (like American free-to-air stations) and subscriber fees (some cable channels). They are subject to state regulations like libel laws, but do not have state-appointed officials sitting on their boards or have public employees making programming decisions.
Commercial competition, public broadcasting, and programming incentives
Commercial broadcasters and public broadcasters have different incentive structures for how to construct the news. These incentives I predict, in turn, will generate different outcomes for political knowledge among their viewers.
Focus on profit and a need for advertising revenues creates incentives among commercial broadcasters to reduce public affairs coverage. Increasing competition merely exacerbates pressure to chase an audience. Zaller finds clear evidence of this trend in noting that American managers have drastically decreased the time dedicated to public affairs in the news programs of local TV stations since 1960 (Zaller, n.Reference Zallerd.: 37–52). Other scholars have documented that commercial broadcasters have lower shares of news shows during prime time than their public broadcasting counterparts (Aalberg et al., Reference Aalberg, Van Aelst and James2010). Additionally, commercial broadcasters cover more ‘soft’ news stories than ‘hard’ news in their news programs (Iyengar et al., Reference Iyengar, Curran, Brink-Lund, Salovaara-Moring, Hahn and Coen2010).Footnote 1
The story is more complicated for public broadcasters. Despite having non-profit missions that diverge from their commercially oriented counterparts, public broadcasters still require capital. The operating cash source will be a critical determinant of the type of programming a public broadcaster airs, and the resulting level of political knowledge in its coverage area. On one end of the spectrum are public broadcasters that obtain most of their funding from selling advertising. On the other end of the spectrum are countries whose revenues come entirely from the government in the form of a license fee or parliamentary appropriation. Most public broadcasters fall between these extremes.
Therefore, public broadcasting outlets that lack the insulation of government funding should behave similarly to commercial broadcasters in their programming decisions because they are subject to very similar pressures that commercial broadcasters are. As a result, these unsubsidized outlets should provide similar amounts of political information as commercial outlets. In turn, viewers of unsubsidized outlets should end up with similar levels of political knowledge as viewers of commercial broadcasters.
However, broadcasters with partial or complete insulation from commercial pressures ought to provide a greater amount of political information (in line with the goals of their charters to educate and inform the population). This reality has been observed by several researchers (Brants, Reference Brants2004; Aalberg et al., Reference Aalberg, Van Aelst and James2010; Iyengar et al. Reference Iyengar, Curran, Brink-Lund, Salovaara-Moring, Hahn and Coen2010; Soroka et al., Reference Soroka, Andrew, Iyengar, Curran, Coen, Hayashi, Jones, Mazzoleni, Woong Rhee, Rowe and Tiffen2013). In turn, this information-rich environment will diffuse into viewers and increase political knowledge, as numerous scholars have shown (Zukin and Snyder, Reference Zukin and Snyder1984; Jerit and Barabas, Reference Jerit and Barabas2006; Iyengar et al., Reference Iyengar, Curran, Brink-Lund, Salovaara-Moring, Hahn and Coen2010; Soroka et al., Reference Soroka, Andrew, Iyengar, Curran, Coen, Hayashi, Jones, Mazzoleni, Woong Rhee, Rowe and Tiffen2013).Footnote 2 In sum, public broadcasting only helps to increase levels of public knowledge if it has a significant non-advertising funding source. I call this prediction the ‘subsidy hypothesis’.
Additionally, I posit that the information-rich environment provided by subsidized public broadcasters will level the gap in knowledge between those citizens who are very interested in politics and those who are not (Iyengar et al., Reference Iyengar, Curran, Brink-Lund, Salovaara-Moring, Hahn and Coen2010). I expand this logic to suggest that subsidized public broadcasters will also decrease the knowledge gap that exists between high- and low-income individuals, as well as those of different education levels (Robinson and Levy, Reference Robinson and Levy1996). Finally, I also hypothesize that subsidies will narrow the gender gap in knowledge that exists between men and women identified by several scholars (Nadeau and Niemi, Reference Nadeau and Niemi1995; Mondak and Anderson, Reference Mondak and Anderson2004). I call this the ‘neutralization hypothesis’.
Cases and data
Western Europe makes an ideal place to test these hypotheses. Fourteen of the region’s members are both in the European Union (EU), therefore surveyed by the Eurobarometer, and have a national public broadcaster. The Eurobarometer fits this project well because it contains large representative national samples for each EU country, which allows analysis of both within-country and cross-national variation. While developing this project, I reviewed every survey fielded by the organization between 1970 and 2010 to check for measures that would allow me to test my hypotheses on public broadcasting consumption and political knowledge. After an initial cursory review, I cataloged potential political knowledge questions in 22 waves of the study. Following this analytical process, I determined that two studies, 52.0 (Melich, Reference Melich1999) and 65.2 (Papacostas, Reference Papacostas2006), provide workable measures of media consumption, political knowledge, and other individual-level socioeconomic data needed to test the subsidy and neutralization hypotheses.
Measuring knowledge
Defining and measuring the dependent variable of political knowledge is a tricky business. Early work by Converse (Reference Converse1964) focused on political ideology, defined as citizens’ ability to relate their beliefs on individual issue domains together into a coherent political philosophy. Later critics rethought the ideological focus and also moved to untangle many discrepancies of what constituted political knowledge across studies. Reformers suggested a renewed focus on measurement and a more thorough development of the concept of political knowledge or sophistication. Luskin (Reference Luskin1987) developed and later tested (1990) a unifying concept of political sophistication as the combination of three distinct concepts: the raw number of political facts a person possesses, the range of domains across which a citizen possesses facts, and the number of connections between facts.
But precisely which facts are most important to developing political sophistication? Is knowing who the Vice President is or understanding that the Supreme Court can rule on the constitutionality of laws a better measure of political sophistication? Drawing from a survey of experts, Delli Carpini and Keeter (Reference Delli Carpini and Keeter1993) theorize that citizens should understand four fundamental concepts in order to be considered politically sophisticated:
-
1. Who their leaders are.
-
2. Basic political institutions in their society.
-
3. Which parties and leaders control which institutions.
-
4. Political economy and history.
Fiske et al. (Reference Fiske, Lau and Smith1990) also note similar important factors in political knowledge, emphasizing not only being able to identify leaders, but also the stances of political leaders and groups. Although general political knowledge does help predict the voting patterns and issue stances of citizens, knowledge of specific issues areas (logically) makes a large difference in citizen stances on policymaking issues in those areas (Gilens, Reference Gilens2001).
These two conceptions lead to a pair of common ways to measure knowledge. The first method uses a set of factual questions to build an index or scale to measure the variation in correct answers among respondents (e.g. Althaus, Reference Althaus1996). The second method asks citizens to rate the ideological placement of groups or leaders on a scale, then compares those ratings with master scales based on party manifestos or experts (e.g. Gordon and Segura, Reference Gordon and Segura1997). I use the former method here.
However, creating questions of similar difficulty across countries also complicates evaluating comparative political knowledge because the importance of a question varies across countries. It would be inappropriate, for example to conclude Zambians knew more about politics than Mexicans because they could identify their president of Zambia more often than a Mexican could. Differing political institutions across countries also creates problems of comparison. It would be inappropriate to compare two countries’ knowledge of their respective presidents when one country is a presidential system in which the president is both the head of government and the head of state (like Brazil), and the other is a parliamentary-based system in which the president is merely the head of state (like Germany).
The Eurobarometer partially overcomes this obstacle. First, researchers specifically design the survey to measure citizens’ attitudes toward the EU. Therefore, some of the knowledge questions investigate facts about political institutions common to all member states. Second, other measures ask about national offices of similar importance across countries. Asking respondents to identify the finance minister of their national government is a comparable measure across countries because the finance minister is an important member of a cabinet.
The 1999 Eurobarometer asks respondents four questions regarding their knowledge of political leaders. Two questions focus on EU-level policymakers and ask respondents to identify their own country’s appointed representative on the European Commission as well as the Commission’s president. Two additional questions evaluate the respondents’ knowledge of domestic political leaders, asking the identity of their country’s finance minister and foreign minister. The 2006 version of the Eurobarometer contains items that assess respondents’ knowledge of the political institutions of the EU, another relevant dimension of political knowledge. The survey uses two true–false questions regarding the number of EU members and whether or not the European Parliament has direct elections. A third true–false question asks respondents if the EU spends a majority of its budget on administrative costs.
To adapt these knowledge measures to my purposes, I score correct answers as ‘1’, and incorrect and ‘don’t know’ answers as ‘0’. I then group the scores on each question into an additive index of political knowledge, which is a five-point index for the 1999 data and a four-point one for the 2006 data. Higher scores indicate greater political knowledge. Since these items vary in terms of difficulty, we would not expect the answers to be highly correlated and therefore the index is closer to a Guttman scale, with those correctly answering the most difficult questions also able to answer the less difficult ones.
Measuring media use
To measure the independent variable, I use the Eurobarometer data to develop a dichotomous measure differentiating those who view some public television from those who report they watch none. First, I identified each television outlet, roughly a dozen in each of the 14 countries, as commercial or public service. From there, I coded each respondent’s reported television consumption. Any respondent who reported watching a public television station regularly scored ‘1’ and those who report only watching commercial television stations as a ‘0’.Footnote 3 People who reported watching no television were recoded as missing values.
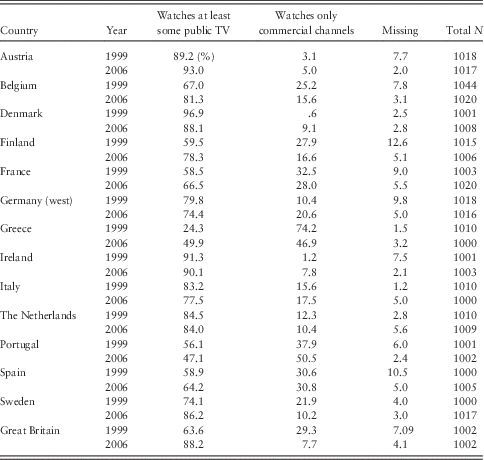
I call this measure ‘public viewership’. Note, that the public viewership variable does not provide a fine-grained measure of exposure: the surveys do not ask detailed questions regarding time spent watching each channel; nor do they track television viewing through diaries or direct measurement. Table 1 shows the results of this coding scheme and merits several observations. First, these results do not represent the ‘share’ of public broadcasting – the percentage of households watching television tuned in to public broadcasting at any given instant. Instead, the measure shows the ‘reach’ – a statistic that denotes how many households actually tune into public broadcasting at least occasionally during a given period of time, usually measured as a week or month. Second, each country has enough variation to conduct meaningful statistical tests. Finally, at least 90% of the respondents in each country report watching some television, indicating that meaningful sample sizes remain to test the relationship between public viewership and political knowledge for each country.
Distribution of television consumption in Western Europe

One final point: a subtle difference in question wording between the two surveys will create different results between the two studies. The 2006 study requests that respondents identify the television channels they spend some time watching 5 days a week or more, while the 1999 survey more specifically inquires which TV channels respondents watch regularly for news programs. Since news is one of the major providers of political information on the air waves and the 1999 question asks which channels respondents watch to encounter news, this item measures attention, which is more strongly correlated with knowledge as opposed to potential exposure, which is less correlated with knowledge (Chaffee and Schleduer, Reference Chaffee and Schleduer1986). Therefore, the 1999 question functions more effectively to reveal connections between public broadcasting and political knowledge, while the analysis using the 2006 question will show muted or null results.
Modeling subsidies for public broadcasters
The moderating variable in my study is the public broadcasting funding source for the 14 countries in my data set, which I call ‘subsidy’. Because detailed information is not readily available for more than half of the 14 countries during the period of my analysis, I dichotomously operationalize this country-level variable. Countries that fund their public broadcasters entirely through advertising score ‘0’, while countries that partially or completely subsidize their public broadcasters score ‘1’. I classify systems funded at least in part by a dedicated license fee, sales taxes, or general government revenues as subsidized. Neither Spain nor Portugal subsidized their systems during the time period of this study. Subsidies for the other countries ranged from about 45% of revenues for Ireland and Italy to more than 95% for Britain and Sweden.
Socioeconomic and demographic variables
To control for omitted variable bias, I incorporate measures for several individual-level variables known to correlate with political knowledge in past studies: political interest, gender, education, and socioeconomic status.
More interested citizens will do more research and have more (at least basic) political knowledge. It also seems that a measure of political interest captures at least some of the positive effect that partisan affiliation has on basic levels of political knowledge, first found by Converse (Reference Converse1964). I use a single question inquiring how often respondents discuss politics with friends to measure political interest. The item contains three responses: never, occasionally or frequently, which I code 0, 1, and 2, respectively. Therefore, the political discussion variable should have a positive relationship with political knowledge. This measure also matches one part of the two-item index that Iyengar and his colleagues use in their 2010 study on public broadcasting.
Gender also correlates with political knowledge. Men on average have higher levels of political knowledge than women, even when controlling for income and education (Nadeau and Niemi, Reference Nadeau and Niemi1995). In this analysis, gender is a dichotomous variable with males assigned a score of ‘1’ and females scored as a ‘0’. Due to this coding, gender should positively correlate with political knowledge.
Highly educated individuals tend to have a larger storehouse of facts on which to draw and superior training in making connections between those facts, which is the foundation of political knowledge (Luskin, Reference Luskin1987). In each of the two surveys, respondents note the age at which they left school, which corresponds to the educational attainment of most individuals, regardless of the differing degree programs and systems offered across different European countries. From the responses, I construct nine-point ascending indices of education with people who had left school prior to age 14 scoring a 1 and those who finished their schooling at age 22 or above scoring an 8. I code individuals between the ages of 15 and 22 reporting that they are still a student as having left school at that age, to reflect their rough current state of education. This education measure should correlate positively with knowledge.
Economic status correlates with political knowledge (Nadeau and Niemi, Reference Nadeau and Niemi1995). Measuring socioeconomic status among the residents of European countries contains potential pratfalls due to differing purchasing powers within various countries. The 1999 and 2006 studies use two separate ways to get at the concept. In 1999, the Eurobarometer asked respondents to identify their monthly household incomes on a 12-point scale adjusted to the local currency and economic standards, with higher points on the scale associated with higher income brackets. The 2006 survey takes a different approach and asks individuals if they own a list of eight common consumer items like televisions, DVD players, cars, and Internet service. I construct a six-point additive socio-economic status status index from these measures with a higher score indicating greater levels of goods ownership.Footnote 4 Both the 2006 goods measure of wealth and the 1999 income measure should positively correlate with political knowledge. I call the 1999 variable ‘income’ and the 2006 variable ‘wealth’, in tables because of their distinctive measures. In the text, however, I use the terms ‘income’, ‘wealth’, or ‘socioeconomic status’ interchangeably.
Finally, I control for country-level sources of variation in my data. First, the EU has participants that do not participate in the common currency, the Euro. Countries in the Eurozone may have citizens who pay closer attention to the affairs of the EU, due to the stronger role the EU plays in setting economic policy in the Euro-area. Therefore, I created a measure scoring countries who were members of the monetary union as ‘1’ and those who were not as ‘0’. In 1999, Greece, the United Kingdom, Sweden, and Denmark had not joined the Eurozone. By 2006, Greece had joined.
Because they all deal with identifying political leaders, the knowledge questions for the 1999 study also introduce another source of possible variation. The longer an individual has held an office, the more likely the population would be able to identify her. To control for this potential variation, I deploy several measures of a person’s tenure in office. For the questions asking respondents to identify their country’s foreign minister and finance minister, I simply create a country-level variable measuring the number of years that the minister in question had been in office at the time, which range from 1 to 7 years. These two measures should vary positively with political knowledge.
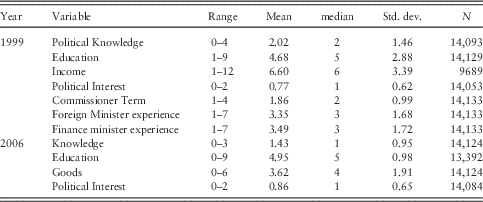
I use a slightly different approach to control for the time an EU commissioner has served. Due to their fixed terms in office, I assigned residents of each country a score based on the number of terms that their commissioner had served. Countries with two commissioners in 1999 (the United Kingdom, Germany, France, Italy, and Spain) received a score representing the longest-serving commissioner. Scores ranged from 1 to 4 across this variable, and should vary positively with citizen levels of political knowledge. Distributional statistics appear in Table 2.
Summary statistics for ordinal- and ratio-level variables

Predictions and methods
My two hypotheses predict several outcomes. First, subsidies should positively correlate with knowledge. Second, the subsidy hypothesis additionally predicts that subsidizing public broadcasters strengthens the relationship between watching public broadcasting and political knowledge. To measure this relationship, I use an interactive term that multiplies the subsidy and ‘Public Viewership’ variables together. I predict that this term will have a positive sign, which would indicate that subsidies for public broadcasters increase public affairs knowledge among those who watch public television.
Finally, the neutralization hypothesis predicts that subsidizing public broadcasters will decrease the effects of individual-level variables on political knowledge. These variables include political interest, as previously tested (Iyengar et al., Reference Iyengar, Curran, Brink-Lund, Salovaara-Moring, Hahn and Coen2010), but also a broader array of socioeconomic variables, namely education, income, and gender. I include an interactive term for the product of subsidy and each of these variables in each regression equation. The sign on each of these four interactive terms should be negative, which would mean that that subsidizing public broadcasters would decrease the political knowledge gap between rich and poor, educated and uneducated, interested and uninterested, and men and women.
Remember that due to differences in the question wording between the surveys in the question that forms the basis for the independent variable, the 1999 data should show much stronger results than the 2006 data.
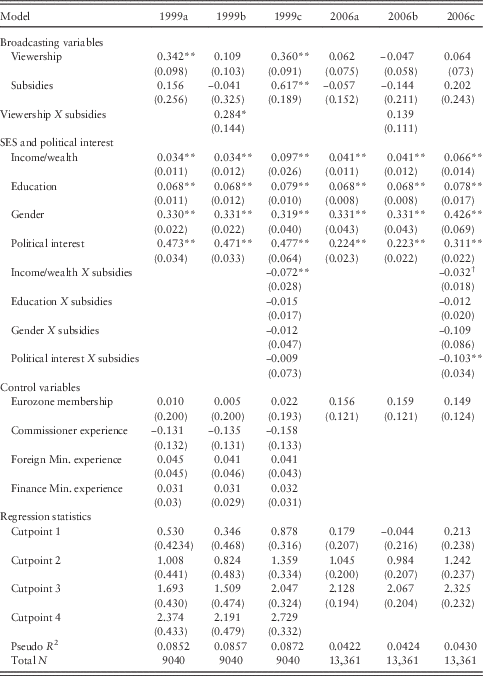
To test my hypotheses, I regress the political knowledge index on the independent variables. I estimate three regressions for both the 1999 and 2006 data. The first column for each year in the table (1999a and 2006a) represents the simplest test of the subsidy hypothesis without any interactive terms. The second column (1999b and 2006b) shows the results of the interactive test between subsidies and public broadcaster viewership. The final column (1999c and 2006c) represents the results of the tests for the neutralization hypothesis, showing interactions between subsidies on one hand and income, education, gender, and political interest on the other. Because the dependent variable of knowledge has a limited number of ordered categories, I employ ordinal probit analysis. Because each individual in my analysis is nested within a country, I use cluster-adjusted standard errors to account for within-country error correlations.
Results
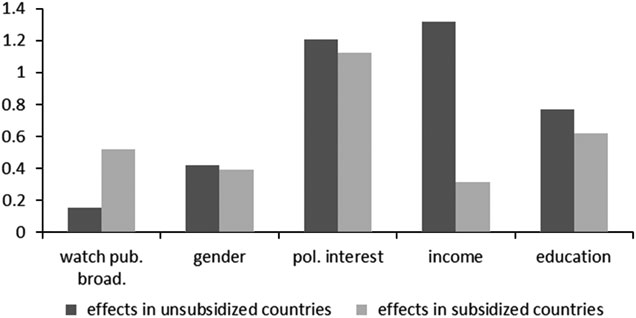
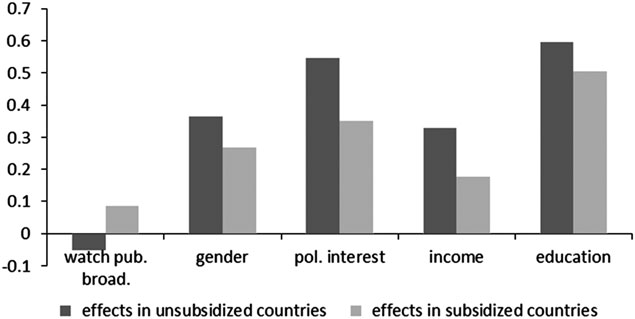
Table 3 shows the results of the analysis, conducted using the Stata version 12 statistical analysis software while Figures 1 and 2 graphically show the estimated effects of each independent variable on political knowledge in countries with unsubsidized and subsidized public broadcasting systems. Overall, Table 3 shows broad support in the 1999 data for both hypotheses. The ‘a’ column shows mixed support for the subsidy hypothesis. The magnitude has a positive coefficient of reasonably large magnitude for the 1999 study, though it is not significant at standard levels. One reason for this lack of significances is that subsidy is a country-level variable that has very few degrees of freedom when combined in a regression with four other country-level variables in a study with only 14 countries. Although using 14 countries is an improvement over previous comparisons of public broadcasting and political knowledge, which generally only use two to four countries, leverage remains limited. The individual-level variables of political interest, education, income, and gender all have coefficients that are statistically significant at the 0.05 levels, which match existing research showing that more interested, better-educated, wealthier, and male respondents possess higher levels of political knowledge, all else being equal.
Effects on number of knowledge questions answered correctly (1999). Y-axis represents change in number of questions answered correctly on the four-question knowledge index. Unsubsidized countries are Portugal and Spain. Subsidized countries are all others in the study.

Effects on number of knowledge questions answered correctly (2006). Y-axis represents change in number of questions answered correctly on the three-question knowledge index. Unsubsidized countries are Portugal and Spain. Subsidized countries are all others in the study.

Relationship between knowledge and public broadcasting subsidies

SES=socioeconomic status.
Significance levels: †0.1; *0.05; **0.01.
The ‘1999b’ column in Table 3 shows strong support for the subsidy hypothesis. The interaction of public broadcasting subsidies and public viewership produces a positive coefficient in 1999, statistically distinct from zero at the 0.05 level.
Finally, the c column of Table 3 shows the interactive terms between individual education, gender, income, and political interest, and the subsidy variable. Across the 2 years, seven of the eight interaction terms have negative signs, which support the neutralization hypothesis. The one positive interaction – between gender and subsidies in the 1999 test, contains magnitudes that are so small that they are inconsequential. The interaction term between subsidies and income/wealth is statistically significant in both the 1999 regression (at the 0.05 level) and in the 2006 results (at the 0.10 level). The negatively signed interaction term between political interest and subsidies is significant in the 2006 data, but not in the 1999 data. Despite mixed results regarding statistical significance, however, the overall pattern of negative effects across all eight measures supports the neutralization hypothesis.
In the 2006 data, however, the coefficient magnitudes regarding the interaction of the subsidy and attention variables are muted, in line with my predictions that the questions regarding television consumption are based on general exposure to television states, not specific attention to public affairs programming. This difference in the magnitude and significance levels of the interactive terms provides evidence for the proposition that attention to public affairs programming in subsidized public broadcasting systems – not merely watching a public broadcaster – drives knowledge.
Both coefficient directions and statistical tests generally support my hypotheses, but reading the coefficients alone does not indicate whether or not the effect sizes are substantively large. Additionally, the conditional nature of interaction terms and probit regression mean that effect sizes are not static at different values of each variable. I illuminate this issue by displaying effects sizes in Figures 1 and 2. To calculate these effects, I followed a two-step process. Using statistical analysis software, I first calculated the estimated probability that a person will answer a given number of political questions correctly at each level of a given independent variable, the subsidy variable, and the affected interaction terms, while holding all other variables at their medians. For example, I calculate the estimated probabilities of a male respondent answering 0, 1, 2, 3, or 4 of the questions correctly on the knowledge index (for 1999’s knowledge index) that makes up my dependent variable for all possible value combinations of public television consumption and subsidy. In this case, I would have the estimated probabilities of the same hypothetical person if he watched public television in a country with subsidies, if he watched public television in a country without subsidies, if he only watched commercial television in a system with public subsidies, or if he only watched commercial television without subsidies for public-service broadcasters. I repeated these calculations for all the other relevant interactions regarding gender, income, education, and political interest.
These estimates are more intuitive than regression coefficients. To further collapse the output into a simple figure, I took an additional step and used the estimated probabilities to determine the expected average number of questions answered correctly on the knowledge index. For instance, if a hypothetical respondent of interest had respective probabilities of correctly answering zero, one, two, three, or four questions on the knowledge index of 0.2, 0.2, 0.2, 0.2, or 0.2, then simple multiplication yields an expected number of right answers of 2.Footnote 5
These calculations yield the bar graph in Figure 1. Each paired set of bars represents the effect size of a given independent variable at median levels of all other variables. The bar on the left of each pair represents effects in countries that do not subsidize their public broadcaster, while lighter bars on the right represent effects with subsidized public broadcasting. In the 1999 data, the effect of watching public broadcasting on knowledge more than triples when moving from an unsubsidized to a subsidized system, increasing from 0.140 to 0.497. The effect size of 0.497 is roughly 12% of the total range on the dependent variable, meaning that respondents increased the number of correct answers by one half of a question (on a 0–4 scale) in subsidized systems – a large effect that strongly supports the subsidy hypothesis. For 2006, the effect size is modest, with respondents who watched subsidized public television only recording an additional 0.119 correct answers compared with their counterparts in unsubsidized countries, about 4% of 2006’s three-question knowledge index. This muted improvement supports my theory’s implication that superior news and public affairs programs on subsidized public broadcasters drive knowledge gains, rather than merely watching public broadcasting.
In contrast, the effect sizes decrease for the other predictors of knowledge between unsubsidized and subsidized political broadcasting systems in both 1999 and 2006. In 1999, some changes are quite small, with the effects of gender and interest hardly changing at all. However, moving to a subsidized political broadcasting system depresses the effect of education on political knowledge by a more noticeable 19.9%. Finally, the effect of income drastically falls by 73.0%. In 2006, the decreases on the magnitude are 15.7% for education, 24.7% for gender, 36.3% for political interest, and 48.2% for income, adding additional support for the neutralization hypothesis.
Another way to contrast the impact of subsidies is to compare the relative sizes of the effects of public broadcasting viewership with the other independent variables across systems. For the 1999 analysis, in countries with unsubsidized broadcasting systems, watching public broadcasting has by far the smallest effect on knowledge of the five variables, increasing the average number of correct answers on the knowledge scale by a mere 0.139 questions, while the next smallest coefficient, gender, leads to a 0.389-question increase in the predicted number of correct answers. In subsidized systems, however, watching public broadcasting is the variable with the third-largest effect, recording a larger effect size (0.497) than income (0.351) or gender (0.372), while nearly matching the size of education (0.626).Footnote 6
Overall, the results support the subsidy hypothesis, which states that subsidizing public broadcasters has a positive effect on political knowledge among people who watch public broadcasting. The data also shows that subsidizing public broadcasting dampens the effects of class and interest, which supports the neutralization hypothesis. These results are statistically significant or at least suggestive, and substantively meaningful.
An Iberian effect?
One objection to these conclusions is that Spain and Portugal share a long cultural history and these results represent some unspecified ‘Iberian’ effect. To address this concern, I re-analyze a smaller sample of countries for which I have more detailed financial data from 1999, subdividing them into three levels of subsidy. Spain and Portugal provide no direct subsidies, and are classified as the ‘low’ group. Among countries that subsidize their public broadcasters, Italy and Ireland rely relatively extensively on advertising funding, and provide between 40% and 50% of the budgets of their public broadcasters through subsidies. I classify these two as the ‘moderate’ subsidy group. Finally, Britain, Sweden, and Denmark provide nearly the entire budget of their broadcasters through subsidies. None of the three sell any advertising on their public networks, with the exception of sponsorship of sports in Sweden. I classify these three countries as the ‘high’ subsidy group.
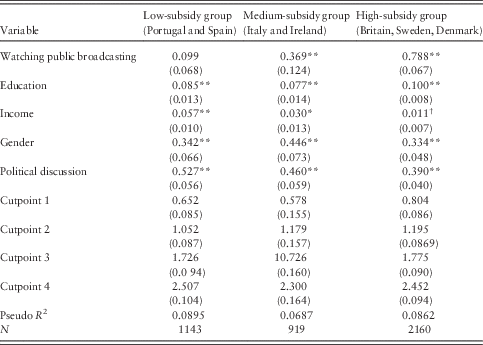
I estimated separate regressions using probit analysis for each of the three groups from the 1999 Eurobarometer data, maintaining the individual-level controls from the first set of regressions. Table 4 shows the coefficients for each group, while Figure 3 shows the effect sizes of each of the variables compared across all three regressions. For the ‘Iberian effect’ hypothesis to hold, the moderate subsidy group and the high subsidy group should show similar effect sizes for the effect of watching public broadcasting on knowledge. That result would suggest something unusual about Spain and Portugal drives the effect, not subsidies.
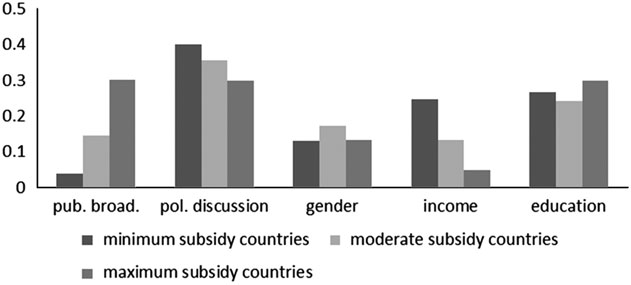
Effects on number of knowledge questions answered correctly across country groups (1999). Y-axis represents change in number of questions answered correctly on the four-question knowledge index. Minimum subsidy countries are Portugal and Spain. Moderate subsidy countries are Ireland and Italy. Maximum subsidy countries are Great Britain, Sweden, and Denmark.

Effects of public broadcasting subsidies on political knowledge (robustness check)

Significance levels: †0.1; *0.05; **0.01.
This is clearly not the case. The low subsidy group’s coefficient on the public broadcasting variable is 0.099 (and statistically insignificant at the 0.05 level), while the middle group’s effect is 0.369 and the high subsidy group’s is 0.788. This nearly linear increase is exactly what the subsidy hypothesis predicts and suggests that something more is going on than any innate differences that Spain and Portugal have from the rest of Europe. The picture is similar for the neutralization hypothesis: both the political discussion and income variables show the largest effects in the low-subsidy countries and the smallest effect sizes in the high-subsidy countries, with the effect sizes for the middle-subsidy countries being in between. The picture is mixed for other variables, but do not show a pattern supporting the idea that the Iberian countries are distinct.
Figure 3 shows the estimated effects of each variable on political knowledge under the revised tripartite schema. To make similar comparisons across each set of countries, I estimated the marginal effect of each variable while holding all other variables constant. To ensure comparability across all groups, I used variable values that corresponded with the median of the median of the three groups. For example, the respective median education levels in the low, medium- and high-subsidy groups were ‘1’, ‘4’, and ‘6’. I calculated the effects sizes shown in Figure 3 with the value of each group’s education level set at ‘4’.
The magnitudes of estimated effects on each variable strongly support the subsidy hypothesis and offer mixed support for the neutralization hypothesis. Watching public broadcasting in a low-subsidy country has small effects; a respondent who reported getting news from a public broadcaster answered an estimated 0.04 more political knowledge questions correctly. This effect size jumps to 0.14 questions for the medium-subsidy group and 0.30 for the high-subsidy group. In contrast, the estimates show decreasing effects for income and political discussion, respectively. Effect sizes for income drop from 0.25 in the low-subsidy group to 0.14 in the medium-subsidy group and 0.05 in the high-subsidy group – almost the precise mirror image of the effect sizes shown for the public broadcasting variable. For political discussion, an increase from the lowest levels to interest to the highest leads to a 0.4-question boost in the number of right answers to the political knowledge questions for respondents in the low-subsidy group, which drops to an estimated increase of 0.35 for the medium-subsidy group and 0.30 for the high-subsidy group. The pictures for education and gender are mixed, but the results match earlier patterns.
Finally, the magnitudes of the effects match earlier analysis. The effect of public broadcasting moves from the smallest of all the variables in the low-subsidy group, to a modest effect in the medium group, to an effect that is on par with political interest and education among the high-subsidy countries. The analysis adds up to more robust support for the subsidy and neutralization hypotheses, while eliminating the hypothesis that something about Spain and Portugal causes the observed data patterns.
Conclusions
Using data from 14 countries, I test the ideas that government aid to public broadcasters increases public knowledge; and that the information-rich environment generated by subsidized public broadcasting reduces the differences in knowledge produced by gender, education, income, and political interest. The subsidized knowledge hypothesis holds; individuals who watch public television in countries that subsidize their public broadcasters have significantly higher levels of political knowledge than both those citizens who watch commercial television and those who watch unsubsidized public broadcasters.
The neutralization hypothesis also survives. Subsidizing public broadcasters reduces – to varying extents – the effects that social, economic, and demographic variables have on political knowledge. Since I argue that knowledge is one key to the ability of voters to hold their leaders democratically accountable, having the government subsidize public broadcasters helps level the political playing field between historically disadvantaged and traditionally dominant groups.
True, only for income does it appear that subsidizing public broadcasting has a substantial and statistically distinct leveling effect. On the whole, however, the negative interaction terms between class, gender, and political interest on one hand, and subsidizing public broadcasting on the other, are quite suggestive.
Finally, these results leave out one important piece of the puzzle: viewership. Unwatched public broadcasters, regardless of subsidy, impart no political knowledge, as the depressed state of American political knowledge and the extremely low viewership of PBS in comparison with its foreign counterparts attests. In addition to providing for more sophisticated future tests of the subsidy and neutralization hypotheses that I develop here, future research needs to understand how public broadcasters can maintain viewership in a 500-channel universe while still providing information. Only by understanding the dynamics of audience movement can policymakers take advantage of the boost to political knowledge provided to viewers of well-funded public broadcasting outlets. However, the results provide substantial evidence that public broadcasters both increase societal levels of knowledge while reducing knowledge gaps between privileged and underprivileged citizens and point tantalizingly toward how to achieve the dream of an informed public equipped to vote in its own interest.
Acknowledgments
The author wishes to thank Nicholas Valentino, Allen Hicken, Jenna Bednar, Michael Traugott, and Lauren Guggenheim for valuable insights and comments, and Katherine Bies, Elizabeth Rowland, Lydia McMullen-Laird, and Eileen Giudice for capable research assistance. All errors remaining are those of the author.