Implications
Animal welfare is a multi-dimensional concept, and its assessment should be based on different measures. Considerable efforts have been made to develop assessment protocols for different farm animal species (e.g. Welfare Quality® (WQ)). One of the main challenges of the WQ protocols is the aggregation of the different measures into an overall assessment due to the complexity of the methodology proposed. This study proposes an alternative multi-criteria methodology to the one used in the WQ protocols, which remained more transparent and flexible than the one proposed in the WQ protocols, solving, in this way, one of the difficulties that the application of these protocols present.
Introduction
Concern about livestock living conditions has increased considerably in the last few years. Also, consumers have been increasingly linking animal welfare indicators with food safety and quality. These consumer preferences create economic incentives for stakeholders to meet animal welfare standards, as established by legislation or voluntary certification schemes (Vapnek and Chapman, Reference Vapnek and Chapman2010). Due to the lack of a standard assessment of animal welfare, these standards vary from one certification scheme to another. This statement was the origin of the EU WQ project, which aimed at proposing an overall assessment system to assess the welfare of cattle, pigs and poultry (Botreau et al., Reference Botreau, Capdeville, Perny and Veissier2008).
Animal welfare is a multi-dimensional concept, and its assessment should be based on a variety of measures related to several aspects such as the absence of thirst, hunger, discomfort, disease, pain, injuries and stress, and the presence of normal behavioural expressions (Farm Animal Welfare Council (FAWC), 1992). Due to this fact, a multi-criteria evaluation model is required for the evaluation of an animal unit (farm, slaughterhouse). These multi-criteria, decision-making approaches all share the need for an aggregation operator. In this case, information at the measures level may be useful for farm management purposes; however, labelling purposes require a certain level of aggregation of the measures into overall scores. Considerable efforts continue to be made in order to develop overall assessment systems for different farm animal species (e.g. WQ project (Welfare Quality®, 2009), Bristol Welfare Assurance Programme (Leeb et al., Reference Leeb, Main, Whay and Webster2004) and Animal Welfare Indicators project (AWIN, 2015). WQ developed animal welfare multi-criteria evaluation models for different livestock species (Botreau et al., Reference Botreau, Veissier and Perny2009). The inputs for the WQ animal welfare multi-criteria evaluation model are on-farm welfare measures described in the WQ assessment protocol (Welfare Quality®, 2009). The WQ multi-criteria evaluation model uses different aggregation methods (e.g. decision tree, weighted sum or Choquet Integral (CI)) to aggregate measures into an overall assessment (Botreau et al., Reference Botreau, Capdeville, Perny and Veissier2008). There are other ways of approaching the aggregation problem that differ from the ones used by the WQ multi-criteria evaluation model, e.g., the multi-attribute utility theory (MAUT, Keeney and Raiffa, Reference Keeney and Raiffa1976), Elimination Et Choix Traduisant la Realité (ELECTRE: Elimination and Choice Expressing Reality method) (Roy, Reference Roy1971) or the Analytic Hierarchy Process (Saaty, Reference Saaty1980).
In the present study, we focussed on the MAUT. In the MAUT, uni-dimensional utility functions which correspond to each criterion are aggregated into a single global utility function combining the whole of the criteria. In economics, the utility function measures satisfaction of a consumer as a function of consumption of real goods, such as food, clothing, etc. In the animal welfare context, the utility function measures the importance in terms of welfare of the different values a welfare measure can take. For example, 5% of lameness in a farm may be interpreted as a worse situation than 5% wounds on the body. A large number of methods have been proposed to determine the utility functions in MAUT, for instance the standard sequences method described by Bouyssou et al. (Reference Bouyssou, Marchant, Perny, Pirlot, Tsoukias and Vincke2000) and the Measuring Attractiveness by a Categorical Based Evaluation Technique (MACBETH) method, described by Bana e Costa et al. (Reference Bana e Costa, de Corte and Vansnick1999). Examples of aggregation functions in MAUT are the weighted sum, the ordered weighted average (Yager, Reference Yager1988) and the CI (Murofushi and Sugeno, Reference Murofushi and Sugeno1989). The most common aggregation tool still used today is the weighted sum. Using this aggregator, different importance can be attached to the criteria, however no interaction between the criteria is taken into account, being this its main drawback since compensation between good and bad grades obtained at criteria level is allowed. The distinguishing feature of a CI is that it is able to represent a certain interaction, ranging from redundancy (negative interaction) to synergy (positive interaction) (Grabisch, Reference Grabisch1996). In the framework of the MAUT, the MACBETH method was used for utility function determination, and the CI as the aggregation method.
The aim of this paper is to present an alternative multi-criteria evaluation model to assess animal welfare on farms, within the WQ framework, employing, as an example, a welfare assessment of growing pigs. The aim was to find a model which solved the main difficulties described by Botreau et al. (Reference Botreau, Bracke, Perny, Butterworth, Capdeville, van Reenen and Veissier2007b) that a multi-criteria aggregation model for animal welfare faces, for instance, the problem that interactions may exist between measures and that measures may have different importance for animal welfare, but that remains more transparent and flexible than the model proposed in the WQ protocol. In other words, we looked for a model which can be easily understood by the stakeholders and which would allow the parameters to be changed according to new scientific knowledge. The paper is organised as follows: second section presents the general methodology followed in the WQ protocol and the methodology we propose to construct the multi-criteria evaluation model. Third section presents the construction of criteria from the initial measures by means of examples. Finally, fourth section discusses the strengths and weaknesses of the model.
General methodology
Welfare Quality®
The WQ assessment protocol for growing pigs consists of 27 welfare measures, which were aggregated following a three-step aggregation process (Welfare Quality®, 2009). In total, 27 welfare measures were thus combined into 12 criteria, these were aggregated into four principles and these four principles were aggregated into an overall assessment. Different types of operators were used in this aggregation process, such as decision trees, weighted sums, conversion to ordinal scores, least squares (LS) spline fitting and CI. To parameterise the operators used for the aggregation of the welfare measures and criteria, data sets were presented to expert panels of 13 animal scientists, who individually ranked farms and gave an absolute score on a scale of 0 to 100 for each of the farms presented in each of the data sets (Botreau et al., Reference Botreau, Capdeville, Perny and Veissier2008). Partners of the WQ project and members of the Management Committee and Advisory Committee (i.e. stakeholder representatives), were consulted to agree upon parameters for the aggregation of principles into an overall classification (Botreau et al., Reference Botreau, Veissier and Perny2009).
First step of the aggregation process
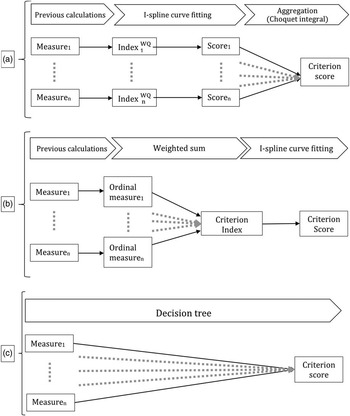
In the first step, welfare measures were aggregated into the 12 corresponding criteria. WQ used different types of aggregation of measures into criteria (Figure 1). For some criteria, the numbers of moderate and severe problems were first combined with a weighted sum, producing a measure index, on a scale from 0 (worst) to 100 (best). Afterwards, these index values were converted into measure scores (expressed on the same 0 to 100 scale), using spline functions (Ramsay, Reference Ramsay1988) that were fitted by least-square methods. Finally, the CI was used to combine the scores for the different measures into a score for the criterion (a in Figure 1). For some other criteria, the measures where first transformed into an ordinal scale, which consisted of assigning warning or alarms depending on the value of the measures. The number of warnings and alarms were then combined into an index for the criterion, and afterwards this index was converted into a criterion score using l-spline functions (b in Figure 1). Decision trees were used to produce the criterion score (c in Figure 1) for other measures. Further information on the development and employment of these operators can be found in Botreau et al. (Reference Botreau, Capdeville, Perny and Veissier2008 and 2009) and Veissier et al. (Reference Veissier, Jensen, Botreau and Sandoe2011).
Outline of the three different methodologies followed in the Welfare Quality® (WQ) project to aggregate the measures into criteria (adapted from Welfare Quality®, 2009).

Second step of the aggregation process
In the second step, a CI was used to aggregate the 12 criteria into four principles. This integral uses weights to combine the different criterion scores into one principle score (expressed on the 0 to 100 scale), whereas limiting the possibility that a poor score of a criterion is compensated by other excellent scores (Botreau et al., Reference Botreau, Bracke, Perny, Butterworth, Capdeville, van Reenen and Veissier2007b; Veissier et al., Reference Veissier, Jensen, Botreau and Sandoe2011).
Third step of the aggregation process
In the third and final step, the four principles were combined into one overall assessment. The herds were classified in four different welfare categories: ‘unacceptable’, ‘acceptable’, ‘enhanced’ or ‘excellent’, based on reference profiles for these four principles (Botreau et al., Reference Botreau, Veissier and Perny2009). To be classified as ‘excellent’, a herd had to score >55 for each principle and >80 for two principles; to be classified as ‘enhanced’, each principle had to be >20 and at least two principles had to be >55; to be classified as ‘acceptable’, each principle had to be >10 and at least three principles had to be >20. Herds which did not comply with the minimum scores were classified as ‘unacceptable’, which means that at least one principle was ⩽10 or at least two principles were ⩽20.
Multi-attribute utility theory
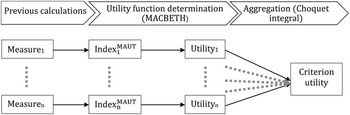
As presented before, the WQ assessment protocol follows a three-step aggregation process. Measures are aggregated into criteria, criteria into principles and principles into an overall assessment (Welfare Quality®, 2009). This study focussed on the first step of the aggregation to introduce an alternative methodology to the one proposed in the WQ protocol by means of examples illustrated using growing pigs. MAUT was used to produce a value of welfare for each criterion, the application of the MAUT consisted of two separated steps, the utility functions determination and the aggregation function determination. The MACBETH method was used for the determination of the utilities and the CI was used as the aggregator method (Figure 2).
Outline of the alternative methodology proposed in this study to aggregate the Welfare Quality® measures into criteria. MAUT=multi-attribute utility theory.

Utility function determination (MACBETH)
The utility function gives value to the measure in terms of welfare, it represents the preferences of the decision-maker (DM) for the measures and their different values. In this context, the DMs involved in the decision process could be a panel of animal scientists, veterinarians, consumers, etc. There are different methods for utility function determination, we chose MACBETH for several reasons: first, due to the available information on how to use this method to facilitate a consensus between stakeholders (Parnell et al., Reference Parnell, Brensik, Tani and Johnson2013; Bana e Costa et al., Reference Bana e Costa, Lourenço, Oliveira and Bana e Costa2014), which may be one of the main difficulties which arise when a panel of different DMs is consulted to determine the utility functions and the aggregation parameters in a further stage of the project. Second, due to the fact that this method makes it easier to judge the different attractiveness of options with an increasing number of criteria, due to the use of qualitative judgements, and moreover, a scale of indifferent categories (‘very weak’, ‘weak’, ‘moderate’, ‘strong’, ‘very strong’ or ‘extreme’) (Bana e Costa et al., Reference Bana e Costa, de Corte and Vansnick2004). Third, the determination of the utilities process remains transparent due to the extensive bibliography on it (Bana e Costa et al., Reference Bana e Costa, de Corte and Vansnick1999 and Reference Bana e Costa, de Corte and Vansnick2004), and it is easier to explain to the stakeholders due to the interactive software, which is sold (M-MACBETH). Fourth, MACBETH allows for a comparison of not only quantitative performance levels but qualitative performances too, with no need for a previous conversion of the qualitative scales into a quantitative scale, allowing a solution to one of the problems presented by Botreau et al. (Reference Botreau, Bracke, Perny, Butterworth, Capdeville, van Reenen and Veissier2007b).
MACBETH is a methodology which requires only qualitative judgements to quantify the relative attractiveness (utilities) of options (farms). In order to elicit a marginal utility function with MACBETH, the first step is to define whether the measure performs as a quantitative measure or as a qualitative one and which are the quantitative/qualitative performance levels of the measure. The next step is to fill in a matrix, giving qualitative judgements regarding the difference of attractiveness between the different quantitative performance levels of the measure. The qualitative judgements can be rated as ‘very weak’, ‘weak’, ‘moderate’, ‘strong’, ‘very strong’ or ‘extreme’. As each judgement was given, the matrix’s consistency was automatically verified with an interactive algorithm based on linear programming (Mayag et al., Reference Mayag, Grabisch and Labreuche2010), and judgment modifications were suggested which could be made to fix any detected inconsistency. From the complete and consistent matrix of judgements, MACBETH creates a numerical scale. With the numerical scale, MACBETH produces the marginal utility function (u) for each measure. In order to be able to aggregate the different measures into criteria, this method also allows the user to normalise the raw data expressed in different scales into an absolute value scale, ranging, for example, from 0 to 100, where 0 is the worst situation one can find on a farm and 100 the best situation. See Supplementary Material S1 for detailed figures of the steps followed for the utility function determination using the M-MACBETH software (Supplementary Figure S1).
After the initial calculation of the MACBETH scale, a check was performed to ensure that it adequately represented the relative magnitude of the WQ DMs’ judgements. If not, the scores were adjusted. MACBETH allows to adjust the scores within a range of values that assures compliance with the qualitative judgements matrix.
Aggregation with the Choquet Integral
In a second step, the CI was used to aggregate the different measures into the corresponding criteria. In order to combine the measures (individual utilities calculated with MACBETH) into the corresponding criteria using the CI, the first step used is the capacity identification. Capacities can be regarded as a weighting vector involved in the calculation of weighted sums. Seen as an aggregation operator, the CI takes into account the different importance of the measures and the interaction between them. These interactions can be positive (complementary, no interaction allowed) or negative (substitutive, interaction allowed). The number of variables involved in the CI increases exponentially, along with the coefficients which define a capacity. To keep things simple, it may be preferable to restrict to two-additive solutions (only interactions between pair of criteria is considered). See Supplementary Material S1 for a deep review about the interaction indices and the concept of k-additive capacity.
In this study, capacity identification, based on the LS approach, was implemented using the Kappalab R package following the method described by Grabisch et al. (Reference Grabisch, Kojadinovic and Meyer2008).
In order to use the LS identification method, a data set (learning data) is presented to the DMs, who have to express their preferences over the alternatives of the data set by providing an overall value for each alternative. In this study, examples’ data, containing values of welfare measures, were generated as learning data. The utilities calculated with MACBETH corresponding to the examples’ data, were used as subsets against which the initial preferences of the DMs are expressed. We aimed to fit the WQ DMs preferences, therefore, instead of asking a panel of DMs to react over these sets of farms, the results of the aggregation of the examples’ data following the WQ protocol were used as if they were the overall values given by the DMs.
With this methodology, a progressive interactive approach can be developed after an initial calculation of the CI, where additional constraints on the Shapley values, which measure the overall importance of a measure (criterion), and the interaction indices can be imposed in order to fit more precisely the WQ DMs preferences.
According to Mayag et al. (Reference Mayag, Grabisch and Labreuche2011), given (x 1, x 2, …, x n ) the individual utilities for the different measures, the CI with respect to a two-additive capacity can be written as follows:
 $$C\mu (x){\equals}\mathop{\sum}\limits_{i{\equals}1}^n {v_{i} x_{i} {\minus}{1 \over 2}\mathop{\sum}{_{{\{ i,j\} }} I_{{ij}} \left. {\left| {x_{i} {\minus}x_{j} } \right.} \right|} } $$
Where v i represents the importance of the measure i and corresponds to the Shapley value of µ (capacity) and I ij represents the interaction between measures i and j.
Examples of the aggregation of measures into criteria
In order to illustrate the methodology proposed for the construction of the criteria, three examples are given: absence of injuries, absence of disease and absence of pain induced by management procedures. The WQ protocol distinguishes three types of aggregation of measures into criteria. Each one of these three criteria are calculated in a different way in the WQ protocol (Figure 1), whereas this study proposes a unique methodology for all the criteria (Figure 2). Detailed figures of the methodology followed in the WQ multi-criteria evaluation model and in this alternative model, for the health criteria, can be found in the Supplementary Figures S2 and S3, respectively.
Example 1: ‘Absence of injuries’ criterion
Absence of injuries is assessed by three measures: lameness, wounds on the body and tail-biting. The measures which form this criterion have in common that they are recorded at individual level. This scale generally represents the severity of the problem and the range of animals surveyed can be easily calculated (e.g. percentage of animals walking normally, percentage of moderately lame animals and percentage of severely lame animals).
Welfare Quality®
Briefly, the WQ protocol, first produced an ‘Index’
 $(I_{n}^{{WQ}} )$
by combining the percentage of animals in each severity category, particularly for lameness and wounds on the body. It consists of a weighted sum, where n can be substituted by lameness or wounds on the body. For instance, for lameness (l):
 $${\rm Index}\,I_{l}^{{WQ}} \,{\equals}\,100{\minus}\left[ {{{4(\,\%\,{\rm lameness}\,1){\plus}10(\,\%\,{\rm lameness}\,{\rm 2})} \over {10}}} \right]$$
For example, a farm with 10% moderately lame animals (lameness 1) and 1% severely lame animals (lameness 2) will achieve an Index for lameness
 $(I_{n}^{{WQ}} )$
of 95.
Afterwards, this ‘Index’ is restored into a non-linear function (l-spline function) producing a ‘Score’ (Sn). For instance, for lameness
When
 $I_{n}^{{WQ}} \leq 85$
then:
 $$\eqalignno{&Score\,Sl\,{\equals}\,(0.1672{\times}I){\minus}(0.0014908{\times}I^{2} )\cr\quad\quad\quad\quad{\plus}(0.000041719{\times}I^{3} )}$$
When
 $I_{n}^{{WQ}} \geq 85$
then:
 $$\eqalignno{&Score\,Sl\,{\equals}\,{\minus}11012{\plus}(388.77{\times}I){\minus}(4.5738{\times}I^{2} )\cr\quad\quad\quad\quad{\plus}(0.017972{\times}I^{3} )}$$
For example, the farm presented before which was assigned
 $I_{l}^{{WQ}} {\equals}95$
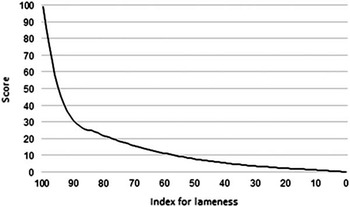
will achieve a Score for lameness (Sl) of 51.35. Figure 3 shows an example of the WQ I-spline function for lameness. For tail-biting, the I-spline function is calculated directly. The mere absence or presence of it is recorded, and thus there is no need for a weighted sum to combine the scores regarding the severity of the problem. To produce the criterion score, the partial scores previously obtained with the I-spline functions are combined with the CI (Welfare Quality®, 2009).
Scores for lameness according to the Index calculated for the % of lame pigs.

Multi-attribute utility theory
Before determining the utility functions of lameness and wounds on the body, we produced an index such as was carried out in the WQ protocol, in order to combine the percentage of animals with a moderate problem and the percentage of animals with a severe problem
 $(I_{n}^{{MAUT}} )$
, where n can be lameness or wounds on the body. The same weights as those used in the WQ protocol were then implemented. For instance, for lameness
 $${\rm Index}\,I_{l}^{{MAUT}} \,{\equals}\,0.4({\rm \,\%\,}\,{\rm lamenessl}){\plus}1({\rm \,\%\,lameness}\,{\rm 2})$$
For example, a farm with 10% moderately lamed animals and 1% severely lamed animals will achieve an Index for lameness
 $I_{l}^{{MAUT}} $
of 5. The utility function for the percentage of animals with tail-biting was calculated directly.
Utility function determination (MACBETH):
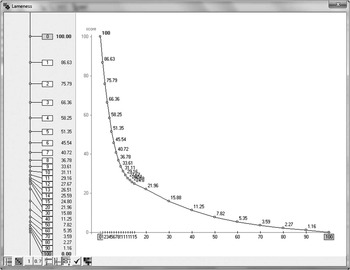
The measures which form this criterion were defined as quantitative measures in MACBETH. The quantitative levels of these measures were defined according to the WQ protocol. Figure 3 shows how the scores assigned by the WQ DMs corresponding to the percentage of lame animals decreased rapidly for the 100 to 85 range – reflecting 0% to 15% lame animals respectively – the rate gradually slowing down after this point. Performance levels which vary in one unit between 0% and 15% animals with lameness were established, and when the slope of the l-spline function became homogeneous, intervals of 10 units were established, as can be seen in Figure 4 with an example of the utility function for lameness calculated with MACBETH. For example, the farm presented before which was assigned with
 $I_{l}^{{MAUT}} {\equals}5$
will achieve a utility for lameness of 51.35.
Utility function for lameness calculated with MACBETH.

Aggregation with the Choquet Integral:
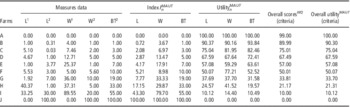
In total, 10 farms were used as learning data to determine the CI aggregation parameters (data in Table 1). The utilities calculated with MACBETH for these ten farms were used as a subset to express the WQ DMs’ preferences (utilities in Table 1). The results of the aggregation of the ten farms’ data following the WQ protocol were used as the WQ DMs’ initial preferences in order to identify the capacity using the LS-based approach (WQ overall scores in Table 1).
Data of absence of injuries measures for selected pig farms

WQ=Welfare Quality®; MAUT=multi-attribute utility theory.
Measures’ indices, individual utilities and overall utilities for each selected farm calculated with the WQ and the MAUT methods.
1 Percentage of animals affected with lameness (L)/wounds on the body (W) scored 1.
² Percentage of animals affected with lameness/wounds on the body/bitten tails (BT) scored 2.
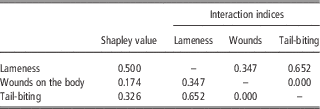
Comparing the results for lameness, wounds on the body and tail-biting obtained with the WQ method and the MAUT (Table 1), the overall utilities from different farms – calculated with MACBETH – fit the scores (at criteria level) obtained with the WQ I-spline functions. The Shapley values for each measure are shown in Table 2. As we can see, lameness was considered more important than tail-biting, which was in turn considered more important than wounds on the body. Furthermore, Table 2 shows that all the interaction between the measures were positive, thus, the measures were defined as complementary, in accordance with the WQ protocol.
Shapley value and interaction indices to aggregate the measures’ utilities into the absence of injuries criteria with the Choquet Integral

Example 2: ‘Absence of disease’ criterion
Absence of disease is assessed by 13 measures. The measures used to check this criterion led to data expressed on different scales.
Welfare Quality®
Due to the different nature of the measures (for instance, mortality is recorded as the percentage of mortality on farm during the last 12 months, whilst coughing and sneezing are assessed as the average frequency of coughs/sneezes per animal over 5 min), WQ decided to compare the data to alarm thresholds which represent the limit between what is considered abnormal and what is considered normal. When the incidence observed on a measure reaches approximately half the alarm threshold, a warning is attributed. The measures are grouped into six areas: mortality, respiratory, digestive, liver, skin and hernias. The severity of the problem is estimated per area: if within an area the frequency of one symptom is above the warning threshold and the other is below, a warning is attributed to the area. On the other hand, if within an area the frequency of one symptom is above the alarm threshold, the alarm is attributed to the area; if neither occurs, no problem is recorded. The number of alarms and warnings detected on a farm are calculated and used to calculate an ‘Index’ for the absence of disease criteria (I ad ) with a weighted sum:
 $$I_{{ad}}^{{WQ}} \,{\equals}\,{{100} \over 6}{\times}\left( {6{\minus}{{6({\rm warnings}){\plus}10({\rm alarms})} \over {10}}} \right)$$
For instance, a farm with a warning in two areas and an alarm in another will achieve an index for absence of disease (I ad ) of 63.3.
Finally, the ‘Index’ is transformed into a score using I-spline functions.
When I ad ⩽10 then:
 $$\eqalignno{&Score\,ad\,{\equals}\,(0.032168{\times}I){\plus}(0.04873{\times}I^{2} )\cr\quad\quad\quad\quad\,\,{\minus}(0.0014761{\times}I^{3} )}$$
When I ad ⩾10 then:
 $$\eqalignno{&Score\,ad\,{\equals}\,{\minus}1.4891{\plus}(0.47891{\times}I){\plus}(0.0040553{\times}I^{2} )\cr\quad\quad\quad\quad\,\,{\plus}(0.000013045{\times}I^{3} )}$$
For instance, the farm presented before which was assigned an I ad =63.33 will achieve a score of 48.42.
Multi-attribute utility theory
The measures employed to check this criterion were transformed in a first step, into an ordinal scale (no problem/warning/alarm), before determining the utility functions. The data were compared with the warning and alarm thresholds defined in the WQ protocol. The measures were grouped into the six areas defined in the WQ protocol. The area was attributed with a warning or an alarm when one of its measures was above the warning or the alarm threshold.
Utility function determination (MACBETH):
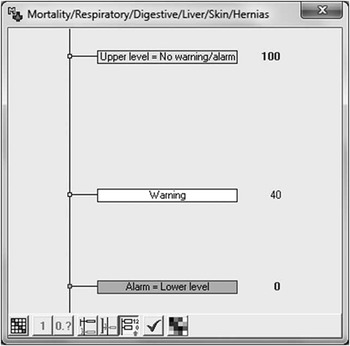
The utility function was calculated per area. We defined the six disease areas as qualitative measures where the performance levels could be recorded using the terms ‘no problem’, a ‘warning’ attributed to the area and an ‘alarm’ attributed to the area. In MACBETH, when the area was attributed a warning, a utility of 40 was assigned to it. When the area was assigned with an alarm, a utility of 0 was assigned, and when there was no problem recorded the utility assigned to the area was 100 (Figure 5). For instance, the farm presented before, will achieve a utility of 0 in the area which was assigned with an alarm, a utility of 40 for both areas which were assigned with a warning, and utilities of 100 for the rest of areas.
Utilities assigned to the performance levels of the absence of disease areas.

Aggregation with the Choquet Integral:
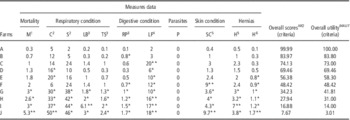
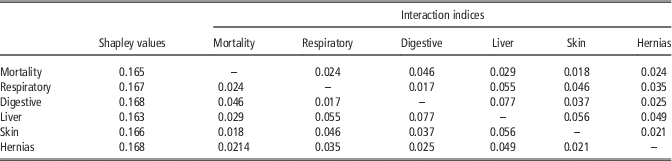
Again, 10 farms were used as learning data to determine the CI aggregation parameters (data in Table 3; the data were marked with an asterisk or a double asterisk when they were above the corresponding WQ warning or alarm thresholds, respectively). The utilities obtained for the 10 farms with MACBETH were used as subsets to express the WQ DMs’ preferences (utilities in Table 3). The results of the aggregation of the ten farms following the WQ protocol (WQ overall scores) were used as initial preferences in order to use the LS-based approach for capacity identification (WQ in Table 3). We found that the initial Shapley values resulted from aggregating the utilities with the CI varied between each area slightly, and in the WQ protocol all the areas were considered equally important. After imposing additional constraints on the Shapley values, the importance attached to all the areas was the same. Regardless, the overall utility remained equal. The interaction indices (Table 4) varied from the initial calculation of the CI and the second constrained calculation, but in both cases all the areas performed as complementary measures. For instance, we can notice that the farm presented before corresponding to Farm F is assigned an overall utility of 48.42 after the aggregation of the individual utilities for each area with the CI.
Values of absence of disease measures for each selected pig farm

WQ=Welfare Quality®; MAUT=multi-attribute utility theory.
Measures’ indices, individual utilities and overall utilities for each selected farm calculated with the WQ and the MAUT methods.
*Data over the warning threshold; **Data over the alarm threshold.
1 Percentage of mortality (M) on farm during the last 12 months.
² Average frequency of cough (C)/sneezes (S) per animal over 5 min.
3 Percentage of pigs with evidence of laboured breathing (LB)/twisted snouts (TS)/rectal prolapse (RP).
4 Percentage of pigs in herd with liquid faeces (LF).
5 Percentage of pigs scored as 2 in skin condition (SC)/hernias (H).
6 Percentage of pigs scored as 1 in hernias (H).
Shapley value and interaction indices to aggregate the measures’ utilities into the absence of disease criteria with the Choquet Integral

Example 3: ‘Absence of pain induced by management procedures’ criterion
Absence of pain induced by management procedures is assessed by two qualitative measures: castration and tail docking. These measures are taken at farm level. The farms are classified according to the presence or absence of these mutilation procedures, and if so, the use or not of anaesthetics.
Welfare Quality®
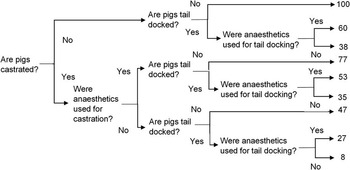
WQ uses a lexicographic valuation tree for these types of measures (Figure 6). For instance, a farm on which pigs were castrated using anaesthetics and tail docking was performed without anaesthetics will achieve an index of 35 for the absence of pain induced by management procedures.
Tree created in the MACBETH decision-support system for the criterion absence of pain induced by management procedures.

Multi-attribute utility theory.
Utility function determination (MACBETH):
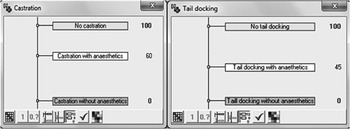
Castration and tail docking were defined in MACBETH as qualitative measures in this study. Following the WQ protocol, their performance levels were established as no castration/no tail docking, castration/tail docking with anaesthetics and castration/tail docking without anaesthetics. Figure 7 shows the MACBETH scales for each measure. For instance, the farm we presented before will achieve a utility of 60 for castration and a utility of 0 for tail docking.
Utilities assigned to the performance levels of the absence of pain induced by management procedures.

Aggregation with the Choquet Integral:
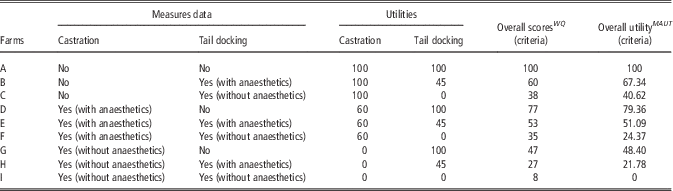
Nine farms were used as learning data to determine the CI aggregation parameters (data in Table 5). The utilities calculated with MACBETH corresponding to these farms were used as subsets employed to express the WQ DMs’ preferences (utilities in Table 5). To enable the use of the LS-based approach for capacity identification, results from aggregating the nine farms’ data following the WQ protocol were used as WQ DMs’ initial preferences (WQ overall scores in Table 5). Considering that WQ DMs were satisfied, we decided not to impose any additional constraint when aggregating the absence of injuries criterion. Table 5 demonstrates how the utilities concerning castration and tail docking obtained from the nine possible farm situations were adjusted as much as possible to the WQ scores, for this given criterion. When adjusting the utilities to the WQ DMs’ preferences, the CI parameters obtained indicated that tail docking was considered more important than castration corresponding to its Shapley values of 0.539 and 0.461. We also learnt that both measures were performing in a complementary way, with an interaction index of 0.109. For instance, we can notice that the farm presented before (Farm F) is assigned an overall utility of 24.37 after the aggregation of the individual utilities for castration and tail docking with the CI.
Data of absence of pain induced by management procedures

WQ=Welfare Quality®; MAUT=multi-attribute utility theory.
Measures’ indices, individual utilities and overall utilities for each selected farm calculated with the WQ and the MAUT methods.
Discussion
General methodology
By using the MAUT, it has been proven that the main difficulties described by Botreau et al. (Reference Botreau, Bracke, Perny, Butterworth, Capdeville, van Reenen and Veissier2007b) faced by a multi-criteria aggregation model are solved by allowing this method to assign different importance to the measures, by limiting the compensation between them and by working with data collected on different types of scales. Furthermore, the model’s flexibility allowed us to fit the WQ assessment, obtaining results that were comparable with the ones obtained by implementing the WQ protocol.
Compared with the I-spline functions used in the WQ protocol to interpret the measures in terms of welfare, the use of MACBETH presented several advantages.
First, by using MACBETH the assessment remained more transparent, which could help to explain to the stakeholders the results and to identify the causes of poor welfare while encouraging them to take efficient remedial measures which would affect the results. On the other hand, the assessment remains more flexible. With this method all the parameters can be changed according to new scientific knowledge (inclusion or exclusion of measures based on new studies on their influence in animal welfare), due to changes in societal expectations (if the welfare of animals improves significantly on all farms, stakeholders may want to be more selective when considering a farm as excellent). The main drawback of using MACBETH was related to the M-MACBETH software implementation, as it does not allow the possibility of exporting the utility functions formulae to other environments, while typing the information into the software to get the utilities of particular farms can be indeed extremely tedious when working with large amounts of data. This problem can be overcome by calculating the utility function from the individual utilities in another environment, for instance using the smooth.spline function in R.
With regard to other methods proposed for the overall evaluation of animal welfare, such as sum of ranks and sum of scores (Botreau et al., Reference Botreau, Bonde, Butterworth, Perny, Bracke, Capdeville and Veissier2007a), the use of the CI as an aggregator presented an important advantage since it allowed interaction between measures to be taken into account, thus allowing the possibility to limit the interaction between them, and in this way, solving one of the main problems described by Botreau et al. (Reference Botreau, Bracke, Perny, Butterworth, Capdeville, van Reenen and Veissier2007b). The CI was also used in the WQ protocol for the aggregation of some measures into criteria and for the aggregation of criteria into principles (Welfare Quality®, 2009).
The main difficulty in implementing the LS-based approach for CI capacity identification is that it depends on information which the DM cannot always provide, as are the overall scores for each criteria (Grabisch et al., Reference Grabisch, Kojadinovic and Meyer2008). Due to the fitting of our results in accordance with the WQ DMs’ preferences, the results obtained from the WQ model were used as initial preferences, thus avoiding this issue. However, following the study of Merad et al. (Reference Merad, Dechy, Serir, Grabisch and Marcel2013), in other circumstances, it may be difficult for the DMs to provide overall scores. Nevertheless, there are easier methods for capacity identification proposed in the literature, such as the minimum variance approach, which requires only a partial order over the farms as preference information. See Grabisch et al. (Reference Grabisch, Kojadinovic and Meyer2008) for a review of different methods for capacity identification.
Examples
In order to apply this methodology to the particular case of an Animal Welfare assessment we have found some key points to be taken into account:
Absence of injuries
Defining the performance levels in MACBETH, which the DM will have to react to is extremely important in these sorts of measures. Although theoretically, these measures can vary between 0% and 100%, in real conditions the values of the measures usually vary in a lower interval. For instance, Temple et al. (Reference Temple, Dalmau, Ruiz de la Torre, Manteca and Velarde2011) found values which varied between 0% and 5.8% animals affected with wounds on the body, between 0% and 8.1% for tail-biting and between 0% and 1.8% for severe lameness. Thus, it will be in the lower intervals of the measures in which the utility functions will have to be better fit to the DMs preferences. For instance, for lameness (Figure 4), we established that its performance levels varied in intervals of one unit between 0% and 15% lame animals. After this point, we established intervals of 10 units. In this way, we were able to fit more precisely the preferences of the DM in the lower interval of the measure.
The use of linear combinations (weighted sum), employed to combine measures which are defined in two severity categories: lameness and wounds on the body in this study, is also a key feature which can be reviewed and modified in further stages of the study. By using a linear combination, we assume that the measures can compensate each other, and thus, by using the WQ weights, a farm which has, for example, 0% moderately lame animals and 10% severely lame animals will be regarded, in terms of welfare, as a farm with 10% moderately lame animals and 6% of severely lame animals.
Although it was emphasised throughout the development of the WQ model that welfare scores should not compensate each other (Botreau et al., Reference Botreau, Bracke, Perny, Butterworth, Capdeville, van Reenen and Veissier2007b; Veissier et al., Reference Veissier, Jensen, Botreau and Sandoe2011), compensation occurred in the first stages by using linear combinations. Providing an individual utility function for each severity measure and afterwards aggregate them by using the CI could prove to be an alternative solution. On one hand, the model accuracy would increase, but on the other hand, so would the complexity of the decision process, demanding from the DMs that they interpret a higher number of measures in terms of welfare.
Absence of disease
In order to simulate the WQ DMs’ preferences, we compared the data for the absence of disease measures with the warning and alarm thresholds established in the protocol. However, in the development of the methodology, we show that by converting the original, quantitative data into an ordinal scale (three qualitative levels: no problem recorded, a warning or an alarm), it was impossible for the model to distinguish between herds which slightly or greatly exceeded the thresholds. Further, conversion into an ordinal scale might be reconsidered, and the measures should be treated as quantitative ones, using the warning and alarm thresholds as references for the DM to build the utility functions.
To stay in line with the WQ protocol preferences, we decided to create a utility function per area rather than calculate a utility per measure. Following this method, a large compensation between disease areas measures’ is allowed. For instance, looking in Table 3 at the warnings and alarms attributed to the measures gathered in the respiratory area, a warning is both attributed to the respiratory area on a farm which only has one of the measures classified with a warning (Farm E), as well as a farm which has the fourth measure classified with a warning (Farm G). The compensation of measures between disease areas is a crucial point which must be further studied.
Absence of pain induced by management procedures
A decision tree was used for these types of measures in the WQ protocol. By employing this method, the two measures were considered together, and a score for each one of the possible scenarios is given directly by the DMs. This methodology can be considered as a direct rating. Although our methodology provided us with similar results, according to Bouyssou et al. (Reference Bouyssou, Marchant, Perny, Pirlot, Tsoukias and Vincke2006), it can be concluded that the use of a direct rating method (e.g. by using decision trees) makes the methodology less intuitive as opposed to considering each measure separately and using an aggregation method based on an intuitive process, which can be easily revised.
Conclusions
To sum up, the use of the MAUT (MACBETH and CI) presented several advantages with respect to the methodology proposed in the WQ protocol. First, the utility function determination processes and the CI parameters determination processes remained more transparent than the l-spline function and the CI parameters determination processes proposed in WQ, which can help the stakeholders gain confidence in the model. Second, this method allows working with data collected on different types of scales, with no need for a previous conversion of the qualitative scales into a quantitative scale, as carried out in the absence of disease criterion. Finally, the assessment remains more flexible, with this method, all the parameters can be changed according to new scientific knowledge, due to changes in societal expectations, etc.
Acknowledgements
The present study is part of the PHENOMICS research project, which is funded by the German Federal Ministry of Education and Research.
Supplementary Material
To view supplementary material for this article, please visit http://dx.doi.org/10.1017/S1751731116001464