Introduction
The use of health-related websites by patients is becoming increasingly common, in order to acquire medical knowledge. This may occur before or following a consultation with a healthcare professional. Indeed, studies report that up to 70 per cent of the population search online for medical or health-related guidance.Reference Tonsaker, Bartlett and Trpkov1 With this explosion of access, it is paramount that the information available is accurate and reliable.
Wikipedia.org is an online repository of user-submitted material. It allows users to edit content, representing an online collaborative encyclopaedia. It has become one of the world's most trafficked websites; it comprises 5.5 million English-language articles, with an average of 600 new articles per day on various topics including health.2 Many patients access wikipedia.org for health guidance, with 4.8 billion health article page views in 2013 alone.2 The quality of wikipedia.org content has been criticised, although it can act as a useful platform, edited by numerous medical professionals in addition to the general public.Reference Shafee, Masukume, Kipersztok, Das, Haggstrom and Heilman3–Reference Azzam, Bresler, Leon, Maggio, Whitaker and Heilman5
There are a number of professional health websites targeted at doctors and the general public. Patient.co.uk is one such website. It was initially created as a partnership between 2 founding primary care physicians, and has since grown into a large medical repository containing over 2000 individual articles. The website is accessed by 18 000 visitors a month. Cancer Research UK is a national charity, with health articles provided through their website (www.cancerresearchuk.org). Similar to patient.co.uk, this is a credible source of online content, uploaded by medical professionals, specifically for patients and doctors.
This study aimed to compare online resources for a number of otolaryngological conditions, comparing healthcare-edited sites (patient.co.uk and cancerresearchuk.org) with general public edited sites (wikipedia.org), to ascertain the quality of content and ability to guide patient education regarding health-related topics.
Materials and methods
Ethical considerations
No patients were included in this study and therefore no application for ethical approval was required.
Study design
Two clinicians (NJ and KB) independently analysed the content of three separate educational websites for a variety of different otolaryngological conditions. Patient.co.uk and wikipedia.org were assessed for 10 different common and uncommon otolaryngological conditions and 2 head and neck cancer diagnoses. Diagnoses were classified as common or uncommon based on the approximate prevalence within the general population. Common diagnoses had a prevalence of over 10 per cent, whilst uncommon diagnoses had a prevalence of less than 1 per cent.6, Reference Flint, Haughey, Lund, Niparko, Richardson and Robbins7 Cancerresearchuk.org was only used for the assessment of cancer diagnoses, as this website did not include articles on any of the other topics.
The following diagnoses were included: (1) the five common conditions of epistaxis (nose bleed), allergic rhinitis, sinusitis, tonsillitis, and otitis media with effusion (glue ear); (2) the five uncommon conditions of labyrinthitis, cholesteatoma, Ménière's disease, vestibular schwannoma or acoustic neuroma, and otosclerosis; and (3) the two cancer diagnoses of laryngeal cancer and oropharyngeal cancer.
Website assessment scoring
Assessment of the websites by the clinicians focused on factorial content and ease of reading, as described below.
Factorial content assessment
A well-respected and detailed otolaryngological textbookReference Gleeson and Clarke8 was used to compile a list of important knowledge points across eight separate domains: epidemiology, aetiology, symptoms, examination signs, diagnosis investigations and tests, treatment, indications for referral to secondary care, and sources of further information.
These domains were given a score from 0 to 3 points, depending on whether the website being assessed included this information. The websites were awarded 0 points if the topic was not discussed, 1 point if there was discussion of the topic but with major omissions, 2 points if there was discussion of the topic with only minor omissions, and 3 points if there was a complete discussion of the topic. All scores were then collated to produce a final score out of 24. If individual scores from the two independent clinicians did not match, the clinicians reviewed the webpage together, and a combined score was obtained through discussion and agreement.
Ease of reading assessment
The Flesch–Kincaid grade level was calculated for each separate article. The lower the score, the easier the article was to read and understand.
Statistical analysis
Data were collated and analysed using Microsoft® Excel spreadsheet software (2009). Statistical analysis was performed with SPSS® software, version 20, using Mann–Whitney U tests (statistical significance was achieved at p < 0.05).
Results
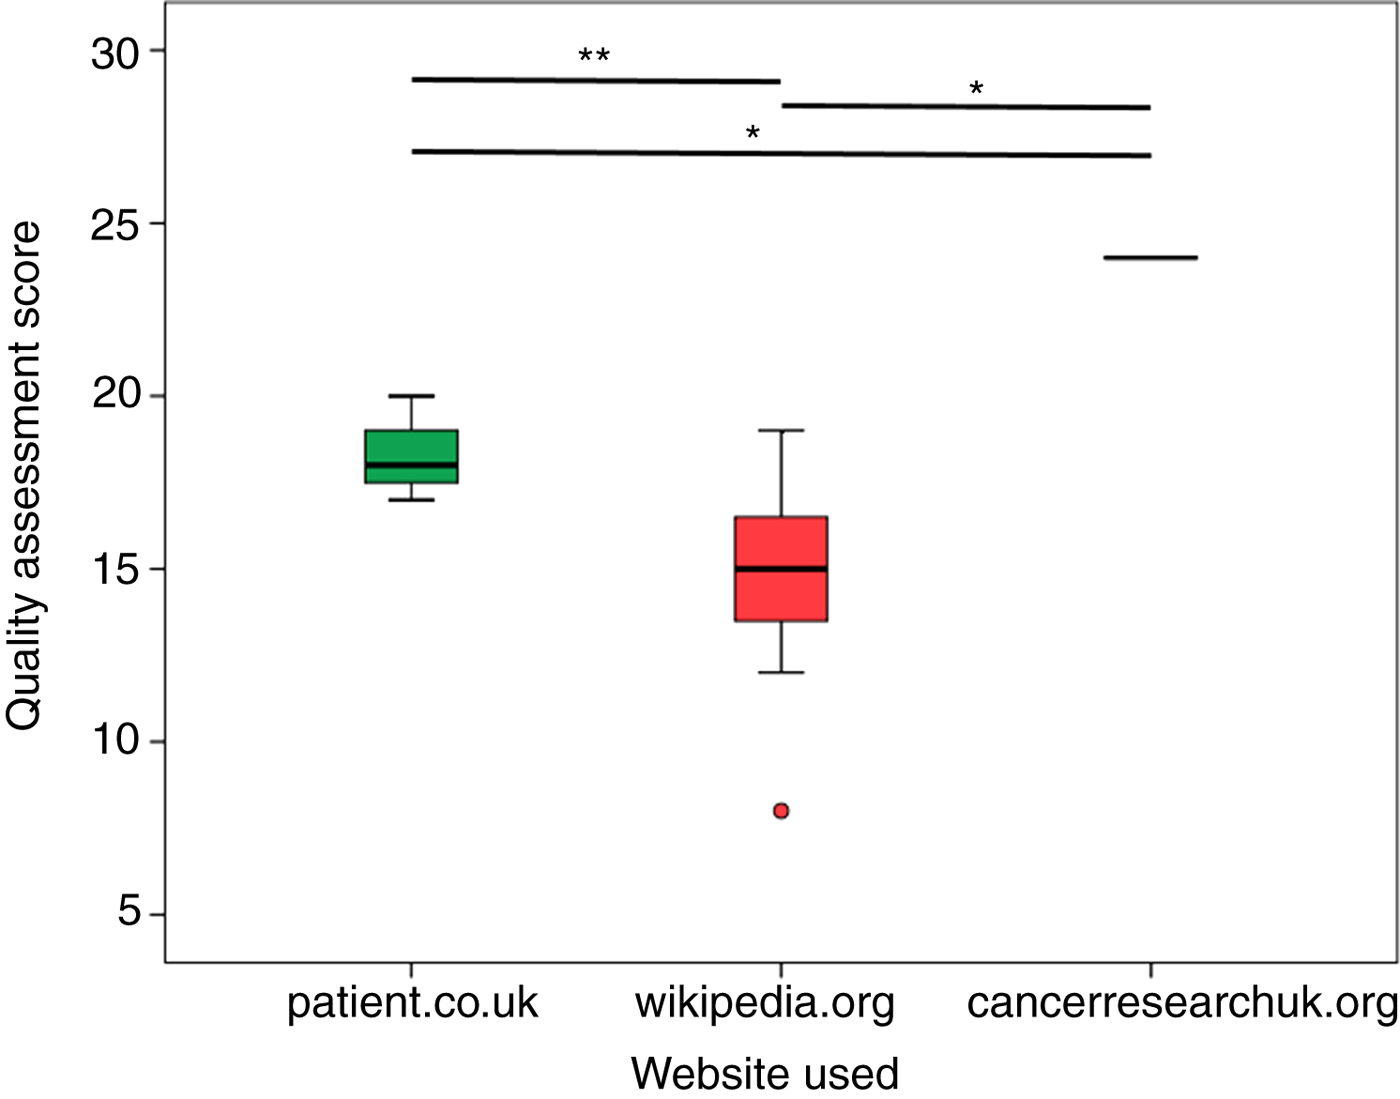
There was a statistically significant difference in the total quality assessment scores between all three analysed websites (Figure 1). Cancerresearchuk.org scored highest (mean of 24, confidence interval (CI) = 24), followed by patient.co.uk (mean of 18.25, CI = 17.6–18.9) and wikipedia.org (mean of 14.9, CI = 13.0–16.8).
Comparison of total quality assessment score (maximum of 24) between websites. Boxes represent 25–75th percentile, with whiskers representing 5–95th percentile and lines representing medians. Mann–Whitney U test undertaken: *p < 0.05, **p < 0.01 and ***p < 0.001.

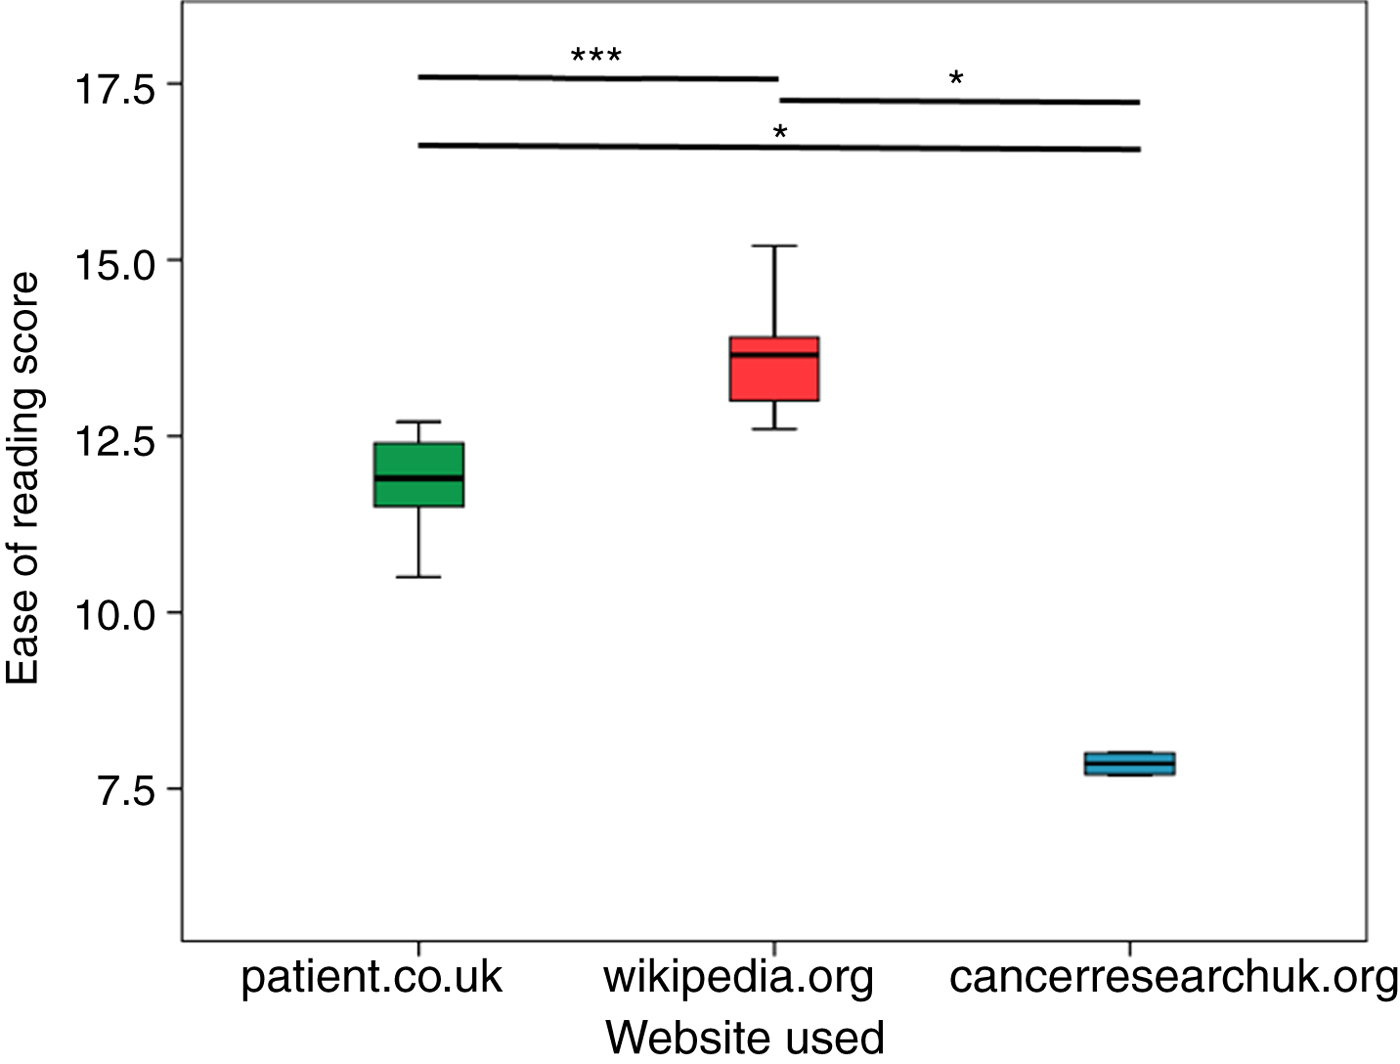
There was a significant difference in the ease of reading scores (Flesch–Kincaid grade level) between the websites (Figure 2). Cancerresearchuk.org had the lowest ease of reading score (mean of 7.9, CI = 5.9–9.8), making this the easiest to read website. This was followed by patient.co.uk (mean of 11.9, CI = 11.5–12.3) and wikipedia.org (mean of 14.6, CI = 12.2–16.9), with the latter considered the most difficult to read website.
Comparison of ease of reading score (Flesch–Kincaid) between websites. The lower the score, the easier the article was to read and understand. Boxes represent 25–75th percentile, with whiskers representing 5–95th percentile and lines representing medians. Mann–Whitney U test undertaken: *p < 0.05, **p < 0.01 and ***p < 0.001.

There was no significant difference in total quality assessment scores for common versus uncommon conditions across the websites studied. As cancerresearchuk.org was used for the assessment of only two forms of head and neck cancer, comparison of common versus uncommon diagnoses was not possible.
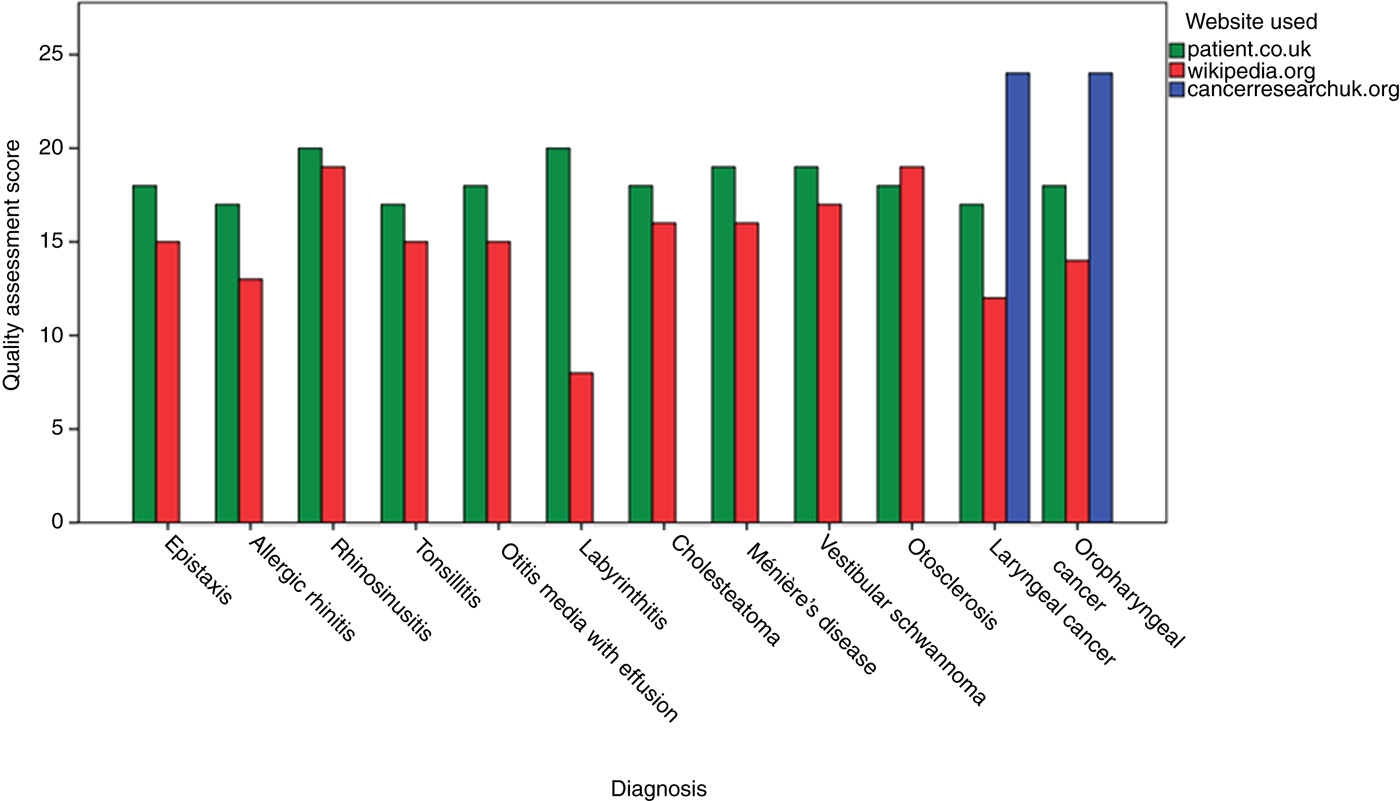
When examining the total quality assessment scores of the individual diagnoses across the websites, it was clear that wikipedia.org had the lowest scores (Figure 3). For most diagnoses, the total quality assessment score for wikipedia.org was not dramatically different from the patient.co.uk website; however, for labyrinthitis there was a large decrease.
Comparison of total quality assessment score (maximum of 24) between websites examining diagnoses.

All articles, across all websites assessed, included academic journal article references. The average number of revisions to wikipedia.org articles studied was 679 per article. All wikipedia.org articles had been revised within two months of the date of assessment (15th January 2017). Patient.co.uk and cancerresearchuk.org on the whole did not have such current revision dates; indeed, many articles had not been updated for over 18 months.
Discussion
This study revealed that cancerresearchuk.org is an excellent resource for patient education on laryngeal and oropharyngeal cancer. The patient.co.uk website also provides good information on all otolaryngological conditions assessed, across both common and uncommon diagnoses. Wikipedia.org still provided adequate information and credible references, and would reliably inform readers; however, it lacked depth and was the most difficult website to read, based on Flesch–Kincaid scores. Patients should be encouraged to access health professional maintained sites such as patient.co.uk and cancerresearchuk.org to obtain health-related information.
This is the first study in otolaryngology to assess the value of wikipedia.org, patient.co.uk and cancerresearchuk.org in terms of their ability to inform patients regarding health information. There are a limited number of studies examining the quality of online otolaryngology content for patients, which is surprising given the number of individuals who are likely to access it. A number of studies have assessed the quality of online medical information, but only a small number have focused on otolaryngological conditions.Reference Ritchie, Tornari, Patel and Lakhani9–Reference Harris, Links, Hong, Walsh, Schoo and Tunkel14
As well as scoring the best in terms of quality, cancerresearchuk.org was also the easiest to read website. The Flesch–Kincaid grade level was found to be 7.9, meaning that the reading level was aimed at the reading ability of 13–14 year olds. Not only was wikipedia.org deemed to have lower quality scores, it was also considerably more difficult to read, having a Flesch–Kincaid grade level of 14.9, with a reading age associated with a university undergraduate. Patient.co.uk was a good all-round website, containing good quality information on a wide spectrum of conditions, whilst also being easy to understand.
Wikipedia.org is a collective user-edited online encyclopaedia, with approximately 20 billion page views per month.2 Numerous patients access Wikipedia's online health articles; indeed, it received 4.8 billion health article page views in 2013 alone.2 Wikipedia.org has been criticised for providing inadequate and sometimes misleading information regarding health topics.Reference Herbert, Frings, Rehatschek, Richard and Leithner15 Nevertheless, it is regarded as a viable information platform for both doctors and patients, and remains regularly updated and free to access for all. Moreover, wikipedia.org is starting to become academically accepted, with many journals referencing wikipedia.org pages directly.Reference Bould, Hladkowicz, Pigford, Ufholz, Postonogova and Shin16 This study has found that, as in other studies, wikipedia.org was generally inferior to credible healthcare-edited websites,Reference Volsky, Baldassari, Mushti and Derkay10 with the latter scoring higher and better informing patients.Reference Ritchie, Tornari, Patel and Lakhani9 However, wikipedia.org was still able to provide mostly useful, referenced, and up-to-date information on a number of otolaryngological diagnoses.
These results further emphasise that patients should be advised to access professionally maintained health websites (such as patient.co.uk and cancerresearchuk.org). If they do happen to use wikipedia.org, on the whole, it still provides an adequate source of otolaryngological knowledge, although it lacks depth and can be difficult for patients to understand.
• Up to 70 per cent of the population search online for medical or health-related information
• Wikipedia.org health articles received over 4.8 billion page views in 2013 alone
• This study assessed quality of otolaryngology health information on wikipedia.org compared to healthcare professional edited websites
• Patients should be advised to access professionally maintained health information websites, as these have better content and are easier to read
• Wikipedia.org can provide adequate information, but it lacks depth and can be difficult for patients to understand
Competing interests
None declared.