1. Introduction
Large-graph scaling limits, such as the functional laws of large numbers (FLLNs) and the functional central limit theorems (FCLTs), of dynamical processes on random graphs have received much attention of late. Although dynamical processes on random graphs themselves have long been studied by mathematicians, physicists, epidemiologists, computer scientists, and engineers, a comprehensive and mathematically rigorous body of work on various scaling limits under general settings remains elusive. Such scaling limits have been derived rigorously only for a handful of special cases to date. Notable breakthroughs in the context of epidemiological processes include [Reference Andersson2, Reference Ball and Neal3, Reference Decreusefond, Dhersin, Moyal and Tran21, Reference Janson, Luczak and Windridge31, Reference Jacobsen, Burch, Tien and Rempała30], appearing primarily in the probability theory literature. They provide FLLNs under various sets of technical assumptions. However, scaling limits in the form of FCLTs have not been well investigated to the best of our knowledge. We are not aware of any rigorously derived FCLT for dynamical processes on random graphs, except for diffusion-type approximations attempted in special cases like an early-stage epidemic in [Reference Graham and House27] and normal approximation theorems for graph statistics in configuration model (CM) random graphs [Reference Barbour and Röllin7]. In this paper, we provide an FCLT for a particular type of binary dynamics on CM random graphs (see [Reference Van der Hofstad47, Chapter 7], [Reference Bollobás16]) as n, the number of vertices in the graph, grows to infinity.
1.1. Our contribution
In the current paper we study a stochastic compartmental susceptible–infected (SI) epidemic process on a CM random graph with a given degree distribution over a finite time interval
 $\mathcal{T}_{0} \,:\!=\, [0,T],$
for some
 $ T>0$
. In this setting, we segregate the population into two compartments, namely, S and I, containing the susceptible and the infected individuals, respectively. In addition to the sizes of these two compartments, we keep track of the counts of SI-edges (those connecting a susceptible and an infected individual) and SS-edges (those connecting two susceptible individuals). We describe the dynamical process in terms of these counts and present an FCLT for them as n grows to infinity. To be precise, let
 $ X_{{SI},i} (t)$
and
 $X_{{SS},i}(t)$
denote the numbers of infected and susceptible neighbours of a susceptible vertex i at time t. Based on these local processes, define
 \begin{align} X_{{SS}}(t) \,:\!=\, \sum_{i \in S(t)} X_{{SS},i}(t) \quad \text{and}\quad X_{{SI}}(t) \,:\!=\, \sum_{i \in S(t)} X_{{SI},i}(t) , \nonumber \end{align}
where S(t) denotes the set of susceptible vertices at time t. We will denote the set of infected vertices at time t by I(t). While
 $X_{{SI}}$
is the count of SI-type edges, the process
 $X_{{SS}}$
counts each SS-type edge twice. Let
 \begin{equation*} X(t) \,:\!=\, ( X_{{S}}(t), X_{{SI}}(t), X_{{SS}}(t) )\end{equation*}
denote the aggregated state vector of the system at time
 $t \ge 0$
, where
 $X_{{S}} (t) \,:\!=\, \mid {S(t)} \mid$
keeps track of the number of susceptible vertices. Also, let
 \begin{equation*}X_{{S}\bullet}(t)\,:\!=\, X_{{SI}}(t)+X_{{SS}}(t). \end{equation*}
An FLLN for the SI process approximates the scaled counts
 $n^{-1} X$
by the solution to a system of ordinary differential equations (ODEs). That is,
 $n^{-1} X \approx x$
for sufficiently large n, where x is the solution to the FLLN limit ODE. In this paper, we prove an FCLT for the fluctuations of the scaled process
 $n^{-1} X$
around the FLLN limit x. Our main result (Theorem 2 in Section 4.3) asserts that, under appropriate technical assumptions, the fluctuation process
 $Y(t)\,:\!=\, \sqrt[]{n} \!\left( n^{-1} X(t) - x(t) \right)$
converges weakly to a Gaussian vector semimartingale in
 $D^{(3)}$
, the space of real 3-dimensional vector-valued càdlàg functions on
 $\mathcal{T}_{0}$
endowed with the Skorokhod topology.
The technical assumptions needed for the result to hold will be made precise later in Section 3. A precise statement of the FCLT result with additional discussion and further details is presented in Section 4.
1.2. Proof strategy and paper outline
Our derivation relies on the application of an FCLT for local martingales due to Rebolledo, referred to as the Rebolledo theorem hereinafter. In [Reference Rebolledo44], Rebolledo provided sufficient conditions for the convergence of local martingales to a continuous Gaussian (vector) martingale in terms of the associated optional and predictable quadratic variation processes, and the martingale process containing ‘big’ jumps of the original process. Helland later provided a simpler proof of the Rebolledo theorem in [Reference Helland28]. For our purpose, we do not need the Rebolledo theorem in its full generality; a version of it tailored to the setting of square-integrable martingales suffices, and for the sake of completeness we provide the statement of such a version in Appendix C.
The first step towards the FCLT is to perform a Doob–Meyer decomposition ([Reference Meyer36]) of the semimartingale of the vector of counts into a zero-mean martingale and a compensator. Then one can show that the predictable quadratic variation of the appropriately scaled martingale process converges in probability to a deterministic quantity. Furthermore, in the limit, its sample paths turn out to be close to continuous in the sense that their ‘big’ jumps vanish. Weak convergence in the sense of [Reference Billingsley14] is then established by applying the Rebolledo theorem.
The rest of the paper is structured as follows. The construction of the CM random graph and the epidemic process on it are described in detail in Section 2. In Section 3, we make our technical assumptions precise and provide a law of large numbers, before presenting our FCLT (Theorem 2) in Section 4. Necessary technical lemmas are also discussed leading up to the FCLT. In Section 5, we discuss applications of our FCLT in percolation theory (from a non-equilibrium statistical mechanics point of view), and in computer science in the context of spread of computer viruses. In Section 5, we also discuss the peculiar case of Poisson-type degree distributions under which the correlation-equations-based mean-field pair approximation approach correctly estimates the limiting process. For illustration, we provide simulation results for some common degree distributions.
2. The SI process on CM random graphs
2.1. Notational conventions
We use the symbols
 $\mathbb{N}$
and
 $\mathbb{R}$
to denote the set of natural numbers and the set of real numbers, respectively. Also, we use
 $\mathbb{N}_0 \,:\!=\, \mathbb{N} \cup \{0\}$
and
 $\mathbb{R}_{+} \,:\!=\, \mathbb{R} \setminus ({-}\infty,0]$
. Given
 $R \subseteq \mathbb{R}$
, we denote the
 $\sigma$
-field of Borel subsets of R by
 $\mathcal{B} ({R})$
. Recall
 $\mathcal{T}_{0} \,:\!=\, [0, T]$
for some
 $t>0$
. We denote by
 $D=D(\mathcal{T}_{0})$
the space of real functions on
 $\mathcal{T}_{0}$
that are right continuous and have left-hand limits. Functions in D are called càdlàg. Unless otherwise mentioned, the space D is assumed to be endowed with the Skorokhod topology [Reference Billingsley14, Chapter 3], which turns D into a Polish space. We call D the Skorokhod space. Let the triplet
 $(\Omega, \mathcal{F}, \mathbb{P})$
denote our probability space. For an event A, we use
 $\mathsf{1}\!\left({A}\right)$
to denote the indicator (or characteristic) function of A. We shall use the shorthand notation
 $ ( a)_{b} = a(a-1)(a-2)\cdots(a-b+1)$
for
 $a>b$
and
 $a,b \in \mathbb{N}$
. The symbols
 $\mathop{}\!O{\left({.}\right)}$
and
 $\mathop{}\!o{\left({.}\right)}$
are the big-O and small-o notation, respectively, and they carry their usual meanings. For a differentiable function f defined on some set
 $E \subseteq \mathbb{R}^d$
, we denote its partial derivative with respect to the ith variable by
 $\partial_i\, f$
, for
 $i= 1,2, \ldots, d$
. With some abuse of notation, we use
 $\partial f(x)$
to denote the derivative of a differentiable function of a single variable at x. For a stochastic process Z(t) with paths in D, we denote the associated jump process
 $Z(t)-Z(t{-})$
by
 $\delta Z(t)$
. We also define
 $\mathcal{T} \,:\!=\, (0,T] \subset \mathcal{T}_{0}$
.
2.2. Model
We begin with the class of all CM random graphs [Reference Van der Hofstad47, Chapter 7] with n vertices, for
 $n \in \mathbb{N}$
. The main advantage of the CM is that it allows one to fix the degrees before constructing the graph itself. There are numerous real-life situations where random graphs with a prescribed degree sequence (or a probability distribution for the degree sequence) are reasonable and intuitive. See [Reference Van der Hofstad47, Chapter 7] for some examples.
Given degrees
 $d_1,d_2, \ldots, d_n$
for n vertices, we first assign
 $d_i$
half-edges to vertex i. The CM random graph is then obtained by matching (or pairing) all available half-edges uniformly at random. Two paired half-edges form an edge. We assume the degrees
 $d_1, d_2, \ldots, d_n$
are drawn from a probability distribution, which we call the degree distribution. If the sum of the drawn degrees is not even, we add a parity half-edge to the last vertex. That is, we first draw
 $d_1, d_2, \ldots, d_{n-1}$
and
 $d_{n}^{\prime}$
as an independent and identically distributed random sample from the degree distribution and then set
 $d_n \,:\!=\, d_{n}^{\prime} + \mathsf{1}\!\left({d_{n}^{\prime} + \sum_{j=1}^{n-1} d_j\ \text{is odd}}\right)$
. However, for large n the contribution of the added indicator function is negligible with probability one (see, e.g., [Reference Van der Hofstad47, Section 7.6, p. 239]), and we will thus ignore it in our asymptotic calculations.
Additionally, we assume the first three moments of the degree distribution are finite. Note that, by matching half-edges uniformly at random, we obtain a multigraph, because the resulting graph may have self-loops and multiple edges. Interestingly, when the degrees
 $d_1, d_2, \ldots, d_n$
are drawn independently, [Reference Durrett23, Theorem 3.1.2] states that as the number of vertices grows to infinity, the numbers of self-loops and parallel edges have independent Poisson limits whose means depend only on the first two moments of the degree distribution. Since the focus of this paper is on the functional limit of the fluctuations of the scaled stochastic process
 $n^{-1}X$
, the contributions of self-loops and parallel edges are negligible in the limit. Therefore, we will ignore self-loops and parallels edges in our calculations of the asymptotic terms.
Let us denote the probability generating function of the underlying degree distribution by
 $\psi$
, i.e.,
 \begin{equation}\psi(x) \,:\!=\, \sum_{k} x^k p_k ,\end{equation}
where
 $p_k$
is the probability that a randomly chosen vertex has degree k, for
 $k \in \mathbb{N}_0$
. We denote the class of all CM random graphs with n vertices by
 $\mathcal{G}(\psi,n)$
.
A half-edge is referred to as SI-type (resp., IS-type) if it originates at a susceptible (resp., infected) vertex and is a part of an SI-type edge. Similarly, an SS-type half-edge is a part of an SS-type edge and an II-type half-edge is a part of an II-type edge (connecting two infected individuals).
We consider the Markovian SI model on CM random graphs. Each infected individual (represented by a vertex of the graph) infects one of its neighbours at rate
 $\beta >0$
, independently of the other neighbours. We split the population into two compartments consisting respectively of the susceptible and the infected individuals. In order to prove the FCLT result outlined in the introduction, we need to approximate the probability distributions of the counts
 $X_{{S}}$
,
 $X_{{SI}}$
, and
 $X_{{SS}}$
, which requires us to calculate the probability that a susceptible vertex of degree k has l infected neighbours, for
 $l\le k$
. As we explain below, obtaining this probability is particularly easy if we allow the graph to be constructed dynamically as the infection spreads. Consequently, we adopt the following dynamic construction of the graph first proposed in [Reference Decreusefond, Dhersin, Moyal and Tran21].
Dynamic construction of the graph. Suppose we are given n vertices with degrees (or numbers of half-edges)
 $d_1, d_2, \ldots, d_n$
. A subset of size
 $X_{{S}}(0)$
of n vertices is chosen uniformly at random. Those vertices are designated as susceptible, and the remaining vertices as infected. Note that since we can write
 \begin{equation*}X_{{SI}}(t) = \sum_{i\in I(t)} X_{{IS},i}(t) , \end{equation*}
where
 $X_{{IS},i}(t)$
denotes the number of IS-type half-edges originating at an infected vertex i at time t, it suffices to follow the infected vertices in the dynamic construction.
We start at time
 $t=0$
by infecting a random subset of vertices and revealing their connections by matching their half-edges uniformly at random with the available half-edges (see below). We then associate with each IS-type half-edge an independent exponential clock with parameter
 $\beta$
. The first of all these clocks that rings determines the next event. Therefore, at time t we know that the next infection will take place in a time exponentially distributed with parameter
 $\beta X_{{SI}}(t)$
. Let
 $t^\ast>t$
denote the time of the next infection, with its left limit denoted by
 $t^\ast\!\!-$
. At
 $t^\ast$
, we update the state of the epidemic as follows.
-
Step 1. We randomly match the IS-type half-edge that has rung to a half-edge originating from a susceptible vertex. This susceptible vertex is newly infected with degree, say, k.
-
Step 2. We choose uniformly
 $k - 1$
half-edges among all the available half-edges (they are either of type IS or of type SS). Let
$n_{{IS}}$
(resp.,
$n_{{SS}}$
) be the number of IS-type (resp., of SS-type) half-edges drawn among these
$k - 1$
half-edges. Note that the probability of drawing a specific pair
$(n_{{IS}},n_{{SS}})$
is given by the hypergeometric distribution The chosen
\begin{equation*}\frac{\binom{X_{{SI}}(t^\ast\!\!-)}{n_{{IS}}}\binom{X_{{SS}}(t^\ast\!\!-)}{n_{{SS}}}}{\binom{X_{{S}\bullet}(t^\ast\!\!-)}{k-1}}.\end{equation*}
$n_{{IS}}$
half-edges of type IS determine the infected neighbours of the newly infected individual. The remaining
$n_{{SS}}$
edges of type SS remain open in the sense that the susceptible neighbour is not fixed.
-
Step 3. We change the status of the
$n_{{IS}}$
(resp.,
$n_{{SS}}$
) IS-type (resp., SS-type) edges created to II-type (resp., SI-type). -
Step 4. We change the status of the newly infected from S to I and wait for the next clock to ring at a new time
$t^{\ast\ast}>t^\ast$
to repeat Steps 1–4. The process stops when there are no more IS-type half-edges.


The above algorithm (see Figure 1 for a pictorial representation) gives rise to the natural filtration
 $\mathcal{F}_{t}$
as the
 $\sigma$
-field generated by the process history up to and including time
 $t>0$
[Reference Durrett22, Chapter 1, p. 14]. The filtration
 $\mathcal{F}_{t}$
includes information about the status of all vertices (susceptible or infected), and all paired and unpaired half-edges. To be precise, we define
 \begin{align} \mathcal{F}_{t} \,:\!=\, \sigma\!\left(\{S(s), I(s), \{X_{{IS},i}, X_{{II},i}\}_{i \in I(s)} \mid s \le t \}\right) . \nonumber\end{align}
We let
 $\mathcal{F}_{0}$
contain all
 $\mathbb{P}$
-null sets in
 $\mathcal{F}$
. We include all
 $\mathbb{P}$
-null sets in
 $\mathcal{F}_{0}$
so that the filtration family
 $\{\mathcal{F}_{t} \}$
is complete. It is also right continuous (i.e.,
 $\mathcal{F}_{t+}=\mathcal{F}_{t}$
for every
 $t\geq 0$
, where
 $\mathcal{F}_{t+} \,:\!=\, \cap_{s >0} \mathcal{F}_{t+s}$
is the
 $\sigma$
-field of events immediately after t), because it is generated by a right continuous jump process [Reference Andersen, Borgan, Gill and Keiding1, Chapter II, p. 61]. Therefore, the usual Dellacherie conditions on
 $\{\mathcal{F}_{t} \}$
are satisfied [Reference Rebolledo44, Reference Karatzas and Shreve33, Reference Fleming and Harrington25]. We denote the
 $\sigma$
-field of events strictly prior to
 $t \in \mathbb{R}_{+}$
by
 $\mathcal{F}_{t-}$
and write
 $\mathcal{F}_{0-} \,:\!=\, \mathcal{F}_{0}$
, by convention.
Dynamics of the stochastic SI model over a finite time interval
 $\mathcal{T}_{0}$
. Susceptible vertices are shown in yellowish green and infected vertices in dark red. Different types of edges are shown in different colours. (a) State of the system at a given time. We know the degree of each vertex. For each infected vertex, we know the number of infected neighbours it has (the number of
 ${II}$
-type edges, which are shown in solid red) and the number of
 ${IS}$
-type half-edges emanating from it, which are shown in dashed blue. The green dotted half-edges emanating from the susceptible vertices are of undetermined types. (b) An
 ${IS}$
-type half-edge rings and is randomly matched with a half-edge originating from a susceptible vertex. A full edge is thus formed. (c) We change the status of the chosen susceptible vertex to infected (and change its colour to dark red). (d) We determine the types of the remaining half-edges of the newly infected vertex.

Denote the collection of vertices of degree k that remain susceptible at time t by
 $S_k(t)$
. Recall that
 $X(t) \,:\!=\, \big( X_{{S}}(t), X_{{SI}}(t), X_{{SS}}(t) \big)$
denotes the aggregated state vector of the system at time
 $t \ge 0$
. Note that, since we may calculate
 $X_{{SS}}(t)$
if we know
 $X_{{SI}}(t)$
and
 $X_{{II}}(t)$
, the process X is adapted to
 $\mathcal{F}_{t}$
. However, the process X itself is not necessarily Markovian. Let
 $\tilde{X} \,:\!=\, (X_{{SI},i}, X_{{SS},i})_{i \in S} $
. By the Doob–Meyer decomposition theorem [Reference Meyer36], we decompose X as
 \begin{align}X(t) = X(0)+ \int_{0}^{t} \mathbb{F}_{{X}} \!\left({\tilde{X}(s)} \right) \, {d} {s} + M^{\prime}(t) ,\end{align}
where
 $M^{\prime}(t) \,:\!=\, ( M^{\prime}_{{S}}(t), M^{\prime}_{{SI}}(t), M^{\prime}_{{SS}}(t)) $
is a zero-mean martingale adapted to the filtration
 $\mathcal{F}_{t}$
, and
 $\mathbb{F}_{{X}} \big({\tilde{X}} \big) \,:\!=\, \big(\mathbb{F}_{{{S}}} \big({\tilde{X}} \big) , \mathbb{F}_{{{SI}}} \big({\tilde{X}} \big), \mathbb{F}_{{{SS}}} \big({\tilde{X}} \big) \big)$
is an integrable function given by
 \begin{align}\begin{aligned}\mathbb{F}_{{{S}}} \!\left({\tilde{x}} \right) & \,:\!=\, -\beta x_{{SI}} , \\\mathbb{F}_{{{SI}}} \!\left({\tilde{x}} \right) & \,:\!=\, \sum_{i \in S} \beta x_{{SI},i} \big(x_{{SS},i}- x_{{SI},i}\big) , \\\mathbb{F}_{{{SS}}} \!\left({\tilde{x}} \right) & \,:\!=\, -2 \sum_{i \in S} \beta x_{{SI},i} x_{{SS},i} ,\end{aligned}\end{align}
for
 $\tilde{x}\,:\!=\, (x_{{SI},i}, x_{{SS},i})_{i \in S}$
and
 $x_{{SI}} \,:\!=\, \sum_{i \in S} x_{{SI},i}, x_{{SS}} \,:\!=\, \sum_{i \in S} x_{{SS},i}$
. The first equation follows from the fact that the number of susceptible vertices decreases by 1 at rate
 $\beta X_{{SI}}$
because of the Markovian assumption on the SI process and the independence of the infection transmissions along the edges. Similarly, when a susceptible vertex i gets infected, which happens at rate
 $\beta X_{{SI},i}$
(again because of the independence of infection transmissions along each of its
 $X_{{SI},i}$
infectious edges), the SI edges connected to that susceptible vertex turn into II-type edges, whereas its SS-type edges turn into SI-type edges. Therefore, the net change in the total count of SI-edges is
 $\big(X_{{SS},i} - X_{{SI},i}\big)$
whenever a susceptible vertex i gets infected. Because of the independence assumption, we sum over all susceptible vertices to arrive at the second equation. See Figure 2 for a visualization. The third equation can be explained similarly by computing the rates and the corresponding net changes in the total count of SS-edges when a susceptible vertex gets infected.
Change to the edge counts. When a susceptible vertex i gets infected (turns red from green; see Step 2 of the dynamic construction), the SI edges attached to that vertex turns into II edges, whereas SS edges become new SI edges. This visualization is helpful in understanding the Doob–Meyer decomposition in Equation (2.2).

We note that as a consequence of the uniformly-at-random matching of half edges in the dynamic construction, similarly to Step 2, we obtain also the following hypergeometric distribution (see also [Reference Jacobsen, Burch, Tien and Rempała30]) for the number of infected and susceptible neighbours of a susceptible vertex of degree k at time t.
Lemma 1. For
 $k \in \mathbb{N}_0$
and
 $i \in S_k(t)$
, conditionally on the process history until time t, the vector
 $(X_{{SI},i}(t), X_{{SS},i}(t))$
follows the hypergeometric distribution
 \begin{align}\mathbb{P}\!\left({X_{{SI},i}(t)= n_{{SI}}, X_{{SS},i}(t)= n_{{SS}} \mid \mathcal{F}_{t}}\right) ={}& \frac{\binom{X_{{SI}}(t)}{n_{{SI}}} \binom{X_{{SS}}(t)}{n_{{SS}}}}{\binom{X_{{S} \bullet}(t)}{k}} , \end{align}
supported on
 $n_{{SI}}+ n_{{SS}}= k$
, where
 $n_{{SI}},n_{{SS}} \in \mathbb{N}_0$
.
Proof. Consider
 $X_{SI}(t)$
, the number of half-edges of type IS emanating from the set of infected vertices. By construction, they all connect to the susceptible vertices uniformly at random. Thus the probability that
 $n_{{SI}}$
of them connect to a given vertex
 $i\in S_k$
when a total of
 $X_{{S} \bullet}(t)$
half-edges are available to choose from is
 \begin{equation*} \frac{\binom{k} {n_{SI}} \binom{X_{{S} \bullet}(t)-k}{{X_{SI}(t)}-n_{SI}}}{\binom{X_{{S} \bullet}(t)}{X_{SI}(t)}},\end{equation*}
which works out to be the same as the hypergeometric probability (2.4).
Since we partition the collection of susceptible vertices S(t) by their degree
 $k \in \mathbb{N}_0$
, we have
 $S(t) = \cup_k S_k(t)$
. Therefore,
 $X_{{S}}(t) = \sum_k X_{S_k}(t)$
, where
 $X_{S_k}(t)$
is the size of
 $S_k(t)$
. Note that
 $X_{{S}\bullet}(t) = \sum_{k} k X_{S_k}(t)$
. To study the large graph limit of the system, we also define the quantity
 \begin{align}\theta(t) \,:\!=\, {}& \exp \biggl({-\beta \int_{0}^{t} \frac{X_{{SI}}(s)}{X_{{S}\bullet}(s)} \, {d} {s}} \biggr),\end{align}
which can be intuitively described as the probability that a degree-1 vertex that was susceptible at time zero remains susceptible till time
 $t >0$
([Reference Volz48, Reference Miller37, Reference Miller, Slim and Volz38]). It may be described equivalently as
 \begin{align}\theta(t) = \theta(0) + \int_{0}^{t} \mathbb{F}_{{0}} \!\left({X_{{SI}}(s),X_{{S}\bullet}(s), \theta(s)} \right) \, {d} {s} , \nonumber\end{align}
where
 $\theta(0) =1$
and
 $\mathbb{F}_{{0}} \!\left({X_{{SI}},X_{{S}\bullet}, \theta} \right) \,:\!=\, - \beta \theta \dfrac{X_{{SI}}}{X_{{S}\bullet}}$
.
3. The law of large numbers
As done in [Reference Jacobsen, Burch, Tien and Rempała30], we make the following technical assumptions. Unless otherwise stated, all limits below and elsewhere in the paper are taken in the large graph limit, i.e. as
 $n\to \infty$
.
-
A1 There exists a positive constant
$c_{{S}\bullet}$
such that
$\mathbb{P}\!\left({n^{-1} X_{{S}\bullet}(T) > c_{{S}\bullet}} \right)\to 1$
. -
A2 The fraction of initially susceptible vertices is non-random and converges to some
$\alpha_{{S}}$
, i.e., (3.1)We also assume that the initially infected and susceptible vertices are selected uniformly at random and
\begin{align} n^{-1} X_{{S}}(0) & \rightarrow \alpha_{{S}} . \end{align}
$0<\alpha_{{S}} <1$
.
-
A3 The degree distribution
$\{p_k\}$
satisfies
$\sum_k k^3 p_k < \infty$
.


We note that by virtue of the uniformly-at-random selection of the infected vertices at time zero, A2 also implies (see [Reference Jacobsen, Burch, Tien and Rempała30])
 \begin{align} \begin{aligned} n^{-1} X_{{I}}(0) & \rightarrow \alpha_{{I}} = 1- \alpha_{{S}} >0 , \\ n^{-1} X_{{SI}}(0) & \rightarrow \alpha_{{SI}}= \alpha_{{S}} (1- \alpha_{{S}}) \partial \psi(1) , \\ n^{-1} X_{{SS}}(0) & \rightarrow \alpha_{{SS}}= \alpha_{{S}}^2 \partial \psi(1) . \end{aligned} \end{align}
Below, for simplicity, we use the vector notation
 $\alpha \,:\!=\, (\alpha_{{S}} , \alpha_{{SI}}, \alpha_{{SS}})$
. The process
 $X_{{I}} $
captures the number of infected individuals. Although it appears that the assumption A1 may be unnecessary, we retain it for the sake of consistency with the work [Reference Jacobsen, Burch, Tien and Rempała30] since in our FCLT derivations we rely on some of the results obtained there.
We note that simulating the stochastic system satisfying A1, A2, and A3 is straightforward with the help of the dynamic construction described above. Indeed, for a given choice of degree distribution satisfying A3 with mean degree
 $\partial \psi(1) $
, we may draw degrees
 $d_1, d_2, \ldots, d_n$
and assign
 $d_i$
half-edges to vertex i. Then we initialize the number of infected and susceptible nodes as in the dynamic graph construction above, assigning the initial proportions according to
 $\alpha$
. We then run the epidemic process following the dynamic construction up until a finite time T, which is independent of n, when there are still susceptible vertices left. This simulation algorithm also constructs the stochastic process X satisfying A1, A2, and A3.
For
 $f \,:\, \mathbb{R} \rightarrow \mathbb{R}$
and
 $r \in \mathbb{N} $
, the quantity
 $f^r$
is understood as
 $(r-1)$
-times multiplication of f with itself, for
 $r \in \mathbb{N}_0$
, with the convention
 $f^0 \,:\!=\, 1$
. The symbol
 $\partial ^r f$
denotes the rth derivative of the function f, and by convention we write
 $\partial f \,:\!=\, \partial ^1 f$
. Now, define the operator
 $\mathbb{D}^{r} {f}$
as
 \begin{align}\mathbb{D}^{r} {f} \,:\!=\, f^{r-1} \frac{\partial ^r f}{(\partial f )^r} ,\end{align}
for
 $f \,:\, \mathbb{R} \rightarrow \mathbb{R}$
and
 $r \in \mathbb{N}$
, whenever the division of
 $\partial ^r f$
by
 $(\partial f )^r$
is permissible, i.e.,
 $\partial f \neq 0$
. The operator
 $\mathbb{D}^{r} {}$
is used to capture the impact of the graph structure on the limiting dynamics through the degree distribution. Let
 $x \,:\!=\, (x_{{S}}, x_{{SI}}, x_{{SS}})$
, and let
 $\theta \,:\, \mathbb{R}_{+} \to [0,1]$
be a function. Then define
 $\kappa(\vartheta)$
as
 \begin{align} \kappa(\vartheta) \,:\!=\, \mathbb{D}^{2} {\psi \circ \vartheta} . \end{align}
Note that
 \begin{align}\kappa(\vartheta)(x) = {}& \frac{\psi(\vartheta (x)) \partial^2 (\psi\circ \vartheta)(x) )}{(\partial (\psi\circ\vartheta) (x))^2}, \qquad x \in \mathbb{R} .\end{align}
If
 $(x,\vartheta)$
is the large graph FLLN limit of
 $(n^{-1} X, \theta)$
, then, following [Reference Jacobsen, Burch, Tien and Rempała30, Section 3.3.3], we interpret
 $\kappa(\vartheta)$
as the limiting ratio of the average excess degree of a susceptible vertex chosen randomly as a neighbour of an infectious individual, to the average degree of a susceptible vertex
 $\mu_{{S}}$
. The quantity
 $\kappa(\vartheta)$
allows us to count various pairs accurately. In general, the operator
 $\mathbb{D}^{r+1} {\psi\circ \vartheta} $
recursively compares the excess degree of a susceptible vertex randomly chosen as a neighbour of r infected individuals with that of a randomly chosen susceptible vertex. Therefore, it allows us to count various r-configurations (different subgraph structures on r vertices, e.g., triples, quadruples, etc.) accurately in the limit. To be precise, in Lemma 5 in Appendix B, we explicitly show
 \begin{align} \mathbb{D}^{r+1}{\psi\circ \theta} = \frac{\mu_{{S}}^{(r)} (\theta)}{\mu_{{S}} (\theta)} \mathbb{D}^{{r}} {\psi\circ \theta} \xrightarrow[]{{P}} \mathbb{D}^{r+1} {\psi\circ \vartheta} , \end{align}
where
 $ \mu_{{S}}^{(r)}$
is the average excess degree of a susceptible vertex randomly chosen as a neighbour of r infected individuals. In Appendix B, we calculate these quantities explicitly.
Let us also define the operator
 $\mathbb{H} \!\left( {x,\vartheta} \right) \,:\!=\, (\mathbb{H}_{{x}} \!\left( {x, \vartheta} \right), \mathbb{H}_{{0}} \!\left( {x, \vartheta} \right) )$
, where
 $\mathbb{H}_{{x}} \!\left( {x,\vartheta} \right) \,:\!=\,(\mathbb{H}_{{{S}}} \!\left( {x, \vartheta} \right),\mathbb{H}_{{{SI}}} \!\left( {x, \vartheta} \right),\mathbb{H}_{{{SS}}} ( {x, \vartheta} ) )$
and
 $ \mathbb{H}_{{0}} \!\left( {x, \vartheta} \right) $
are given by
 \begin{equation}\begin{aligned}\mathbb{H}_{{S}} \!\left( {x, \vartheta} \right) & \,:\!=\, -\beta x_{{SI}} , \\\mathbb{H}_{{SI}} \!\left( {x, \vartheta} \right) & \,:\!=\, \beta \kappa(\vartheta) \frac{x_{{SI}}}{x_S} (x_{{SS}}- x_{{SI}}) - \beta x_{{SI}} , \\\mathbb{H}_{{SS}} \!\left( {x, \vartheta} \right) & \,:\!=\, -2 \beta \kappa(\vartheta) \frac{x_{{SI}} x_{{SS}}}{x_S} , \\\mathbb{H}_{{0}} \!\left( {x, \vartheta} \right) & \,:\!=\, -\beta\frac{x_{{SI}}}{\alpha_{{S}} \partial \psi(\vartheta)} .\end{aligned}\end{equation}
Now, noting that A1 implies
 $P(X_{{S}\bullet} >k)\to 1 $
for any
 $k>0$
and 3 implies
 $\sum_k k^2 p_k < \infty$
, recall the strong law on large graphs due to [Reference Jacobsen, Burch, Tien and Rempała30]. In the following we take the norm
 $\left\lVert{.}\right\rVert$
to be the standard Euclidean norm.
Theorem 1. Assume A1, A2, and A3 for a CM graph
 $\mathcal{G}(\psi, n)$
. Then, for any
 $ T >0 $
, the following holds:
 \begin{equation*} \sup_{0 <t \le T} \left\lVert{( X(t)/n, \theta(t)) - (x(t), \vartheta(t))}\right\rVert \xrightarrow[]{{P}} 0 , \end{equation*}
where
 $(x, \vartheta) \,:\!=\, ( (x_{{S}}, x_{{SI}}, x_{{SS}}), \vartheta )$
is the solution of
 \begin{equation} (x (t) , \vartheta(t) )= (x(0) , \vartheta(0)) + \int_{0}^{t} \mathbb{H}_{{}} \!\left( {x(s) , \vartheta(s)} \right) \, {d} {s} , \end{equation}
with the initial condition
 $x(0) = \alpha $
and
 $\vartheta(0) =1$
.
Observe that in the absence of recovery, the numbers of susceptible and infected individuals are linearly related as
 $X_{{S}}+X_{{I}} =n$
in the standard susceptible–infected–recovered (SIR) model. The proof therefore follows immediately from setting the recovery rate in the SIR model to zero and assuming that there is only one layer in [Reference Jacobsen, Burch, Tien and Rempała30]. The crucial observation is that the neighbourhood distribution of a susceptible vertex, conditional on the process history, can be expressed as a hypergeometric distribution (see Lemma 1) whose mixed moments can be approximated by the corresponding multinomial ones. This allows us to ‘average out’ the individual-based quantities such as
 $X_{{SI},i}$
for
 $i \in S$
. The convergence is then established by calculating several quadratic variations. The proof of our FCLT, presented in Section 4, exploits similar calculations.
4. Functional central limit theorem
Having obtained the FLLN, we now derive an FCLT for X after an appropriate scaling. To this end, we begin by first defining the scaled martingale process
 \begin{align} M(t) ={}& ( M_{{S}}(t), M_{{SI}}(t), M_{{SS}}(t)) \,:\!=\, n^{-1/2} M^{\prime} (t) ,\end{align}
which is square-integrable. We study the quadratic variation of the scaled martingale M(t). The idea is to check whether either the optional or the predictable quadratic variation of the scaled process M converges in probability to a deterministic limit. If either of them does, and if the paths of M become approximately continuous in the limit (‘big’ jumps disappear), we can make use of the Rebolledo theorem (see Appendix C, as well as [Reference Rebolledo44, Reference Helland28]) to establish the asymptotic limit.
For each
 $\epsilon > 0$
, define
 \begin{align}M^\epsilon(t) \,:\!=\, {}& \Big( M_{{S}}^\epsilon(t), M_{{SI}}^\epsilon(t), M_{{SS}}^\epsilon(t)\Big)\end{align}
to be a vector of square-integrable martingales (only) containing all jumps of M(t) larger in absolute value than
 $\epsilon$
.
We use the shorthand notation
 $ \left\langle {M} \right\rangle (t)$
for the
 $3 \times 3$
matrix of predictable covariation processes of the components of M(t). That is,
 \begin{align} \left\langle {M} \right\rangle (t) \,:\!=\, & \begin{pmatrix} \left\langle {M_{{S}}} \right\rangle (t) & \quad \left\langle {M_{{S}} , M_{{SI}}} \right\rangle (t) & \quad \left\langle {M_{{S}} ,M_{{SS}}} \right\rangle (t) \\[3pt] \left\langle {M_{{SI}} ,M_{{S}}} \right\rangle (t) & \quad \left\langle {M_{{SI}}} \right\rangle (t) & \quad \left\langle {M_{{SI}} , M_{{SS}}} \right\rangle (t) \\[3pt] \left\langle {M_{{SS}}, M_{{S}}} \right\rangle (t) & \quad \left\langle {M_{{SS}} , M_{{SI}}} \right\rangle (t) & \quad \left\langle {M_{{SS}}} \right\rangle (t) \\\end{pmatrix}.\end{align}
Here
 $ \left\langle {M_{{S}}} \right\rangle (t) \,:\!=\, \left\langle {M_{{S}}, M_{{S}}} \right\rangle (t)$
etc., by convention. See Appendix C for definitions of quadratic variation processes. Define
 $ \left\langle {M^\epsilon} \right\rangle $
similarly. We shall study the large graph limits of
 $ \left\langle {M} \right\rangle (t)$
and
 $ \left\langle {M^\epsilon} \right\rangle (t)$
as
 $n \rightarrow \infty$
for each
 $t \in \mathcal{T}_{0}$
. For this purpose, we need the neighbourhood distribution of a susceptible vertex i of degree k, i.e., the distribution of
 $(X_{{SI},i}, X_{{SS},i})$
for a vertex
 $i \in S_k$
, for all
 $k \in \mathbb{N}$
.
We quote an important remark from [Reference Jacobsen, Burch, Tien and Rempała30] that will come in handy for the derivations.
Remark 1. Note that the total number of edges in the graph is
 $2^{-1} \sum_i d_i$
. With
 $0< \alpha_{{S}}<1$
, it immediately follows that
 $n^{-1} X_{{SI}} \leq n^{-1} X_{{S} \bullet} \leq \partial \psi(1)$
and
 $n^{-1} X_{{SS}} \leq n^{-1} X_{{S} \bullet} \leq \partial \psi(1)$
for sufficiently large
 $n \in \mathbb{N}$
. Also note that
 $0\le \theta\le 1$
and
 $\partial\psi(\theta) \le \partial\psi(1)$
, so that
 $\alpha_{{S}} \theta \partial \psi(\theta) \leq \partial \psi(1)$
. By virtue of A1,
 $n^{-1} X_{{S} \bullet}$
is bounded away from 0 on
 $\mathcal{T}_{0}$
, and hence so is
 $\theta$
(see [Reference Jacobsen, Burch, Tien and Rempała30, Section 3.1]). As a consequence of [Reference Jacobsen, Burch, Tien and Rempała30, Lemma 1(b)], we can take the same lower bound for
 $\alpha_{{S}} \theta \partial \psi(\theta)$
. Let us denote by
 $\xi>0$
the uniform lower bound for
 $n^{-1} X_{{S} \bullet}$
and
 $ \alpha_{{S}} \theta \partial \psi(\theta)$
, so that we can write
 $ n^{-1} X_{{S} \bullet} \in [ \xi, \partial \psi(1) ] \subset \mathbb{R}_{+} $
. Note that all these bounds hold with probability 1.
4.1. Deterministic limit of
$ \left\langle {\textbf{M}} \right\rangle \textbf{(t)}$

Recall that
 $(x, \vartheta) \,:\!=\, ( (x_{{S}}, x_{{SI}}, x_{{SS}}), \vartheta )$
. Let us begin by defining the following operators acting on the function
 $(x, \vartheta) $
:
 \begin{align} v_{{S}} & \,:\!=\, \beta x_{{SI}} , \nonumber\\ v_{{SI}} & \,:\!=\, \beta \!\left( \frac{x_{{SI}} (x_{{SS}}-x_{{SI}} )^2}{x_{{S}}^2} \mathbb{D}^{3} {\psi(\vartheta )} - \frac{x_{{SI}} (x_{{SS}}-3x_{{SI}} )}{x_{{S}}} \mathbb{D}^{2} {\psi(\vartheta)} + x_{{SI}} \right) , \nonumber \\ v_{{SS}} & \,:\!=\, 4 \beta \frac{x_{{SI}} x_{{SS}}}{x_{{S}}} \!\left( \frac{x_{{SS}}}{x_{{S}}} \mathbb{D}^{3} {\psi(\vartheta )} + \mathbb{D}^{2} {\psi(\vartheta)} \right) , \nonumber\\ v_{{S} , {SI}} & \,:\!=\, - \beta \!\left(\frac{x_{{SI}} ( x_{{SS}} - x_{{SI}})}{x_{{S}}} \mathbb{D}^{2} {\psi(\vartheta )}- x_{{SI}} \right) , \\ v_{{S} , {SS}} & \,:\!=\, 2\beta \frac{x_{{SI}} x_{{SS}}}{x_{{S}}} \mathbb{D}^{2}{\psi(\vartheta )} , \nonumber\\ v_{{SI}, {SS}} & \,:\!=\, -2 \beta \frac{x_{{SI}}x_{{SS}} (x_{{SS}}- x_{{SI}})}{x_{{S}}^2} \mathbb{D}^{3} {\psi(\vartheta )} . \nonumber \end{align}
The intuition behind the operators in Equation (4.4) will be clear when we compute the predictable quadratic variation
 $ \left\langle {M} \right\rangle $
of the martingale process M and seek its limit as
 $n \rightarrow \infty$
. In particular, we shall see that each of the terms on the right-hand side of Equation (4.4) is a function of various multinomial moments, which we find as limits of the corresponding hypergeometric ones in order to approximate the expected jump sizes conditional on the process history.
Now, define a
 $\mathcal{T}$
-indexed family of matrices
 $\{V(t) \}$
as follows
 \begin{align} V(t) \,:\!=\, & \begin{pmatrix} V_{{S}}(t) & \quad V_{{S} , {SI}} (t) & \quad V_{{S} ,{SS}}(t) \\[4pt] V_{{SI} ,{S}}(t) & \quad V_{{SI}}(t) & \quad V_{{SI} , {SS}} (t) \\[4pt] V_{{SS}, {S}}(t) & \quad V_{{SS} , {SI}}(t) & \quad V_{{SS}}(t) \\ \end{pmatrix} , \end{align}
where, given
 $ v_{id_1,id_2}( x,\vartheta )\ \text{for}\ id_1,id_2 \in \{{S}, {SI}, {SS} \} $
in Equation (4.4),
 \begin{align} V_{id_1, id_2} (t) \,:\!=\, {}& \int_{0}^{t} v_{id_1,id_2}( x(s),\vartheta(s) ) \, {d} {s} , \end{align}
with the convention
 $ v_{id_1,id_2} \,:\!=\, v_{id_2,id_1}\ \text{for}\ id_1,id_2 \in \{{S}, {SI}, {SS} \} $
and
 $ v_{id_1,id_2} \,:\!=\, v_{id_1} $
whenever
 $ id_1= id_2 \in \{{S}, {SI}, {SS} \} $
. Note that this also sets the convention
 $ V_{id_1,id_2}(t ) \,:\!=\, V_{id_2,id_1}( t)\ \text{for}\ id_1,id_2 \in \{{S}, {SI}, {SS} \} $
and
 $ V_{id_1,id_2}( t ) \,:\!=\, V_{id_1}( t ) $
whenever
 $ id_1= id_2 \in \{{S}, {SI}, {SS} \} $
for each
 $t \in \mathcal{T}$
.
Let us now present our first result providing the deterministic limit of
 $ \left\langle {M} \right\rangle $
in the following lemma. Recall that proving a deterministic limit of
 $ \left\langle {M} \right\rangle $
will satisfy one of the conditions of the Rebolledo theorem. The key strategy in establishing the result will be to approximate various hypergeometric moments by the corresponding multinomial ones.
Lemma 2. Consider the stochastic SI model described in Section 2.2. Assume A1, A2, and A3 for a CM graph
 $\mathcal{G}(\psi, n)$
. Then
 \begin{align} \left\langle {M} \right\rangle (t) {\xrightarrow[]{ {P}}}& V(t) , \nonumber \end{align}
for each
 $t \in \mathcal{T}$
, as
 $ n \rightarrow \infty$
, where V(t) is as defined in Equation (4.5), and
 $ (x, \vartheta) $
is the solution of Equation (3.8) with
 $x (0) = \alpha $
and
 $\vartheta (0)=1$
.
Proof of Lemma
2. To show convergence of the matrix random process
 $ \left\langle {M} \right\rangle (t) $
to V(t), we show componentwise convergence of the respective components. The general strategy for proving convergence for these components remains the same. To conserve space, we only demonstrate here the strategy for establishing
 $M_{{SI}}(t) \xrightarrow[]{ {P}} V_{{SI}}(t) $
. The remaining assertions follow similarly.
Computation of
 $ \left\langle {\textbf{M}_{\textbf{SI}}} \right\rangle $
. The process
 $M_{{SI}}$
jumps only if a susceptible vertex gets infected. Therefore, the predictable quadratic variation is computed as follows:
 \begin{align*} \left\langle {M_{{SI}}} \right\rangle (t) = \left\langle {n^{-1/2} M^{\prime}_{{SI}}} \right\rangle (t) = & \int_{0}^{t} \sum_k \frac{1}{n} \sum_{i \in S_k} \beta X_{{SI},i} \big(X_{{SS},i}- X_{{SI},i} \big)^2 \, {d} {s} .\end{align*}
Now, for a randomly selected
 $i \in S_k$
, we seek the (conditional) moments
 $\mathbb{E}\!\left[{X_{{SI},i} \big(X_{{SS},i}- X_{{SI},i} \big)^2 \big| \mathcal{F}_{t-}}\right]$
. Define the function
 $C_{h}^k \,:\,\mathcal{T}_{0} \rightarrow \mathbb{R} $
as
 \begin{align*} C_{h}^k(t) \,:\!=\, & \mathbb{E}\big[{X_{{SI},i}(t) (X_{{SS},i}(t) - X_{{SI},i}(t) )^2 \big| \mathcal{F}_{t-}}\big] . \end{align*}
Following the computations in Appendix A, we get
 \begin{align*} C_{h}^k(t) = & \frac{ ( k)_{3} X_{{SI}}}{( {X_{{S} \bullet}})_{3}} \left[ ( {X_{{SS}}})_{2} - 2 (X_{{SI}}-1 )X_{{SS}} + ( {X_{{SI}}-1})_{2} \right] \\[5pt] & - \frac{ ( k)_{2} X_{{SI}}}{( {X_{{S} \bullet}})_{2}} [ X_{{SS}} - 3(X_{{SI}}-1) ] + k \frac{X_{{SI}}}{X_{{S} \bullet}} . \end{align*}
To be precise, the processes on the right-hand side of the above equation are evaluated at
 $t-$
. To approximate the hypergeometric moments by corresponding multinomial ones, define the multinomial compensator
 $C_{m}^k \,:\, \mathcal{T}_{0} \times [\xi, \partial \psi(1)] \rightarrow \mathbb{R} $
as
 \begin{align*}C_{m}^k (t,z) & \,:\!=\, \frac{ ( k)_{3} n^{-3} X_{{SI}}}{z^{3}} \big( {X_{{SS}}}^{2} - 2 X_{{SI}}X_{{SS}} + X_{{SI}}^2 \big) \\& \quad - \frac{ ( k)_{2} n^{-2} X_{{SI}}}{z^{2}} ( X_{{SS}} - 3X_{{SI}} )+ \frac{k n^{-1} X_{{SI}}}{z} \\& = \frac{ ( k)_{3} n^{-3} X_{{SI}} ( X_{{SS}}- X_{{SI}} ) ^2}{z^{3}} - \frac{ ( k)_{2} n^{-2} X_{{SI}} ( X_{{SS}} - 3X_{{SI}} )}{z^{2}} + \frac{k n^{-1} X_{{SI}}}{z} .\end{align*}
Again, to be precise, the processes on the right-hand side of the above equation are evaluated at
 $t-$
. Observe that there exists an
 $L >0$
such that
 \begin{align}C_{m}^k (t,z(t) ) \leq L k^3 ,\end{align}
uniformly in n. This holds because
 $n^{-1}X_{{SI}}$
and
 $n^{-1}X_{{SS}}$
are uniformly bounded above by virtue of Remark 1 and z is bounded away from zero, by definition. The function
 $C_{m}^k (t,z(t) ) $
is also Lipschitz continuous in z. Now recall the definition of
 $v_{{SI}}$
from Equation (4.4) and define
 \begin{align*} \Delta(t) & \,:\!=\, \sum_k \frac{1}{n} \sum_{i \in S_k} \beta X_{{SI},i}(t) \big(X_{{SS},i}(t) - X_{{SI},i} (t) \big)^2 - v_{{SI}}(x(t), \vartheta(t) ) \\ & = \sum_k \frac{1}{n} \sum_{i \in S_k} \beta X_{{SI},i}(t) \big(X_{{SS},i}(t)- X_{{SI},i}(t) \big)^2 -v_{{SI}}\big( n^{-1}X(t), \theta(t) \big) \\ & \quad +v_{{SI}}( n^{-1}X(t) , \theta (t) ) - v_{{SI}}(x(t), \vartheta(t) ) \\ & = \Delta_{1}(t) + \Delta_{2}(t) , \end{align*}
where
 \begin{equation*} \Delta_{1}(t) \,:\!=\, \sum_k \frac{1}{n} \sum_{i \in S_k} \beta X_{{SI},i}(t) (X_{{SS},i}(t) - X_{{SI},i}(t) )^2 -v_{{SI}}\big( n^{-1}X(t), \theta(t) \big),\end{equation*}
and
 $ \Delta_{2}(t) \,:\!=\, v_{{SI}}( n^{-1}X(t) , \theta(t) ) - v_{{SI}}(x(t), \vartheta(t) ) $
. To show
 $ \left\langle {M_{{SI}}} \right\rangle \xrightarrow[]{ {P}} V_{{SI}} $
, it suffices to show
 $ \sup_{t \in \mathcal{T}} | \Delta(t) | \xrightarrow[]{ {P}} 0$
. We achieve this by separately showing
 $ \sup_{t \in \mathcal{T}} | \Delta_{1}(t) | \xrightarrow[]{ {P}} 0 $
and
 $\sup_{t \in \mathcal{T}} | \Delta_{2}(t) | \xrightarrow[]{ {P}} 0$
.
Convergence of
 $\Delta_{1}(t)$
. Observe that
 \begin{align*} \Delta_{1}(t) = & \sum_k \frac{1}{n} \sum_{i \in S_k} \beta X_{{SI},i} \big(X_{{SS},i}- X_{{SI},i} \big)^2 - \beta \!\left[ \frac{n^{-3} X_{{SI}} (X_{{SS}}-X_{{SI}} )^2}{\alpha_{{S}}^2} \frac{\partial^3 \psi(\theta )}{( \partial \psi(\theta ))^3} \right. \\ & {} \left. - \frac{n^{-2} X_{{SI}} (X_{{SS}}-3X_{{SI}} )}{\alpha_{{S}}} \frac{\partial^2 \psi(\theta )}{( \partial \psi(\theta ))^2} + n^{-1} X_{{SI}} \right] \\ = & \sum_k \!\left[ \frac{1}{n} \sum_{i \in S_k} \beta X_{{SI},i} \big(X_{{SS},i}- X_{{SI},i} \big)^2 - \beta \!\left\{\frac{n^{-3} X_{{SI}} (X_{{SS}}-X_{{SI}} )^2}{\alpha_{{S}}^2} \frac{ ( k)_{3} \theta^k p_k}{(\theta \partial \psi(\theta) )^3} \right. \right. \\ & \left. \left. {} - \frac{n^{-2} X_{{SI}} (X_{{SS}}-3X_{{SI}} )}{\alpha_{{S}}} \frac{ ( k)_{2} \theta^k p_k}{(\theta \partial \psi(\theta) )^2} + n^{-1} X_{{SI}} \frac{k \theta p_k}{\theta \partial \psi(\theta)} \right\} \right] \\ = & \sum_k \!\left[ \frac{1}{n} \sum_{i \in S_k} \beta X_{{SI},i} \big(X_{{SS},i}- X_{{SI},i} \big)^2 - \beta \alpha_{{S}} p_k \theta^k C_{m}^k (t, \alpha_{{S}} \theta \partial \psi(\theta) ) \right] . \end{align*}
The second equality follows from expressing the derivatives of the probability generating functions as sums over all possible degrees k and then collecting terms involving degree k. Define
 \begin{equation*} \Delta_{1}^{(k)}(t) \,:\!=\, \frac{1}{n} \sum_{i \in S_k} \beta X_{{SI},i} \big(X_{{SS},i}- X_{{SI},i} \big)^2 - \beta \alpha_{{S}} p_k \theta^k C_{m}^k (t, \alpha_{{S}} \theta \partial \psi(\theta) ).\end{equation*}
Our task boils down to showing that
 $ \sup_{t \in \mathcal{T}} \!\left| \sum_k \Delta_{1}^{(k)}(t) \right| \xrightarrow[]{ {P}} 0 $
as
 $n \rightarrow \infty$
. We achieve this in two steps. First we show that the tails of
 $\sum_k \Delta_{1}^{(k)}(t) $
are negligible. Second, we show that each term
 $ \Delta_{1}^{(k)}(t)$
converges to zero uniformly in probability for a fixed
 $k \in \mathbb{N}$
.
Step I: Tails are negligible. Let us begin by showing that as
 $N \rightarrow \infty$
,
 \begin{align*} \sup_{n \in \mathbb{N}} \sup_{t \in \mathcal{T}} \!\left| \sum_{k > N} \Delta_{1}^{(k)}(t) \right| \xrightarrow[]{ {P}} 0 . \end{align*}
Observe that, for sufficiently large n,
 \begin{align} \left| \frac{1}{n} \sum_{k > N} \sum_{i \in S_k} \beta X_{{SI},i} \big(X_{{SS},i}- X_{{SI},i} \big)^2 \right| \leq {} \frac{\beta}{n} \sum_{k > N} k^3 X_{S_k} \leq {} 2 \beta \sum_{k > N} k^3 p_k , \end{align}
because
 $ n^{-1} X_{S_k} \leq 2p_k $
for sufficiently large n in light of Remark 1. Following Remark 1 and the bound on
 $C_m^k$
from Equation (4.7), we get
 \begin{align} \left| \sum_{k > N} \beta \alpha_{{S}} p_k \theta^k C_{m}^k (t, \alpha_{{S}} \theta \partial \psi(\theta) ) \right| \leq {}& \beta L \sum_{k> N} k^3 p_k . \end{align}
Therefore, we get
 $ \sup_{n \in \mathbb{N}} \sup_{t \in \mathcal{T}} \Big| \sum_{k > N} \Delta_{1}^{(k)}(t) \Big| \xrightarrow[]{ {P}} 0 $
by combining the inequalities (4.8) and (4.9), in view of A3.
Step II: Uniform convergence in probability for a fixed k. In addition to Step I, it is sufficient to show
 $\sup_{t \in \mathcal{T}} | \Delta_{1}^{(k)}(t) | \xrightarrow[]{ {P}} 0 $
for an arbitrarily fixed
 $k \in \mathbb{N}$
to justify
 $ \sup_{t \in \mathcal{T}} | \Delta_{1}^{}(t) | \xrightarrow[]{ {P}} 0 $
. Observe that
 \begin{align} | \Delta_{1}^{(k)}(t) | = & \Bigg| \frac{1}{n} \sum_{i \in S_k} \beta X_{{SI},i} \big(X_{{SS},i}- X_{{SI},i} \big)^2 - \beta \alpha_{{S}} p_k \theta^k C_{m}^k (t, \alpha_{{S}} \theta \partial \psi(\theta) ) \Bigg| \nonumber \\ \leq\, & \beta n^{-1} \Bigg| \sum_{i \in S_k} X_{{SI},i} \big(X_{{SS},i}- X_{{SI},i} \big)^2 - X_{S_k} C_h^k(t) \Bigg| \end{align}
 \begin{align} & + \beta n^{-1} X_{S_k} \big| C_h^k(t) - C_{m}^k \big(t, n^{-1} X_{{S} \bullet} \big) \big| \end{align}
 \begin{align} & + \beta \big| n^{-1} X_{S_k} C_{m}^k \big(t, n^{-1} X_{{S} \bullet} \big) - \alpha_{{S}} p_k \theta^k C_{m}^k \big(t, n^{-1} X_{{S} \bullet} \big) \big| \end{align}
 \begin{align} & + \beta \alpha_{{S}} p_k \theta^k \big| C_{m}^k \big(t, n^{-1} X_{{S} \bullet} \big) - C_{m}^k (t, \alpha_{{S}} \theta \partial \psi(\theta) ) \big| .\end{align}
We show that each of the above summands converges uniformly in probability to zero.
Define the process
 $ \Delta_{1,1}^{(k)}(t) \,:\!=\, \sum_{i \in S_k} X_{{SI},i} \big(X_{{SS},i}- X_{{SI},i} \big)^2 - X_{S_k} C_h^k(t) $
. Observe that
 $ \Delta_{1,1}^{(k)}(t)$
is a zero-mean, piecewise constant, càdlàg martingale with paths in D. The jumps of
 $ \Delta_{1,1}^{(k)}(t) $
take place when a vertex of degree k gets infected. The quadratic variation of
 $ \Delta_{1,1}^{(k)}(t) $
is therefore the sum of its squared jumps,
 \begin{align*} \Big[ {\Delta_{1,1}^{(k)}} \Big] (t) = & \sum_{s \leq t}\! \Big(\delta \Delta_{1,1}^{(k)}(s) \Big)^2 \leq k^6 n , \end{align*}
because the number of jumps cannot exceed n. Therefore, by Doob’s martingale inequality we get
 $\sup_{t \in \mathcal{T}} \big| n^{-1} \Delta_{1,1}^{(k)}(t) \big| \xrightarrow[]{ {P}} 0 $
, since
 \begin{equation*}\mathbb{E}\!\left[{ \left[ {\Delta_{1,1}^{(k)}} \right] (t)}\right] = \mathbb{E}\!\left[{\Big(\Delta_{1,1}^{(k)}(t) \Big)^2}\right] = \mathop{}\!O{\left({n}\right)}.\end{equation*}
That is, the quantity in (4.10) converges uniformly in probability to zero.
For the term in (4.11), take into account
 $ n^{-1}X_{S_k} \leq 1 $
and observe that
 \begin{align*} \sup_{t \in \mathcal{T}} \big| C_h^k(t) - C_{m}^k \big(t, n^{-1} X_{{S} \bullet} \big) \big| \leq {}& \frac{c_1 k^3}{X_{S \bullet}(T) -2} ,\end{align*}
for some
 $c_1>0$
, because
 $ X_{{S} \bullet} $
is non-increasing on
 $\mathcal{T}_{0} $
. Therefore, by A1, the quantity in (4.11) converges to zero uniformly in probability.
Now observe that
 \begin{align*} \sup_{t \in \mathcal{T}} \big| n^{-1} X_{S_k} C_{m}^k \big(t, n^{-1} X_{{S} \bullet} \big) - \alpha_{{S}} p_k \theta^k C_{m}^k \big(t, n^{-1} X_{{S} \bullet} \big) \big| \\ \leq L k^3 \sup_{t \in \mathcal{T}} \big| n^{-1} X_{S_k} -\alpha_{{S}} p_k \theta^k \big| & \xrightarrow[]{ {P}} 0 , \end{align*}
by virtue of the bound on
 $C_m^k$
in Equation (4.7) and [Reference Jacobsen, Burch, Tien and Rempała30, Lemma 1(a)]. Therefore, the term in (4.12) also converges to zero uniformly in probability.
Finally, by virtue of the Lipschitz continuity of
 $C_m^k(t,z)$
in z, we get
 \begin{align*} \sup_{t \in \mathcal{T}} \big| C_{m}^k \big(t, n^{-1} X_{{S} \bullet} \big) - C_{m}^k (t, \alpha_{{S}} \theta \partial \psi(\theta) ) \big| \leq\ & c_2 \sup_{t \in \mathcal{T}} \big| n^{-1} X_{{S} \bullet} - \alpha_{{S}} \theta \partial \psi(\theta) \big| , \end{align*}
for some
 $c_2 >0$
. Because
 $ \sup_{t \in \mathcal{T}} \big| n^{-1} X_{{S} \bullet} - \alpha_{{S}} \theta \partial \psi(\theta) \big| \xrightarrow[]{ {P}} 0 $
as shown in [Reference Jacobsen, Burch, Tien and Rempała30], we conclude that the term in (4.13) converges to zero uniformly in probability.
Having shown that the terms in (4.10), (4.11), (4.12), and (4.13) converge to zero uniformly in probability, we establish that
 $\sup_{t \in \mathcal{T}} \big| \Delta_{1}^{(k)}(t) \big| \xrightarrow[]{ {P}} 0 $
uniformly in probability for any fixed
 $k \in \mathbb{N}$
. Finally, by virtue of Step I and Step II, we obtain
 $ \sup_{t \in \mathcal{T}} | \Delta_{1}(t) | \xrightarrow[]{ {P}} 0 $
.
Convergence of
 $ \Delta_{2}(t)$
. Note that
 $ v_{{SI}}( n^{-1}X, \theta ) $
is Lipschitz continuous on its domain, which we can take as
 $ (0,1] \times [\xi, \partial \psi(1)]^2 \times [\xi,1] $
, by Remark 1. Therefore,
 \begin{align*} \sup_{t \in \mathcal{T}} \big| v_{{SI}}( n^{-1}X , \theta ) - v_{{SI}}(x, \vartheta ) \big| \leq {} c_3 \sup_{t \in \mathcal{T}} \big\lVert{(n^{-1}X, \theta )- (x, \vartheta )}\big\rVert , \end{align*}
for some Lipschitz constant
 $c_3>0$
. Since
 $ (x, \vartheta) $
is the solution of Equation (3.8) with initial condition
 $x (0) = \alpha $
and
 $\vartheta (0)=1$
, by virtue of Theorem 1 we obtain
 $ \sup_{t \in \mathcal{T}} | \Delta_{2}(t) | \xrightarrow[]{ {P}} 0$
.
Final conclusion. Since
 $ \sup_{t \in \mathcal{T}} | \Delta_{1}(t) | \xrightarrow[]{ {P}} 0$
and
 $ \sup_{t \in \mathcal{T}} | \Delta_{2}(t) | \xrightarrow[]{ {P}} 0$
, we conclude
 $ \sup_{t \in \mathcal{T}} | \Delta(t) | \xrightarrow[]{ {P}} 0$
, which is a sufficient condition for
 \begin{align*} \left\langle {M_{{SI}}} \right\rangle (t) \xrightarrow[]{ {P}} V_{{SI}}(t)= {}& \int_{0}^{t} v_{{SI}}(x(s), \vartheta(s) ) \, {d} {s} .\end{align*}
We remark that the various moment estimates used in the proof above (and elsewhere in the paper) ignore the contributions of self-loops and parallel edges. Their contributions are asymptotically negligible as discussed earlier in Section 2.2. Also, note that we may need to add a parity edge to the last vertex if the sum of the drawn degrees is not even. This is relevant for the calculations in Steps I and II. However, as discussed earlier in Section 2.2, the contribution due to this minor adjustment is negligible and hence is not shown explicitly.
4.2. Asymptotic rarefaction of jumps
Recall that
 $M^\epsilon \,:\!=\, \big( M_{{S}}^\epsilon, M_{{SI}}^\epsilon, M_{{SS}}^\epsilon\big)$
is the vector of square-integrable martingales containing all jumps of components of M larger than
 $\epsilon$
in absolute value, for
 $\epsilon>0$
; i.e.,
 $ M_{id}(t) - M_{id}^\epsilon(t) $
is a locally square-integrable martingale and
 $| \delta M_{id}(t) - \delta M_{id}^\epsilon(t) | \leq \epsilon $
for all
 ${id} \in \{{S}, {SI}, {SS} \}$
and
 $ t \in \mathcal{T} $
. We wish to show
 $ \left\langle {M_{id}^\epsilon} \right\rangle (t) \xrightarrow[]{ {P}} 0$
for all
 ${id} \in \{{S}, {SI}, {SS} \}$
and
 $t \in \mathcal{T} $
, as
 $n \rightarrow \infty$
. We would like to point out that this condition is essentially the strong asymptotic rarefaction of jumps condition of the second type (strong ARJ(2)) as described in [Reference Rebolledo44, Reference Andersen, Borgan, Gill and Keiding1]. Intuitively this ensures that the sample paths of the martingale M(t) are close to continuous in the limit. Before proceeding further, we offer the following remark.
Lemma 3. For the CM graph
 $\mathcal{G}(\psi, n)$
along with A3, the following holds true:
 \begin{align}n^{- \frac{1}{2}}\ d_{{max}} \xrightarrow[]{ {a.s.}} 0 ,\end{align}
where
 $d_{{max}}$
is the maximum degree observed in a realization of
 $\mathcal{G}(\psi, n)$
.
Proof of Lemma 3. The result follows by a direct application of the result in [Reference Barndorff-Nielsen8, Theorem 5.2] along with A3.
Let us now compute the predictable quadratic variation of
 $M^\epsilon$
and establish its asymptotic limit.
Lemma 4. Consider the stochastic SI model described in Section 2.2. Assume A1, A2, and A3 for a CM graph
 $\mathcal{G}(\psi, n)$
. Consider the vector
 $M^\epsilon$
of square-integrable martingales containing all jumps of components of M(t) larger than
 $ \epsilon $
in absolute value for
 $\epsilon>0$
, as defined in Equation (4.2). Then, as
 $ n \rightarrow \infty$
, for all
 ${id} \in \{{S}, {SI}, {SS} \}$
, for each
 $t \in \mathcal{T}$
,
 \begin{align} \left\langle {M^\epsilon_{id}} \right\rangle (t) \xrightarrow[]{ {P}} {}& 0 . \end{align}
Proof of Lemma 4. We proceed in the following two steps.
Computation of
 $ \left\langle {M_{{S}}^\epsilon} \right\rangle $
. Note that the original process
 $M^{\prime}_{{S}}$
makes only unit jumps. Then, for arbitrary
 $\epsilon >0 $
,
 \begin{align*} \left\langle {M_{{S}}^\epsilon} \right\rangle (t) \leq {}& \int_{0}^{t} \mathbb{E}\!\left[{\big(\delta M_{{S}}^\epsilon(s) \big)^2 \mathsf{1}\big({| \delta M^{\prime}_{{S}}(s) | > n^{1/2} \epsilon}\big) \big| \mathcal{F}_{s-}}\right] \, {d} {s} ={} 0 \quad \forall \, n > \frac{1}{\epsilon^2} \\ \implies {} \left\langle {M_{{S}}^\epsilon} \right\rangle (t) \xrightarrow[]{ {P}} & 0 \quad \text{for all}\ 0 < t \leq T\ \text{and for all}\ \epsilon> 0\ \text{as}\ n \rightarrow \infty .\end{align*}
Computation of
 $ \left\langle {M_{{SI}}^\epsilon} \right\rangle$
and
 $ \left\langle {M_{{SS}}^\epsilon} \right\rangle $
. Note that both
 $M^{\prime}_{{SI}}$
and
 $M^{\prime}_{{SS}}$
jump only if infection of a vertex occurs. This in particular implies that the jump sizes of
 $M^{\prime}_{{SI}}$
and
 $M^{\prime}_{{SS}}$
are bounded above by the degree of the vertex getting infected. Therefore, they are also bounded above by the maximum degree
 $d_{{max}}$
. For an arbitrary
 $\epsilon >0$
, and for
 ${id} \in \{{SI}, {SS} \}$
,
 \begin{align*} \left\langle {M_{id}^\epsilon} \right\rangle (t) & \leq \int_{0}^{t} \mathbb{E}\!\left[{(\delta M_{id}^\epsilon(s) )^2 \mathsf{1}\!\left({| n^{-1/2} d_{{max}} | > \epsilon}\right) \mid \mathcal{F}_{s-}}\right] \, {d} {s} \\ & \leq t n^{-1} d^2_{{max}} \mathsf{1}\!\left({| n^{-1/2} d_{{max}} | > \epsilon}\right) .\end{align*}
By Lemma 3, along with the continuous mapping theorem and the fact that almost sure convergence implies convergence in probability, we can claim that the right-hand side of the above inequality
 $t n^{-1} d^2_{{max}} \mathsf{1}\!\left({| n^{-1/2} d_{{max}} | > \epsilon}\right) \xrightarrow[]{ {P}} 0 $
for each
 $0 < t \leq T$
and
 $\epsilon >0$
. Therefore, for all
 $h >0$
,
 \begin{equation*}\mathbb{P}\!\left({ \left\langle {M_{id}^\epsilon} \right\rangle (t) > h} \right)\leq \mathbb{P}\!\left({t n^{-1} d^2_{{max}} \mathsf{1}\!\left({| n^{-1/2} d_{{max}} | > \epsilon}\right) > h}\right) \rightarrow 0 \end{equation*}
as
 $n \rightarrow \infty$
, establishing
 $ \left\langle {M_{id}^\epsilon} \right\rangle (t) \xrightarrow[]{ {P}} 0$
as
 $n \rightarrow \infty$
for all
 $0 < t \leq T$
and
 $\epsilon >0$
. This completes the proof.
4.3. Statement and proof of the FCLT
Having shown the convergence of all relevant quadratic variation processes, we are now ready to present the FCLT. First we state that the function V found in Lemma 2 is a positive semidefinite matrix-valued function on
 $\mathcal{T}$
, with positive semidefinite increments. Set
 $V(0) \,:\!=\, \boldsymbol{0}$
, the
 $3 \times 3$
null matrix, so that we can treat V(t) as a positive semidefinite matrix-valued function on the entirety of
 $\mathcal{T}_{0}$
. Let us denote by
 $\mathcal{V}$
the collection of all such positive semidefinite
 $3 \times 3$
matrix-valued functions on
 $\mathcal{T}_{0}$
that have positive semidefinite increments and that are
 $\boldsymbol{0}$
at time zero. Given such a matrix-valued function
 $V \in \mathcal{V} $
, let G be a continuous Gaussian vector martingale such that
 $ \left\langle {G} \right\rangle = \left[ {G} \right] =V$
. Such a process always exists [Reference Andersen, Borgan, Gill and Keiding1, Chapter II, p. 83]. In particular,
 $G(t)- G(s) \sim N( \boldsymbol{0}, V(t)- V(s) ) $
, the multivariate normal distribution for
 $ 0 \leq s \leq t$
.
Theorem 2. (Functional central limit theorem.) Consider the stochastic SI model described in Section 2.2. Assume A1, A2, and A3 for a CM graph
 $\mathcal{G}(\psi, n)$
. Consider, for
 $t \in \mathcal{T}_{0}$
, the fluctuation process
 \begin{align} Y(t) \,:\!=\, \sqrt{n} \big( n^{- 1} X(t) - x(t) \big) . \end{align}
Assume
 $\lim_{n \rightarrow \infty} Y(0) = U(0) $
, for some non-random U
 $(0) $
. Then there exists a matrix-valued function
 $V \in \mathcal{V} $
on
 $\mathcal{T}_{0}$
such that
 \begin{align} Y \overset{\mathcal{D}}{\implies} U \ {in}\ D^{(3)} {as}\ n \rightarrow \infty , \end{align}
where U is a continuous Gaussian vector semimartingale satisfying
 \begin{align} U(t) = U(0) + G(t) + \int_{0}^{t} \nabla \mathbb{H}_{{x}} \!\left( {x(s), \vartheta(s)} \right) U(s) \, {d} {s} , \end{align}
where
 $\nabla \mathbb{H}_{{x}} \!\left( {x, \vartheta} \right) \,:\!=\, (( \partial_j \mathbb{H}_{{i}} ( {x, \vartheta} ) ))$
for
 $i,j \in \{{S}, {SI}, {SS} \}$
and G is a continuous Gaussian vector martingale such that
 $ \left\langle {G} \right\rangle = \left[ {G} \right] =V$
, provided V remains finite on the entirety of
 $\mathcal{T}_{0}$
and
 $\nabla \mathbb{H}_{{x}} \!\left( {x(s), \vartheta(s)} \right) $
is continuous.
Proof of Theorem 2. We first prove an FCLT for the martingale process M defined in Equation (4.1). We wish to apply Rebolledo’s FCLT for local martingales on M. A version of the Rebolledo theorem adequate for our purpose is provided in Appendix C. Note that, in light of the Doob–Meyer decomposition given in Equation (2.2), M is indeed a pure-jump, zero-mean, locally square-integrable, càdlàg martingale. After having established an FCLT for the martingale process M, we prove convergence of the fluctuation process Y. It suffices to carry out the following three steps.
Step I: Deterministic limit of
 $ \left\langle {M} \right\rangle $
. Let
 $ (x, \vartheta) $
be the solution of Equation (3.8) with initial condition
 $x (0) = \alpha $
and
 $\vartheta (0)=1$
, as given in Theorem 1. Then, by virtue of Lemma 2, we conclude, for each
 $t \in \mathcal{T}$
,
 $ \left\langle {M} \right\rangle (t) \xrightarrow[]{ {P}} V(t)$
, where the matrix-valued function V is defined in Equation (4.5), and we set
 $V(0) \,:\!=\, \boldsymbol{0}$
, the
 $3 \times 3$
null matrix.
Step II: Asymptotic rarefaction of jumps. Let
 $\epsilon>0$
be arbitrary. Consider the vector
 $M^\epsilon$
of square-integrable martingales containing all jumps of components of M(t) larger than
 $\epsilon$
in absolute value for
 $\epsilon>0$
, as defined in Equation (4.2). Then, by means of Lemma 4, we conclude
 $ \left\langle {M^\epsilon_{id}} \right\rangle (t) \xrightarrow[]{ {P}} 0 $
, for each
 $t \in \mathcal{T}$
and
 $id \in \{{S}, {SI}, {SS}\}$
.
Now let G be the continuous Gaussian vector martingale such that
 $ \left\langle {G} \right\rangle = \left[ {G} \right] =V$
. In light of Rebolledo’s theorem for locally square-integrable martingales (see Appendix C and also [Reference Andersen, Borgan, Gill and Keiding1, Chapter II, p. 83]), Step I and Step II are sufficient to establish
 \begin{align} ( M(t_1),M(t_2),\ldots, M(t_l)) \overset{\mathcal{D}}{\implies} ( G(t_1),G(t_2),\ldots, G(t_l)) \quad \text{as} n \rightarrow \infty \nonumber \end{align}
for all
 $ t_1,t_2, \ldots, t_l \in \mathcal{T}$
. Furthermore, since
 $\mathcal{T}$
is dense in
 $\mathcal{T}_{0}$
, we conclude
 $M \overset{\mathcal{D}}{\implies} G $
in
 $D^{(3)}$
as
 $n \rightarrow \infty$
, and
 $ \left\langle {M} \right\rangle $
and
 $ \left[ {M} \right] $
converge uniformly on compact subsets of
 $\mathcal{T}_{0}$
, in probability, to V.
Step III: Convergence of the fluctuation process. In keeping with the Doob–Meyer decomposition given in Equation (2.2),
 \begin{align} Y(t) = Y(0) + M(t) + \int_0^{t} \sqrt{n} \bigg( \frac{1}{n} \mathbb{F}_{{X}} \!\left({\tilde{X}(s)} \right) - \mathbb{H}_{{x}} \!\left( {x (s) , \vartheta (s)} \right) \bigg) \, {d} {s} , \nonumber\end{align}
we expect the following limit process:
 \begin{align} U(t) = U(0) + G(t) + \int_{0}^{t} \nabla \mathbb{H}_{{x}} \!\left( {x(s), \vartheta(s)} \right) U(s) \, {d} {s} . \end{align}
Indeed, define
 \begin{align*} \Delta (t) \,:\!=\, & \int_{0}^{t} \sqrt{n} \left( \frac{1}{n} \mathbb{F}_{{X}} \!\left({\tilde{X}(s)} \right) - \mathbb{H}_{{x}} \!\left( {x (s) , \vartheta (s)} \right) - \frac{1}{\sqrt{n}} \nabla \mathbb{H}_{{x}} \!\left( {x(s), \vartheta(s)} \right) \, Y(s) \right) \, {d} {s} \\ = & \int_{0}^{t} \sqrt{n} \bigg( \frac{1}{n} \mathbb{F}_{{X}} \!\left({\tilde{X}(s)} \right) - \mathbb{H}_{{x}} \!\left( {\frac{1}{n}X(s) , \theta (s)} \right) + \mathbb{H}_{{x}} \!\left( {\frac{1}{n}X(s) , \theta (s)} \right) \\ &{} - \mathbb{H}_{{x}} \!\left( {x (s) , \vartheta (s)} \right) - \frac{1}{\sqrt{n}} \nabla \mathbb{H}_{{x}} \!\left( {x(s), \vartheta(s)} \right) \, Y(s) \bigg) \, {d} {s} .\end{align*}
Note that the strong law of large numbers in Theorem 1 establishes uniform convergence (in probability) of the operators
 $ n^{-1} \mathbb{F}_{{X}} \!\left({\tilde{X}(s)} \right)$
and
 $\mathbb{H}_{{x}} \!\left( {\frac{1}{n}X(s) , \theta (s)} \right) $
, and the latter operator is Lipschitz continuous on its domain (see [Reference Jacobsen, Burch, Tien and Rempała30]). In light of Theorem 1 and A3, it follows from the Lipschitz continuity of various multinomial compensators
 $C_m^{k}$
introduced in the proof of Lemma 2 that
 \begin{equation*}\lim_{n \rightarrow \infty} \sqrt{n} \!\left( \frac{1}{n} \mathbb{F}_{{X}} \!\left({\tilde{X}(s)} \right) - \mathbb{H}_{{x}} \!\left( {\frac{1}{n}X(s) , \theta (s)} \right) \right) = 0.\end{equation*}
Moreover, we have just shown
 $M \overset{\mathcal{D}}{\implies} G\ \text{in}\ D^{(3)}$
. If V remains finite on the entirety of
 $\mathcal{T}_{0}$
, the matrix-valued function
 $\nabla \mathbb{H}_{{x}} \!\left( {x(s), \vartheta(s)} \right) $
is continuous, and
 $\lim_{n \rightarrow \infty} Y(0) = U(0) $
, for some non-random U(0), then we have
 $\sup_{t \in \mathcal{T}_{0}} | \Delta (t) | \xrightarrow[]{ {P}} 0 $
following Theorem 1, and by an application of the continuous mapping theorem we conclude
 \begin{align} Y \overset{\mathcal{D}}{\implies} U\ \text{in}\ D^{(3)}\ \text{as}\ n \rightarrow \infty , \nonumber \end{align}
where the Gaussian semimartingale U satisfies Equation (4.19) with the Gaussian martingale G being such that
 $ \left\langle {G} \right\rangle = \left[ {G} \right] =V$
. This completes the proof.
5. Applications
Here we consider some applications of our results. As we discuss these applications, we shall also present some numerical and simulation results that are intended not only to provide insights into the dynamics of the process, but also to serve as a verification of our results.
5.1. Percolation
There is a connection between the stochastic SI model and the percolation theory known from statistical physics and developed to study the process of liquid filtering (‘percolating’) through a porous medium. Classical equilibrium mechanics studies its stationary behaviour and is premised upon the axiom that the underlying quantum-mechanical laws are designed so as to maximize the entropy. The stationary distribution of such a stochastic system is given by the Boltzmann ensemble. This classical treatment of the subject, however, does not explain the non-equilibrium behaviour of the dynamical system, i.e., when it is still in a transient phase. Consequently, the non-equilibrium behaviour of percolation has aroused much interest in recent times. Some notable contributions include [Reference Hinrichsen29, Reference Barato and Hinrichsen5]. The standard treatment of percolation, both equilibrium and non-equilibrium, has been extended in another important direction concerning the structure of the porous medium. Traditionally it has been studied on lattices and grids. Of late, however, percolation on random graphs has also been considered ([Reference Baroni, van der Hofstad and Komjáthy9, Reference Callaway, Newman, Strogatz and Watts19, Reference Van der Hofstad46]). Continuing in this direction, we shall treat (non-equilibrium) percolation as a dynamical process on a CM random graph and study its behaviour over a finite time interval.
One of the key quantities of interest in the study of non-equilibrium percolation is the time evolution of the number of wetted sites (also called ‘active’ vertices in the literature). The correspondence between our stochastic SI model as described in Section 2.2 and non-equilibrium percolation is visible if we treat the infected vertices as the ones wetted during the process of percolation. Accordingly, in this context, we give the process X(t) an appropriate new interpretation. The process
 $X_{{S}}(t)$
, for example, captures the number of unwetted sites until time t, and the process
 $X_{{SI}}$
captures the number of channels (bonds) through which the liquid can percolate. In Figure 1, the percolated component up to a given time (the wetted part of the graph) is shown in red. Having made the correspondence precise, we can apply Theorem 2 to approximate these quantities in the large graph limit.
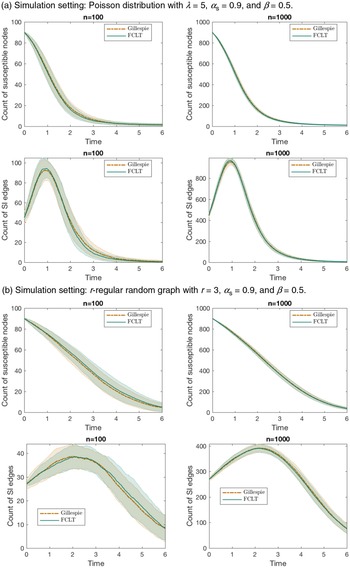
Numerical illustration. In Figure 3, we show some simulation results to check the accuracy of our scaling limit. We compare the expected sample paths of
 $X_{{S}}$
and
 $X_{{SI}}$
provided by Theorems 1 and 2 with estimates obtained using simulations of Gillespie’s algorithm on a CM graph. In particular, we consider a Poisson degree distribution in Figure 3a and a 3-regular random graph in Figure 3b (obtained by the CM construction with degree distribution
 $p_k=\mathsf{1}\!\left({k=3}\right)$
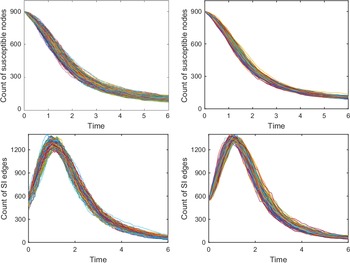
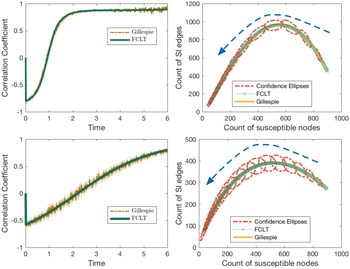
). In Figure 4, we compare the simulated sample paths of the true Gillespie dynamics and those corresponding to the diffusion approximation for a negative binomial degree distribution. Figures 3a, 3b, and 4 show convincing accuracy of the diffusion approximation. In Figure 5, we show the time evolution of the correlation coefficient between the jumps of
 $X_{{S}}$
and
 $X_{{SI}}$
, and also the expected sample path coupled with 95%-confidence ellipses in the space of
 $X_{{S}}$
and
 $X_{{SI}}$
. The orientation of the confidence ellipses is calculated as the angle of the eigenvector corresponding to the largest eigenvalue of the covariance matrix towards the x-axis. To be specific, the orientation is given by
 $\omega \,:\!=\, \arctan{e_2/e_1}$
, where
 $e \,:\!=\, (e_1, e_2)$
is the eigenvector corresponding to the largest eigenvalue of the covariance matrix. The lengths of the major and minor axes are determined using the eigenvalues and by looking up the probability table of the chi-squared distribution (recall that squared normal variates follow a chi-squared distribution). The MATLAB script used to draw the ellipses is based on a script provided by [Reference Spruyt45].
Comparison of our diffusion approximation with simulation results obtained by Gillespie’s algorithm.

Comparison of simulated sample paths. Left: Sample paths obtained through Gillespie’s algorithm. Right: Sample paths obtained through diffusion approximation. Simulation setting:
 $n=1000$
, negative binomial distribution with
 $r=2$
,
 $p=3/4$
.

The figures on the left depict the time evolution of the correlation coefficient between jumps of
 $X_{{S}}$
and
 $X_{{SI}}$
as estimated from numerical simulations (via Gillespie’s algorithm), pitted against theoretical values computed from the FCLT (Theorem 2). The figures on the right show the expected sample path in the space of
 $X_{{S}}$
and
 $X_{{SI}}$
. The two lines correspond to numerical simulation and theoretical values. The dotted ellipses are the 95%-confidence ellipses based on estimates of covariances between
 $X_{{S}}$
and
 $X_{{SI}}$
from the diffusion approximation created using a MATLAB script provided by [Reference Spruyt45]. The arrows indicate the time direction. Above: Poisson distribution with mean 5. Below: r-regular random graph with
 $r=3$
. In both cases,
 $n=1000$
,
 $\alpha_{{S}}=0.9$
, and
 $\beta=0.5$
.

The existence of a giant component and the proportion of vertices on the giant component play an important role in percolation theory, especially from an equilibrium point of view in statistical mechanics. The case of a degree distribution
 $\{p_k \}_{k \in \mathbb{N}_0}$
such that
 $\sum_{k \in \mathbb{N}_0} k^2 p_k = 2 $
 $\sum_{k \in \mathbb{N}_0} k p_k$
and
 $p_1=0$
(or, equivalently,
 $p_0 + p_2 = 1$
) is a curious one, in that quite different behaviours of the giant component are observable for such a degree distribution. (The reader should refer to [Reference Janson and Luczak32] for examples of such behaviours.) Barring this exceptional case, in light of A3, the condition for existence of a giant component is satisfied (see [Reference Molloy and Reed39]) for our stochastic SI model in the traditional sense. To be precise, setting
 $\alpha_{{S}}=1$
and taking the asymptotic limit in time, one finds the fraction of vertices on the giant component to be
 $1- \psi(\theta_\infty)$
, where
 $\theta_\infty>0$
is the solution of
 $\partial\psi(1) \theta_\infty= \partial \psi( \theta_\infty)$
(see [Reference Janson, Luczak and Windridge31, Reference Molloy and Reed40]). However, as mentioned earlier, we take a non-equilibrium point of view and concern ourselves with the time evolution of the fraction of vertices on the infected part of the graph, the ‘percolated component’. As a by-product of the scaling limits in Theorem 1 and Theorem 2, the variable
 $\theta$
defined in Equation (2.5) gives us a tool to approximate the proportion of susceptible individuals in the population (and hence the proportion of infected vertices as well). We expect the fraction of infected individuals to converge in probability to
 $1- \alpha_{{S}} \psi(\vartheta)$
as
 $n \rightarrow \infty$
,
 $\vartheta$
being the scaling limit of
 $\theta$
. A fixed time interval
 $\mathcal{T}_{0}$
enables us to look for critical values in the space of the infection rate
 $\beta >0$
. This allows us to decide whether the system ‘percolates’ in the sense that the fraction of vertices on the percolated component achieves a value greater than a pre-specified one (usually close to unity) by time T. Using different colours in Figure 6, we depict the fraction of vertices on the percolated component as a function of both time and the infection rate
 $\beta$
(let us call such a figure a percolation profile) for three degree distributions with the same mean. Questions such as whether the system with an infection rate
 $\beta$
‘percolates’ are immediately settled by drawing a horizontal line and checking whether the line passes through the colour corresponding to the pre-specified level. See Figure 7 for another comparative view, highlighting the need to take into account higher moments of the degree distribution.
Comparison of percolation profiles of three degree distributions having the same mean. Left: Poisson distribution with mean 6. Middle: A heterogeneous population with degree distribution
 $p_k \,:\!=\, 0.7 \times \mathsf{1}\!\left({k=1}\right) + 0.2 \times \mathsf{1}\!\left({k=4}\right) +0.1 \times \mathsf{1}\!\left({k=45}\right)$
. Such a degree distribution represents a population segregated into three classes. Weak vertices constitute the biggest class, followed by medium-strength vertices and then strong vertices. Right: Negative binomial distribution with parameters
 $r=2$
,
 $p={3}/{4}$
. The figures show the time evolution of the fraction of vertices on the percolated component for varying infection rates
 $\beta$
. We assume the initial fraction of infected vertices is
 $0.1$
in all three cases. The yellow region in each of the plots corresponds to the terminal state. Questions such as whether the system with an infection rate
 $\beta$
‘percolates’ are immediately settled by drawing a horizontal line and checking whether the line passes through the colour corresponding to a pre-specified level. It is worth noting that the limiting proportions of vertices in the giant components eventually getting infected are also quite different for the three degree distributions. While the proportion is around
 $0.91$
(approximately) for the negative binomial distribution and the hand-picked degree distribution in the middle, it is relatively high for the Poisson distribution (approximately
 $0.99$
).

Left: Comparison of the time evolution of the fraction of vertices on the percolated component for different degree distributions with the same mean. The 2-degree distribution in the plot refers to the degree distribution
 $p_k = 0.5 \times \mathsf{1}\!\left({k=1}\right) + 0.5 \times \mathsf{1}\!\left({k=9}\right)$
, where none of the vertices have degree 5 yet the average degree is 5. This presents a pathological case and highlights the need to take into account higher moments of the degree distribution. Right: Comparison of discounted cost against increasing average degree for different degree distributions. With increasing average degree the graphs lose sparsity and facilitate the spread of a computer virus. Therefore, they incur higher cost. When the average degree is very small, regular random graphs seem favourable compared to random graphs with negative-binomially distributed degrees. The costs are computed with
 $n=1000$
,
 $\gamma=1$
.

5.2. The strange case of Poisson-type degree distributions and the exactness of the pair approximation
We consider a particular class of degree distributions called ‘Poisson-type’ (PT) by [Reference Jacobsen, Burch, Tien and Rempała30]. A degree distribution with probability generating function
 $\psi$
is called PT if
 $\kappa(\vartheta )$
, defined in Equation (3.4), is a constant, i.e.,
 $\kappa (\vartheta) =\kappa$
for some
 $\kappa \in \mathbb{R}$
(or, equivalently,
 $\partial{\psi (\vartheta)}= \partial{\psi (1)} \!\left(\psi (\vartheta)\right)^{\kappa}$
). As a consequence, the operators defined in Equation (3.3) are also constants, and satisfy
 \begin{align} \mathbb{D}^{r} {\psi\circ \vartheta} = \prod_{i=1}^{r-1} \left( i \kappa - i +1 \right) = \left( (r-1)\kappa -r +2 \right) \, \mathbb{D}^{r-1} {\psi\circ\vartheta} , \nonumber\end{align}
with
 $\mathbb{D}^{0} {\psi\circ \vartheta} =1$
. The PT class includes Poisson (
 $\kappa=1$
, irrespective of the mean of the distribution), degenerate
 $\big($
r-regular random graphs,
 $\kappa =\frac{r-1}{r} <1\big) $
, binomial
 $\big(\kappa = \frac{N-1}{N} <1$
, independent of p for
 ${Bin}(N,p)\big)$
, and negative binomial
 $\big(\kappa = \frac{r+1}{r}>1$
, independent of p for
 ${NB}(r,p)\big)$
degree distributions. The PT class is particularly peculiar in that it totally decouples the vector
 $x = (x_{{S}}, x_{{SI}}, x_{{SS}})$
and the matrix-valued function V from the auxiliary variable
 $\vartheta$
, so that an autonomous system of ODEs can be obtained for x and V, rendering
 $\vartheta$
redundant. This allows for great simplification in the limiting equations. Define
 $\mathbb{G}_{{}} \!\left( {x} \right) \,:\!=\, (\mathbb{G}_{{S}} \!\left( {x} \right),\mathbb{G}_{{SI}} \!\left( {x} \right),\mathbb{G}_{{SS}} ( {x} ) )$
as
 \begin{align}\begin{aligned}\mathbb{G}_{{S}} \!\left( {x} \right) & \,:\!=\, -\beta x_{{SI}} , \\\mathbb{G}_{{SI}} \!\left( {x} \right) & \,:\!=\, \beta \kappa \frac{x_{{SI}}}{x_{{S}}} (x_{{SS}}- x_{{SI}}) - \beta x_{{SI}} , \\\mathbb{G}_{{SS}} \!\left( {x} \right) & \,:\!=\, -2 \beta \kappa \frac{x_{{SI}} x_{{SS}}}{x_{{S}}} .\end{aligned}\end{align}
Plugging
 $\mathbb{D}^{2} {\psi\circ \vartheta} =\kappa$
and
 $\mathbb{D}^{3} {\psi\circ\vartheta} =\kappa (2 \kappa -1) $
into Equation (4.4), we find that the matrix-valued function V is entirely determined by x. The following is immediate.
Corollary 1. (Scaling limit under PT distributions.) Assume A1, A2, and A3 for a CM graph
 $\mathcal{G}(\psi, n)$
with
 $\partial\psi (\vartheta) = \partial\psi (1) (\psi (\vartheta))^\kappa $
for some
 $\kappa \in \mathbb{R}$
. Then the following law of large numbers holds:
 \begin{align*} \sup_{0<t \leq T} \left\lVert{n^{-1} X(t) -x(t)}\right\rVert \xrightarrow[]{ {P}} 0 , \end{align*}
where x is the solution of
 $ x(t) = x(0) + \int_{0}^{t} \mathbb{G}_{{}} \!\left( {x(s)} \right) \, {d} {s} $
with
 $x(0) = \alpha$
. Moreover, the fluctuation process Y defined in Equation (4.16) converges weakly to a continuous Gaussian vector semimartingale U satisfying
 \begin{align*} U(t) = U(0) + G(t) + \int_{0}^{t} \nabla \mathbb{G} \!\left( {x(s)} \right) U(s) \, {d} {s} ,\end{align*}
where G is a Gaussian vector martingale such that
 $ \left\langle {G} \right\rangle = \left[ {G} \right] = V$
.
In fact, one can obtain a smaller system by expressing
 $x_{{SI}}$
and
 $x_{{SS}}$
explicitly as functions of
 $x_{{S}}$
(see [Reference Jacobsen, Burch, Tien and Rempała30]). This is remarkable because, under the PT class, the graph structure affects the scaling limits only through two summary statistics of
 $\psi$
, namely the mean
 $\partial \psi(1)$
and
 $\kappa=\mathbb{D}^{2} {\psi(1)}$
. Recall that
 $\kappa$
, as defined in Equation 3.4, is the limiting ratio of the average excess degree of a susceptible vertex chosen at random as a neighbour of an infected vertex, to the average degree of a susceptible vertex. Therefore it is, in general, dependent on time through
 $\vartheta$
. Under the PT class, this ratio remains constant throughout the entire course of time
 $\mathcal{T}_{0}$
. Moreover, the mean
 $\partial \psi(1)$
only affects the initial condition
 $x(0)=\alpha$
through Equation (3.2). The dynamics of the limiting process are then dictated by the constant
 $\kappa$
under the PT class.
Now we revisit the correlation equations approach of [Reference Rand43], from the ecology literature, to study the dynamics of counts of singles, pairs, triples, and quadruples of the form A, AB, ABC, ABCD, where
 $A,B,C,D \in \{{S}, {I}\}$
. Following [Reference Rand43], we use the notation
 $\left[ {\cdot} \right]$
to denote the count. In this mean-field approach, the dynamics of singles are described by those of pairs, the dynamics of pairs by those of triples, and so on. In this context, pair approximation refers to approximating the count of triples by pairs as
 \begin{align*}\left[ {ABC} \right] \approx \kappa \frac{\left[ {AB} \right] \left[ {BC} \right]}{\left[ {B} \right]} ,\end{align*}
and closing the system at the level of pairs (also known as pair closure). In order to draw an analogy, we divide the counts by n and use the same notation for the scaled counts. We also set the same initial condition
 $([ {{S}}],[ {{SI}}], [ {{SS}} ]) = \alpha$
at
 $t = 0$
. The pair approximation then yields a system of ODEs for
 $([ {{S}} ],[ {{SI}} ],[ {{SS}} ])$
that exactly matches the limiting ODEs for
 $n^{-1}X$
, i.e.,
 \begin{align} \frac{\, {d}}{\, {d} {t}} {([ {{S}} ], [ {{SI}}], [ {{SS}}])} = \mathbb{G} \left( {([ {{S}} ], [ {{SI}}], [ {{SS}}])} \right) .\end{align}
Therefore, under the PT class, the pair approximation is exact in the sense that it correctly estimates the limiting means of various counts. By virtue of Corollary 1, our FCLT further enables it to correctly estimate all other higher limiting moments, because V is now entirely determined by the solution of Equation (5.2). As the PT class is quite big, our FCLT thus greatly enhances the usefulness of the pair approximation.
5.3. Spread of computer viruses
Epidemic models have been used in the context of the spread of computer viruses for some years now. The correspondence between our model and the application area under consideration is apparent without requiring much change in nomenclature. Early works in this direction did not take into account the inherent graph structure and assumed ‘homogeneous mixing’ in some sense. Recent works, however, have duly studied it on more realistic computer networks, which are often modelled as random graphs, without the assumption of ‘homogeneous mixing’. Lelarge, for example, based much of his work on classical Erdős–Rényi random graphs and CMs (see, e.g., [Reference Lelarge35]). Interested readers are referred to [Reference Kephart and White34, Reference Lelarge35, Reference Wierman and Marchette49] for an overview of relevant literature. Applying our results, we can approximate the number of virus-affected computers over time and the numbers of edges of different types. Additionally, one might be interested in estimating some ‘cost’ involving the count variables in a linear or nonlinear fashion. For instance, if the cost function is polynomial in the count variables, the mixed moments of various orders can be approximated by means of Theorem 2. To illustrate the concept using a simple example, we assume an exponentiated form for the incurred cost to emphasize the severity of a computer being virus-affected. We can then compute time-discounted expected incurred cost and study how it behaves with decreasing sparsity of the underlying graph. To this end, define
 \begin{equation}\begin{aligned}I(t) \,:\!=\, & \exp \bigl( {c X_I (t)} \bigr), \\C_\psi \,:\!=\, & \mathbb{E}\!\left[{\int_{\mathcal{T}_{0}} \exp \bigl( {- \gamma t} \bigr) I(t) \, {d} {t}}\right] = \int_{\mathcal{T}_{0}} \exp \bigl( {- \gamma t} \bigr) \mathbb{E}\!\left[{I(t)}\right] \, {d} {t} ,\end{aligned}\end{equation}
where
 $c>0$
and
 $\gamma>0$
are constants. In Figure 7, we plot the discounted cost
 $C_\psi $
against an increasing average degree of the underlying graph, engendering decreasing sparsity. When the average degree is very small, regular random graphs seem favourable compared to random graphs with negative-binomially distributed degrees.
6. Conclusion and future work
We conclude the paper with a brief literature review followed by a short discussion. In summary, we have studied the susceptible–infected (SI) model by formulating a stochastic process on CM random graphs. Even though this is a simple infection model, the Markovian process on the entirety of the random graph suffers state space explosion as n grows to infinity. Analysis of the non-Markovian aggregate process also becomes complicated. Therefore, scaling limits retaining key features of the network are generally of interest.
6.1. Related works
In the recent scientific literature one comes across a host of dynamical processes arising from epidemiology ([Reference Brauer and van den Driessche18, Reference Newman41, Reference Graham and House27]), statistical physics ([Reference Bollobás and Riordan17]), and computer science ([Reference Lelarge35, Reference Kephart and White34, Reference Wierman and Marchette49]). These dynamical processes are often similar and hence lend themselves to application across disciplines ([Reference Pastor-Satorras and Vespignani42]). In pursuit of scaling limits, much of the research has been inspired by the mean-field approach from statistical physics. For instance, the authors of [Reference Pastor-Satorras and Vespignani42] study epidemic dynamics on the scale-free networks of [Reference Barabási and Albert4]. The majority of work in this direction aims to obtain limiting ordinary differential equations (ODEs) for the proportions of individuals in different compartments of the population. Notwithstanding the simplicity of these methods, the scaling limits presented are approximate and lack mathematical rigour by design. See [Reference Durrett23, Chapter 1] for a critique. The standard mean-field method was further improved by the use of pair approximation in [Reference Gleeson26]. Several other improvements yielding less approximate results have been proposed since. A detailed account is presented in [Reference Barrat, Barthélemy and Vespignani10]. Some of these approximate results have been followed up by probabilists and improved upon ([Reference Durrett23, Reference Durrett24, Reference Chatterjee and Durrett20]).
A related line of research concerns the first-passage percolation (FPP) on random graphs ([Reference Baroni, van der Hofstad and Komjáthy9, Reference Callaway, Newman, Strogatz and Watts19, Reference Van der Hofstad46, Reference Bhamidi, van der Hofstad and Hooghiemstra13, Reference Bhamidi, van der Hofstad and Hooghiemstra11, Reference Bhamidi, van der Hofstad and Hooghiemstra12]). Given a graph
 $G = (V, E)$
with n vertices, we assign random weights
 $W_e$
to edges
 $e \in E$
. We assume the weights are independent and identically distributed. For two vertices
 $i, j \in V$
, the passage time from i to j is defined as
 \begin{align*}\mathsf{c}_{n}(i,j) \,:\!=\, \min_{\mathsf{p}(i,j)} \sum_{e \in \mathsf{p}(i,j)} W_e ,\end{align*}
where the minimum is taken over all paths
 $\mathsf{p}(i,j) $
from the vertex i to the vertex j. By convention,
 $\mathsf{c}_{n}(i,i) \,:\!=\, 0$
, and
 $\mathsf{c}_{n}(i,j) \,:\!=\, \infty$
if there is no path from the vertex i to the vertex j. For two typical vertices i and j, chosen uniformly at random, one looks for a sequence of reals
 $ \tilde{\mathsf{c}}_{n}$
such that
 \begin{align*} \big( \mathsf{c}_{n} - \tilde{\mathsf{c}}_{n} \big) \overset{\mathcal{D}}{\implies} Q ,\end{align*}
for some limiting random variable Q with usually continuous support. Sometimes the scaling limit of the number of edges on the shortest path between two typical vertices is studied along with the passage times. That is, if
 $\mathsf{h}_{n}$
denotes the number of edges on the shortest path between two typical vertices (chosen uniformly at random), we seek a sequence
 $\tilde{\mathsf{h}}_{n}$
of scaling constants such that
 \begin{align*}\big( \mathsf{h}_{n} - \tilde{\mathsf{h}}_{n} \big) \overset{\mathcal{D}}{\implies} \tilde{Q} ,\end{align*}
for some limiting random variable
 $\tilde{Q}$
. The random variable
 $\mathsf{h}_{n}$
is often called the typical hop-count. One of the important questions in the study of FPP concerns the growth rate of the sequence of scaling constants
 $\tilde{\mathsf{c}}_{n}$
and
 $\tilde{\mathsf{h}}_{n}$
, e.g., whether they are of order
 $\log\! (n)$
. Universality results are also important in the study of FPPs and form a substantial body of literature. While the hop-count
 $ \mathsf{h}_{n} $
measures typical distances in the random graph, the passage time
 $\mathsf{c}_{n}$
can be interpreted as the typical (minimum) amount of time required for an infectious disease to be transmitted from an infected vertex to a susceptible vertex. As a result, limit theorems for the passage time
 $\mathsf{c}_{n}$
provide a complementary view to our FCLT for the SI process on CM random graphs as demonstrated by the numerical results in Section 5.
In an epidemiological context, limit theorems for a discrete-time random graph epidemic model were derived in [Reference Andersson2] under rather restrictive assumptions, such as finiteness of a
 $(4+\delta)$
th moment of the degree distribution for some
 $\delta >0$
. The work of Volz in [Reference Volz48] presented scaling limits for susceptible–infected–recovered (SIR) models on random graphs in the form of ODEs. The authors in [Reference Decreusefond, Dhersin, Moyal and Tran21] later proved Volz’s results rigorously by summarizing the epidemic process on CM random graphs into some measure-valued equations. Several similar law-of-large-numbers-type scaling limits under varying sets of technical assumptions surfaced afterwards. For example, uniformly bounded degrees were assumed in [Reference Bohman and Picollelli15, Reference Barbour and Reinert6]. The authors of [Reference Janson, Luczak and Windridge31] assume the degree of a randomly chosen susceptible vertex to be uniformly integrable and the maximum degree of initially infected vertices to be
 $\mathop{}\!o{\left({n}\right)}$
. The work in [Reference Ball and Neal3] studies a variant of the standard compartmental SIR with notions of local (within households, for example) and global contacts, and uses a branching process approximation to derive threshold behaviour and final outcome in the event of a global epidemic. Recently a law of large numbers for the stochastic SIR process on a multilayer CM was derived in [Reference Jacobsen, Burch, Tien and Rempała30] assuming finiteness of the second moment of the underlying degree distribution.
Although a number of scaling limits in the form of laws of large numbers have surfaced over the years, appropriate diffusion approximations have not yet been fully explored. Our FCLT attempts to complement the laws of large numbers already available in the literature. In particular, our FCLT lends itself as an approximating tool in applications where laws of large numbers are inadequate, e.g., in situations involving higher-order moments.
In our present work, we have disregarded ‘recovery’ of the infected vertices. The reason behind this exclusion is our inability to evaluate the neighbourhood distribution of an infected vertex in the presence of spontaneous recovery of its neighbours. One difficulty is that, unlike the susceptible vertices (of a given degree) that have remained untouched by the process of infection and hence receive identically distributed neighbourhoods upon uniformly-at-random matching of half-edges, the infected vertices are not identically distributed, because they already possess partially formed neighbourhoods consisting of infected and recovered neighbours. This corresponds to the part of the graph that has already been revealed up to a given time. Recall the construction of the CM random graph, where the graph is dynamically revealed as infection spreads (see Section 4). As a result, the hypergeometric argument as mentioned in Lemma 1 seems inadequate. For the purpose of obtaining a law of large numbers, we can circumvent this difficulty by suitably bounding the jump sizes of different martingales arising in the proof by the degrees of the vertices concerned. Therefore, we actually do not need the exact neighbourhood distribution of an infected individual for deriving laws of large numbers. However, to establish an FCLT, one needs to find the limit of the quadratic covariation process, which would involve the task of approximating quantities such as
 $\sum_{k \in \mathbb{N}_0} \sum_{i \in I_k} X_{{IS},i}^2$
, where
 $I_k$
is the collection of degree-k vertices that are infected and
 $X_{{IS},i}$
is the number of susceptible neighbours of an infected individual of degree k. We suspect that elaborate bookkeeping of the infection-spreading process would be necessary to approximate such quantities. We have not been able to find a simple workaround so far and intend to pursue this problem in the near future.
Appendix A. Hypergeometric moments
Here, we compute various (conditional) moments that are useful for our derivations. Let us use the shorthand notation
 \begin{equation*} \varsigma (n_{{SI}} ;\, X_{{SI}}, X_{{S} \bullet}, k ) \,:\!=\, \mathbb{P}\!\left({X_{{SI},i} = n_{{SI}}, X_{{SS} ,i}= k- n_{{SI}} \mid \mathcal{F}_{t}}\right),\end{equation*}
conditional on the process history as given in Lemma 1. The following moments are then computed keeping Lemma 1 in mind.
In a straightforward fashion, we get for
 $i \in S_k$
 \begin{align*} \mathbb{E}\!\left[{ ( {X_{{SI},i}})_{3} \mid \mathcal{F}_{t}}\right] & = \sum_{n_{{SI}}} ( {n_{{SI}}})_{3} \frac{\binom{X_{{SI}}}{n_{{SI}}} \binom{X_{{S} \bullet} - X_{{SI}}}{k-n_{{SI}}}}{\binom{X_{{S} \bullet}}{k}} \\ & =\sum_{n_{{SI}}} ( {n_{{SI}}})_{3} \frac{\frac{ ( {X_{{SI}}})_{3}}{ ( {n_{{SI}}})_{3}} \binom{X_{{SI}} -3}{n_{{SI}}-3} \binom{(X_{{S} \bullet} -3) - (X_{{SI}} -3)}{(k-3) -(n_{{SI}}-3)}}{\frac{ ( {X_{{S} \bullet}})_{3}}{ ( k)_{3} } \binom{X_{{S} \bullet} -3}{k-3}} \\ & = \frac{ ( k)_{3} ( {X_{{SI}}})_{3}}{( {X_{{S} \bullet}})_{3}} \sum_{n_{{SI}}} \varsigma (n_{{SI}} ;\, X_{{SI}}-3, X_{{S} \bullet}-3, k -3 ) \\ & = \frac{ ( k)_{3} ( {X_{{SI}}})_{3}}{( {X_{{S} \bullet}})_{3}} .\end{align*}
Similarly, we can derive for
 $i \in S_k$
 \begin{align*} \mathbb{E}\!\left[{ ( {X_{{SI},i}})_{2} \mid \mathcal{F}_{t}} \right]= & \sum_{n_{{SI}}} ( {n_{{SI}}})_{2} \frac{\binom{X_{{SI}}}{n_{{SI}}} \binom{X_{{S} \bullet} - X_{{SI}}}{k-n_{{SI}}}}{\binom{X_{{S} \bullet} (t)}{k}} ={} \frac{ ( k)_{2} ( {X_{{SI}}})_{2}}{( {X_{{S} \bullet}})_{2}} ,\end{align*}
whence we get
 \begin{align*} \mathbb{E}\!\left[{X_{{SI},i}^3 \mid \mathcal{F}_{t}}\right] & = \mathbb{E}\!\left[{ ( {X_{{SI}, i}})_{3} \mid \mathcal{F}_{t}}\right] + 3 \mathbb{E}\!\left[{( {X_{{SI},i}})_{2} \mid \mathcal{F}_{t}}\right] + \mathbb{E}\!\left[{X_{{SI},i} \mid \mathcal{F}_{t}} \right]\\ & = \frac{ ( k)_{3} ( {X_{{SI}}})_{3}}{( {X_{{S} \bullet}})_{3}} + 3 \frac{ ( k)_{2} ( {X_{{SI}}})_{2}}{( {X_{{S} \bullet}})_{2}} + k \frac{X_{{SI}}}{X_{{S} \bullet}} .\end{align*}
Proceeding in a similar fashion, for
 $i \in S_k$
,
 \begin{align*} \mathbb{E}\!\left[{X_{{SI},i} ( {X_{{SS},i}})_{2} \mid \mathcal{F}_{t}}\right] & = \sum_{0 \leq n_{{SI}} + n_{{SS}}=k} n_{{SI}} ( {n_{{SS}}})_{2} \frac{\binom{X_{{SI}}}{n_{{SI}}} \binom{X_{{S} \bullet} - X_{{SI}}}{n_{{SS}}}}{\binom{X_{{S} \bullet}}{k}} \\ & = \sum_{0 \leq n_{{SI}} + n_{{SS}}=k} n_{{SI}} ( {n_{{SS}}})_{2} \frac{\frac{X_{{SI}}}{n_{{SI}}} \binom{X_{{SI}} -1}{n_{{SI}}-1} \frac{ ( {X_{{SS}}})_{2}}{ ( {n_{{SS}}})_{2}} \binom{X_{{S} \bullet} - X_{{SI}} -2}{k-n_{{SI}} -2}}{\frac{( {X_{{S} \bullet}})_{3}}{ (k)_{3} } \binom{X_{{S} \bullet} -3}{k-3}} \\ & = \frac{ ( k)_{3} X_{{SI}} ( {X_{{SS}}})_{2}}{( {X_{{S} \bullet}})_{3}} \sum_{n_{{SI}}} \varsigma (n_{{SI}}, ;\, X_{{SI}}-1, X_{{S} \bullet}-3, k-3 ) \\ & = \frac{ ( k)_{3} X_{{SI}} ( {X_{{SS}}})_{2}}{( {X_{{S} \bullet}})_{3}} .\end{align*}
Similarly, for
 $i \in S_k$
,
 \begin{align*} \mathbb{E}\!\left[{ ( {X_{{SI},i}})_{2} X_{{SS},i} \mid \mathcal{F}_{t}}\right] & = \frac{ (k)_{3} ({X_{{SI}}})_{2} X_{{SS}}}{( {X_{{S} \bullet}})_{3}} , \\ \mathbb{E}\!\left[{X_{{SI},i} X_{{SS},i} \mid \mathcal{F}_{t}}\right] & = \frac{ (k)_{2} X_{{SI}} X_{{SS}}}{({X_{{S} \bullet}})_{2}} .\end{align*}
Appendix B. Interpretation of the
$\mathbb{D}^{} {}$
operator

Here we provide an intuitive explanation for the
 $\mathbb{D}^{} {}$
operator defined in Equation (3.3) in the context of SI processes on CM random graphs. Recall that
 $\mu_{{S}}$
and
 $ \mu_{{S}}^{(r)} $
respectively denote the average degree of a randomly chosen susceptible vertex and the average excess degree of a susceptible vertex randomly chosen as a neighbour of r infected individuals. In Section 3 we mentioned that the operator
 $\mathbb{D}^{r+1} {\psi\circ \vartheta} $
recursively compared a susceptible vertex randomly chosen as a neighbour of r infected individuals with a randomly chosen susceptible vertex. We now make this notion of comparison precise.
Lemma 5. Assume A1, A2, and A3 for the stochastic SI model on the CM graph
 $\mathcal{G}(\psi, n)$
. Then
 $ \mathbb{D}^{r} {\psi\circ\theta} \xrightarrow[]{ {P}} \mathbb{D}^{r} {\psi\circ\vartheta} $
uniformly on
 $\mathcal{T}_{0}$
, and the following recurrence relation for
 $\mathbb{D}^{r} {}$
holds:
 \begin{align} \mathbb{D}^{r+1} {\psi \circ \theta} = \frac{\mu_{{S}}^{(r)} (\theta)}{\mu_{{S}} (\theta)} \mathbb{D}^{r} {\psi\circ \theta} . \end{align}
Proof of Lemma
5. The probability that a randomly chosen vertex i is susceptible and is of degree k is given by
 $\mathbb{P}\!\left({i \in S_k(t)}\right) = n^{-1} X_{{S}} (0) \theta^k (t) p_k $
. The following is then immediate:
 \begin{align*} \mu_{{S}} (\theta(t) ) = \sum_k k \mathbb{P}\!\left({i \in S_k(t) \mid i \in S(t)}\right) = \frac{\sum_{k} k \theta^k (t) p_k}{\sum_{k} \theta^k (t) p_k} =\frac{\theta (t) \partial \psi(\theta (t) )}{\psi(\theta(t) )} . \end{align*}
In order to explicitly calculate
 $ \mu_{{S}}^{(r)} $
, it will be helpful to keep the dynamic construction of the graph in mind. In particular, we make use of the neighbourhood distribution of a susceptible vertex given in Lemma 1. Therefore,
 \begin{align*} \mu_{{S}}^{(r)}(\theta(t) ) & = \frac{\sum_k\! (k-r) \mathbb{P}\!\left({i \in S_k(t)}\right) \mathbb{E}\!\left[{ ({X_{{SI},i}})_{r} \mid \mathcal{F}_{t-}}\right]}{\sum_k \mathbb{P}\!\left({i \in S_k(t)}\right) \mathbb{E}\!\left[{ ({X_{{SI},i}})_{r} \mid \mathcal{F}_{t-}}\right]} \\ & = \frac{\sum_k ( k)_{r+1} \theta^k (t) p_k}{\sum_k (k)_{r} \theta^k (t) p_k} \\ & = \frac{\theta (t) \, \partial^{r+1} \psi(\theta (t) )}{\partial^{r} \psi(\theta (t) )} .\end{align*}
The recurrence relation then follows in a straightforward manner:
 \begin{align*} \mathbb{D}^{r+1} {\psi\circ\theta} = \frac{\theta \, \partial^{r+1} \psi(\theta )}{\partial^{r} \psi(\theta )} \times \frac{\psi(\theta)}{\theta\partial \psi(\theta )} \times \frac{\psi^{r-1} (\theta ) \partial ^r \psi(\theta )}{(\partial \psi(\theta ) )^r} = \frac{\mu_{{S}}^{(r)} (\theta)}{\mu_{{S}} (\theta)} \mathbb{D}^{r} {\psi\circ\theta} .\end{align*}
The convergence
 $ \mathbb{D}^{r} {\psi\circ \theta} \xrightarrow[]{ {P}} \mathbb{D}^{r} {\psi\circ\vartheta} $
, uniformly on
 $\mathcal{T}_{0}$
, follows by virtue of Theorem 1. This completes the proof.
For our purposes, we only need
 \begin{equation*} \frac{\mu_{{S}}^{(1)} (\theta)}{\mu_{{S}} (\theta)} \xrightarrow[]{ {P}} \kappa(\vartheta) = \mathbb{D}^{2} {\psi\circ \vartheta}, \qquad \frac{\mu_{{S}}^{(2)} (\theta)}{\mu_{{S}} (\theta)} \kappa(\theta) \xrightarrow[]{ {P}} \mathbb{D}^{3} {\psi\circ \vartheta}, \end{equation*}
and hence the interpretation in Section 3 as a limiting ratio follows. The two operators
 $\mathbb{D}^{2} {\psi \circ\vartheta}$
and
 $\mathbb{D}^{3} {\psi \circ\vartheta}$
essentially allow us to correctly estimate various pair and triple counts in the large graph limit.
Appendix C. Rebolledo’s theorem
Here we furnish a statement of Rebolledo’s theorem, as our derivation of the FCLT relies heavily on it. The version presented here differs slightly from the original one in [Reference Rebolledo44]. In our application, we only need a central limit theorem for locally square-integrable martingales. Therefore, we borrow the following version from [Reference Andersen, Borgan, Gill and Keiding1].
Let
 $M_1, M_2, \ldots, M_n, \ldots$
be a sequence of vector-valued locally square-integrable martingales. We allow the possibility of their being defined on different sample spaces for each n. Let us denote the components of
 $M_n$
by
 $M_{n} \,:\!=\, (M_{n,1}, M_{n,2}, \ldots, M_{n,k})$
for some
 $k \in \mathbb{N}$
. Now, for each
 $\epsilon >0$
, define
 $ M_n^{(\epsilon)}$
to be a vector-valued locally square-integrable martingale that contains all jumps of
 $ M_n$
larger in absolute value than
 $\epsilon$
as its only jumps. Write
 $M_n^{(\epsilon)} \,:\!=\, \left(M_{n,1}^{(\epsilon)}, M_{n,2}^{(\epsilon)}, \ldots, M_{n,k}^{(\epsilon)} \right) $
. Then the absolute value of the difference between jump sizes of
 $M_{n,i}$
and
 $M_{n,i}^{(\epsilon)}$
is necessarily smaller than
 $\epsilon$
.
The optional quadratic (co-)variation process
 $ \left[ {M_{n,i}, M_{n,j}} \right]$
of the processes
 $M_{n,i}$
and
 $M_{n,j}$
is defined as the sum of the products of the jump sizes of the processes. That is, for
 $i,j =1, 2, \ldots, k$
, we define
 \begin{align*} \left[ {M_{n,i}, M_{n,j}} \right] \,:\!=\, \sum_{s\le t} \delta M_{n,i}(s) \delta M_{n,j}(s) .\end{align*}
By convention, we define
 $ \left[ {M_{n,i}} \right] = \left[ {M_{n,i}, M_{n,j}} \right] $
. For
 $i, j = 1, 2, \ldots, k$
, the predictable quadratic (co-)variation process between
 $M_{n,i}$
and
 $M_{n,j}$
is given by
 \begin{align} \left\langle {M_{n,i},M_{n,j}} \right\rangle (t) &{} \,:\!=\, \int_0^t {Cov}({{d} {M_{n,i} (s)}, \, {d} {M_{n,j}(s)} \mid \mathcal{F}_{s-}} ) \, {d} {s} , \nonumber\end{align}
with the convention
 $ \left\langle {M_{n,i}} \right\rangle = \left\langle {M_{n,i},M_{n,i}} \right\rangle $
. Here,
 $\, {d} {M_{n,i}(s)}$
and
 $\, {d} {M_{n,j}(s)}$
are the increments of
 $M_{n,i}$
, and
 $M_{n,j}$
respectively. Denote the corresponding
 $k\times k$
matrix-valued quadratic variation processes by
 $ \left\langle {M_n} \right\rangle \,:\!=\, \big(\big( \left\langle {M_{n,i},M_{n,j}} \right\rangle \big)\big)$
. Similarly, for the process
 $M_n^{(\epsilon)}$
, denote the corresponding predictable quadratic variation process by
 $ \Big\langle {M_n^{(\epsilon)}} \Big\rangle \,:\!=\, \Big(\Big( \Big\langle {M_{n,i}^{(\epsilon)},M_{n,j}^{(\epsilon)}} \Big\rangle \Big)\Big)$
. Similarly, let
 $ \left[ {M_n} \right] $
denote the matrix of optional quadratic variations of the components of
 $M_n$
. That is,
 $ \left[ {M_n} \right] \,:\!=\, \big(\big( \big[ {M_{n,i},M_{n,j}} \big] \big)\big)$
. Finally, let
 $ \mathcal{T}_{0} \,:\!=\, [0,T]$
be as before and let
 $\mathcal{T}\subset \mathcal{T}_{0}$
.
Theorem 3. (Rebolledo’s theorem for locally square-integrable martingales.) Consider the following three conditions:
 \begin{align} \left\langle {M_n} \right\rangle (t) \xrightarrow[]{{P}} V(t), \forall t \in \mathcal{T} ,\end{align}
 \begin{align} \left[ {M_n} \right] (t) \xrightarrow[]{{P}} V(t), \forall t \in \mathcal{T} ,\end{align}
 \begin{align} \left\langle {M_{n,i}^{(\epsilon)}} \right\rangle (t) \xrightarrow[]{{P}} 0, \forall t \in \mathcal{T}, \epsilon>0, i=1,2,\ldots,k ,\end{align}
as
 $n\rightarrow\infty$
, where V is a
 $k\times k$
semidefinite matrix-valued, continuous deterministic function on
 $\mathcal{T}_{0}$
with positive semidefinite increments and
 $V(0)=\boldsymbol{0}$
, the zero matrix.
Then either of Equation (C.1) or Equation (C.2), together with Equation (C.3), implies the following finite-dimensional convergence:
 \begin{align}(M_n(t_1),M_n(t_2),\ldots,M_n(t_l)) \overset{\mathcal{D}}{\implies} (W(t_1),W(t_2),\ldots,W(t_l)) \nonumber\end{align}
as
 $n\rightarrow\infty$
, where W is a Gaussian vector martingale with
 $ \left[ {W} \right] = \left\langle {W} \right\rangle = V$
and
 $t_1, t_2, \ldots, t_l \in \mathcal{T}$
. Moreover, both Equation (C.1) and Equation (C.2) then hold.
If, in addition,
 $\mathcal{T} $
is dense in
 $\mathcal{T}_{0}$
, then either of Equation (C.1) or Equation (C.2) together with Equation (C.3) implies the following weak convergence:
 \begin{align*} M_n \overset{\mathcal{D}}{\implies} W\end{align*}
as
 $n\rightarrow\infty$
in
 $D^{(k)}$
, the space of
 $\mathbb{R}^k$
-valued càdlàg functions on
 $\mathcal{T}_{0}$
endowed with the Skorokhod topology. Furthermore,
 $ \left\langle {M_n} \right\rangle $
and
 $ \left[ {M_n} \right] $
converge uniformly on compact subsets of
 $\mathcal{T}_{0}$
to V in probability.
Acknowledgements
First of all, the authors would like to thank the anonymous reviewers for their constructive feedback, which significantly improved the quality of the paper. Most of the work was conducted while the first author was a PhD student at the Technische Universität Darmstadt in Germany. It was initiated when the first author was visiting the Mathematical Biosciences Institute (MBI) at the Ohio State University in the summer of 2016. The first author acknowledges the hospitality of MBI during his visit to the institute.
Funding information
The work was co-funded by the German Research Foundation (DFG) as part of project C3 within the Collaborative Research Center (CRC) 1053—MAKI, and by the National Science Foundation under the grants RAPID DMS-1513489 and DMS-1853587. MBI is receiving major funding from the National Science Foundation under the grant DMS-1440386. The first author was supported by the President’s Postdoctoral Scholars Program of the Ohio State University.
Competing interests
There were no competing interests to declare which arose during the preparation or publication process for this article.