Research on child maltreatment has not always been conducted with the rigor that has become the benchmark in recent years. Most of the early work was plagued with definitional issues, restricted to retrospective self-report of maltreatment, and limited by cross-sectional designs. A pioneer in the field, Dr. Penelope K. Trickett spent her career studying the effects of child maltreatment in an effort to advance the science and set the standards for scientific rigor. The Young Adolescent Project (YAP) was designed to answer questions arising about the effects of early maltreatment during a particular period of vulnerability—the transition into and through adolescence. In addition, a key purpose of the study was to expand the research on neglect as a specific form of child maltreatment.
Briefly, the YAP is an ongoing longitudinal study of the developmental outcomes of abuse and neglect among male and female adolescents from different ethnic backgrounds (Latino, African American, and White). It is a multidisciplinary study that is guided by a developmental, ecological perspective. As such, the YAP was designed to consider the physical, social, and psychological influences of childhood maltreatment through the transition from childhood to adolescence. It considers the developmental context in which the maltreatment occurred including family and child rearing, school, and characteristics of neighborhood environments, such as the prevalence of community violence. It advanced the rigor of the existing research on maltreatment by employing a cross-sequential design (Schaie, Reference Schaie1965), systematically assessing maltreatment experiences from child welfare case records, including both males and females, and considering the importance of the adolescent transition as a time of vulnerability. In response to a call from the National Institutes of Health for proposals specifically focused on neglect, the original conceptualization of the study was to specify the particular effects of neglect, as less knowledge had been accumulated on this type of maltreatment. However, the study team acknowledged that there was a high likelihood of encountering other forms of maltreatment in our sample due to the high co-occurrence of maltreatment types. Foremost in the planning of the study was the need to build an empirical basis for future theory and more guided hypotheses regarding maltreatment types.
The main objectives of the study were the following:
1. To demonstrate how various features of type of neglect, chronicity, severity, and circumstances determine how young adolescents experience neglect and how patterns that indicate neglect are distinct from patterns that indicate other forms of maltreatment.
2. To provide a refined description and consequent better understanding of the relationship between patterns of neglect and physical and psychological development through a period that encompasses the transition from childhood into adolescence. In particular, to show how particular features of neglect relate to the following variables:
a. physical health and development, including hormone changes that accompany stress
b. the development of qualities of self-esteem, cognitive capability, educational and occupational preparedness, and interpersonal competence
c. the development of qualities of maladaptation and maladjustment, as seen in depression, aggression, dissociation, sexual acting-out, delinquent behavior, and substance abuse
3. To better indicate how the child's stage of pubertal development is related to the psychological effects of neglect.
4. To provide information about the relationships between physical and physiological processes and correlates, on the one hand, and psychological variables and correlates, on the other hand.
5. To describe how the various relationships are similar or different for males and females and for members of different ethnic groups (Latino, African American, and White).
6. To improve our understanding of how child neglect adversely affects some individuals more than others and how family, peer, and neighborhood characteristics can exacerbate or attenuate negative outcomes.
7. To work toward developing a comprehensive scientific theory of the consequences of child neglect. Such a theory will integrate developmental, psychobiological, and ecological perspectives.
As suspected, analyses of case records revealed that neglect rarely occurred in isolation, and accordingly, the YAP study has taken on greater significance as one that can differentiate the effects of different types of maltreatment across early to late adolescence. As such, the study took on new objectives—to determine which types or combination of maltreatment experiences were associated with differences in functioning for these youth. Spearheaded by Drs. Penelope Trickett and Ferol Mennen, the YAP study has tackled critical issues in child maltreatment research, including nuanced analyses of different maltreatment types, self-reports versus official reports of maltreatment, the effects of maltreatment on psychobiological development including puberty, physical health outcomes, mental health functioning, social support and parenting, community violence exposure, externalizing behavior, and risk behavior. To date, data from the YAP study have yielded 45 publications with many more questions yet to be examined. This report outlines the study design, methods, and measures used in the YAP and presents findings from selected publications to date.
Methods
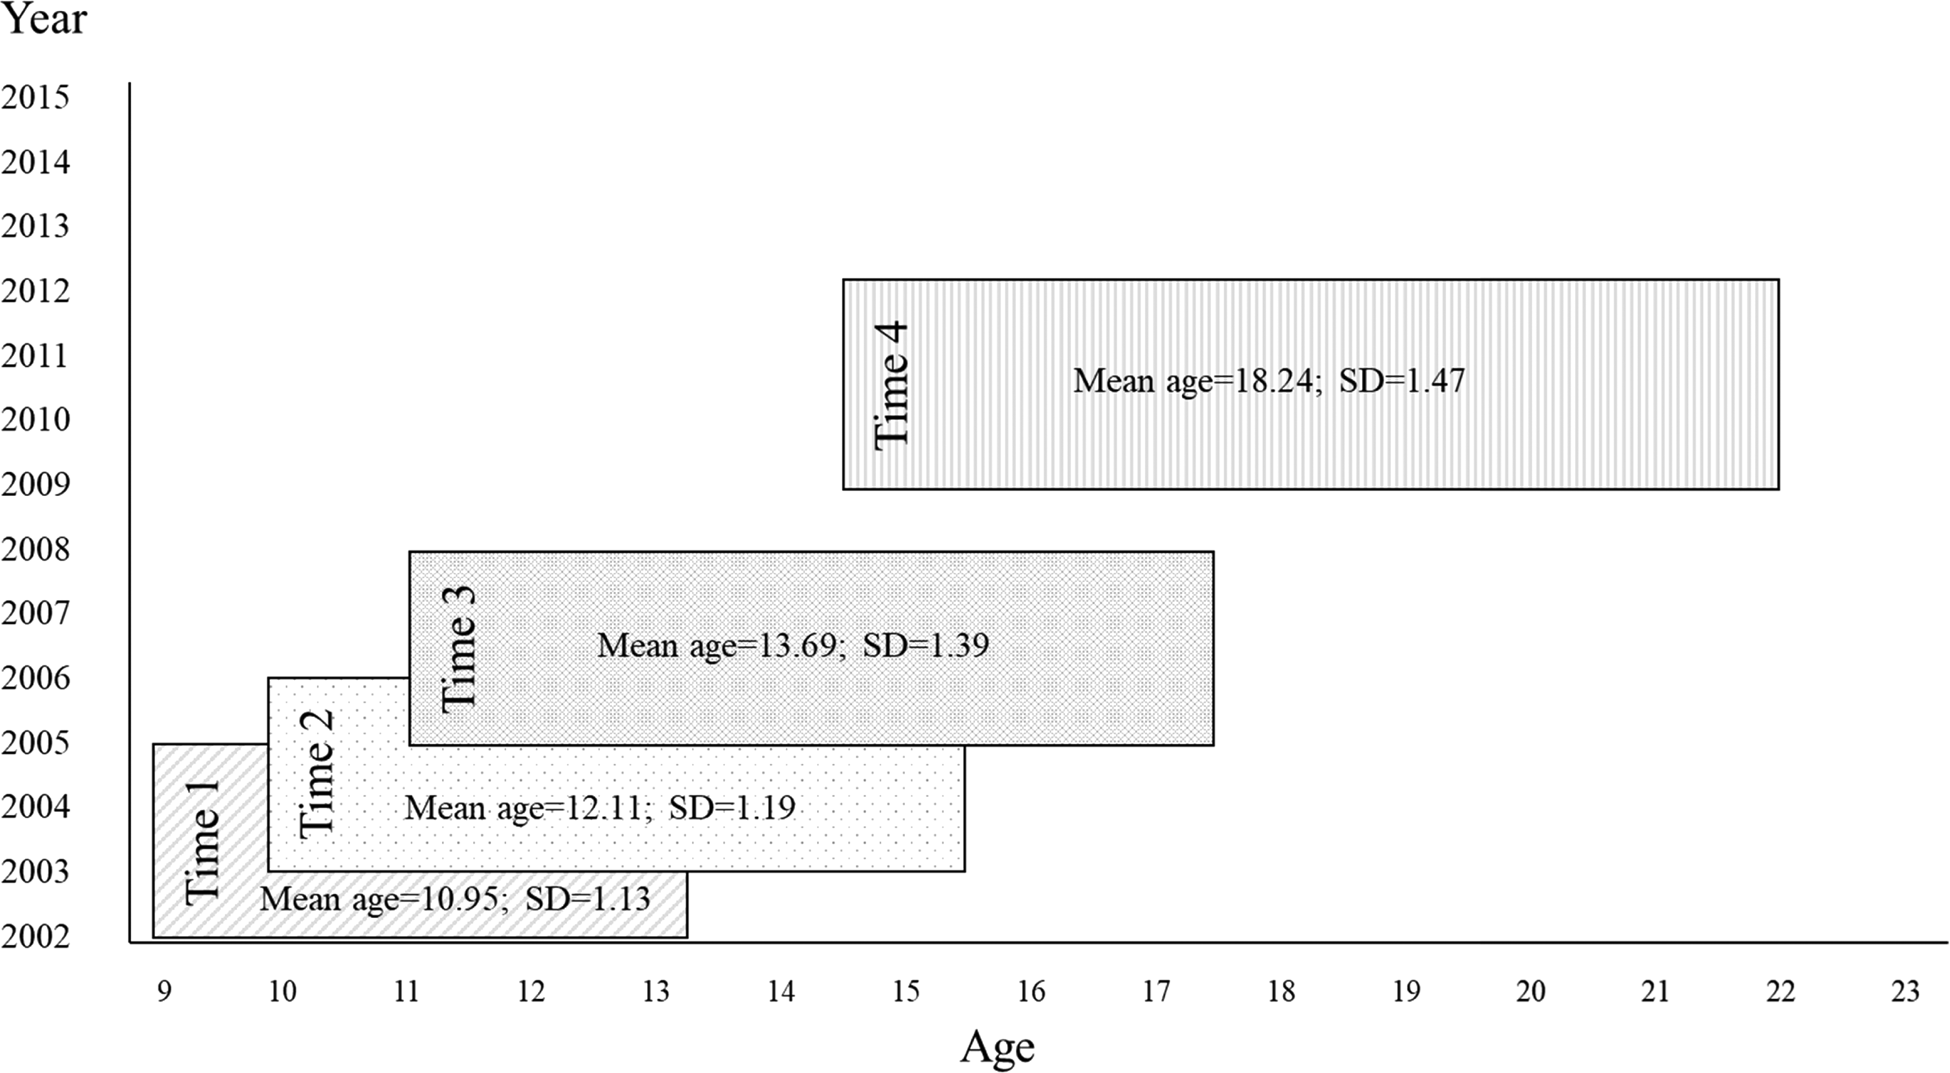
The original sampling design of the Young Adolescent Project was to enroll equal numbers of neglected, other maltreated, and comparison youth to achieve nearly equal sample sizes for group comparisons. Recruitment occurred from 2002 until 2005 and enrolled 454 adolescents aged 9–12 years into the baseline assessment (Time 1: 2002–2005; n = 303 maltreated; n = 151 comparison; 241 males and 213 females; M age = 1 0.95, SD = 1.13). Time 1 was followed by three additional assessments with the full sample. Time 2 (2003–2006; M age = 12.11, SD = 1.19); Time 3 (2005–2008; M age = 13.69, SD = 1.39); and Time 4 (2009–2012; M age = 18.24, SD = 1.47) occurred approximately 1 year, 1.5 years, and 4.4 years following each prior assessment. Time 5 (2013–2015; M age = 21.77, SD = 1.46) was a pilot study with a subsample of the enrolled participants (n = 152) that took place an average of 3.7 years after Time 4. The study design (T1–T4) is shown in Figure 1.Footnote 1
Study design Time 1–Time 4.

Sample Description
The maltreated sample (n = 303) was recruited from active cases in the Los Angeles County Department of Children and Family Services (LACDCFS). The inclusion criteria were (a) a new case opened by LACDCFS in the preceding month for any type of maltreatment; (b) child age of 9 to 12 years; (c) child identified as Latino, African American, or White (non-Latino); (d) child residing at the time of the referral to LACDCFS in one of 10 zip codes in urban Los Angeles County. The sampling was restricted in this way because children sampled from all areas would come from very different conditions. The recruitment goal was an urban sample with sizeable subsamples of the 3 largest ethnicities of the urban area. Thus, using both LACDCFS statistics on rates of maltreatment (for children of different ethnicities) and census tract information on ethnic diversity, 10 urban zip codes within relatively easy travel distance from the University of Southern California (USC) were chosen from which to recruit the maltreated group.
The recruitment procedures were developed in collaboration with LACDCFS and had both that agency's approval and the approval of the Juvenile Court and the USC Institutional Review Board. During the recruitment phase, on a monthly basis, LACDCFS sent contact information for all of the families who met the above-described inclusion criteria. A letter was sent to caretakers inviting them to participate in a study of adolescent development that was being conducted at USC. By returning a postage-paid postcard accompanying the letter, the recipient could indicate willingness or unwillingness to participate. Unless a returned postcard indicated unwillingness to participate, the potential participant received a phone call approximately 10 days after the letter was sent. In this call the person was either thanked for volunteering—if they had returned the postcard indicating that—or again invited to participate. In all, 77% of the families that received the letter agreed to participate. Recruiting the sample of 303 maltreated children required just over two years and was completed in fall of 2004.
The comparison sample (n = 151) was recruited from among the same zip codes as the maltreated sample. At the study outset we used marketing lists of adults with children in our designated age range and zip codes. Initial contact was via letter (briefly describing the study) and a return-postcard that was sent to the primary caretakers. That letter was followed by a phone call unless the postcard was returned and indicated unwillingness to be contacted. Because of a relatively large number of incorrect or incomplete addresses provided by the marketing firm, it is difficult to estimate accurately the participation rates, but somewhat over 50% of families that were contacted were willing to participate. These families indicated no prior contact with LACDCFS. The recruitment of the comparison sample began several months after recruitment of the maltreated sample and it was completed in summer of 2005.
All of the adolescents and caretakers were paid for their participation at a rate based on the National Institutes of Health standard compensation for healthy volunteers. In addition, we provided compensation for travel and childcare if needed in order to ensure that these issues did not bias who could participate in the study. At the follow-up assessment, we also paid for travel and hotel if they had moved out of the area or paid for research assistants to travel to their location, again to avoid bias in the retention of our sample.
Comparability of the Maltreated and Comparison Groups
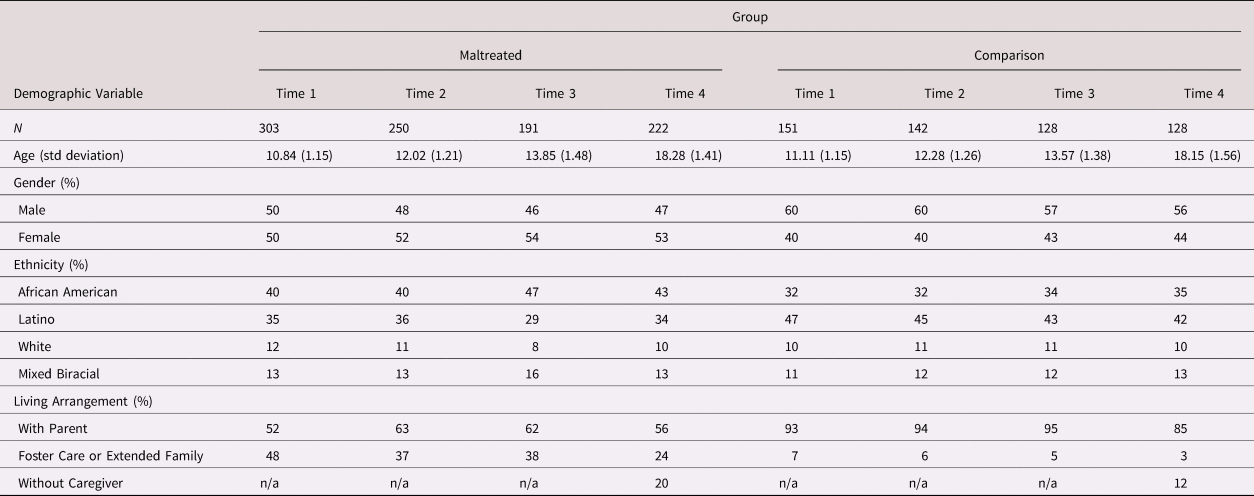
The demographic characteristics of the maltreated and comparison groups are shown in Table 1. The maltreated and comparison groups differed most prominently regarding “living arrangements.” (i.e., whether the child lived with a parent, foster caregiver, or with extended family such as a grandparent or aunt/uncle). About half of the maltreated adolescents were in one of the latter two categories, almost always because of the circumstances of their maltreatment. In addition, the two groups differed slightly in gender and ethnic composition.
Sample characteristics for Time 1, 2, 3, and 4

To determine whether the differences in living arrangements were indicative of important differences in homes and neighborhoods in which the adolescents resided, we compared the samples on variables from the year-2000 U.S. Census for the addresses of the homes in which the children were living (for the maltreated children, the address where they were living at the time of the referral to LACDCFS). Comparisons were made on nine census categories that are relevant to characterizing the social, educational, economic, and demographic nature of neighborhoods and deemed to be important for child development. Independent-sample t-tests were conducted for each category of each census characteristic. In 72 comparisons of this kind, nine statistically significant differences were found. For example, children from the maltreated group were living in census block groups where, on average, 12% of the people were between the ages of 40 and 49 years old compared with 13% for the comparison group. Like the finding reported above, none of these differences were at all large—not theoretically important and not likely to produce an effect through a relationship with other variables. Overall, for the dimensions examined, the neighborhoods of the maltreated and the comparison group were very similar.
Retention
Sample retention from T1 to T2 was 86%; from T1 to T3 it was 71%, and from T1 to T4 it was 78%, averaging 78% retention across all waves. This is an extraordinarily high rate of retention for this type of high-risk sample. Attrition analyses indicated that the participants that were not seen at T2 were more likely to be in the maltreatment group (OR = 4.38, p < .01); those not seen at T3 were more likely to be Latino (OR = 3.37, p < .01) and in the maltreatment group (OR = 5.36, p < .01); and those not seen at T4 were more likely to be in the maltreatment group (OR = 2.45, p < .01) and male (OR = 1.86, p < .01). Although more of the maltreated sample has been lost to attrition, the original study design accounted for this by recruiting 2/3 maltreated participants (n = 303) and 1/3 comparison participants (n = 151).
Procedures
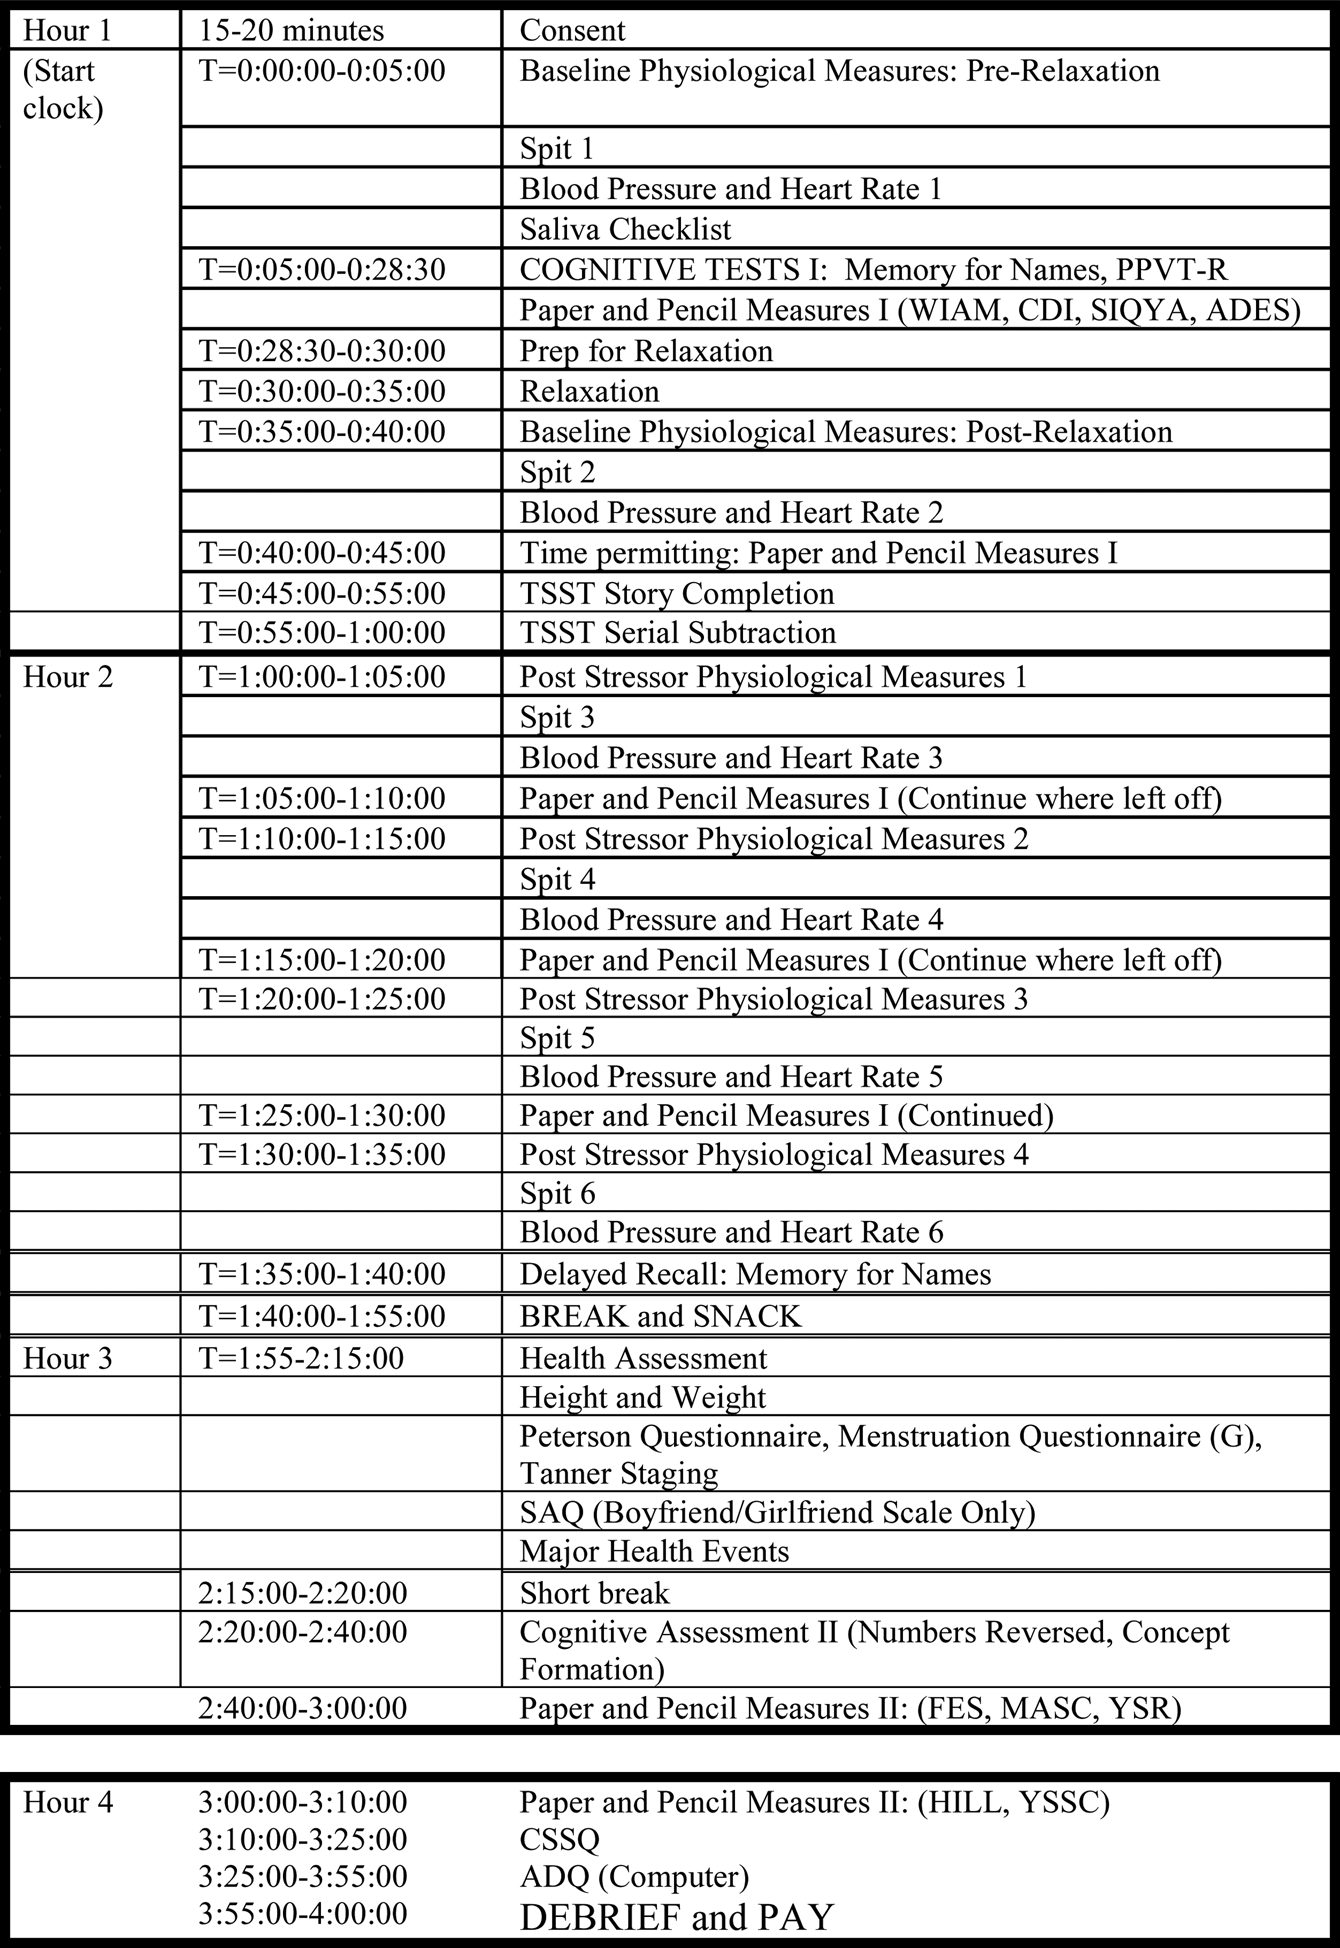
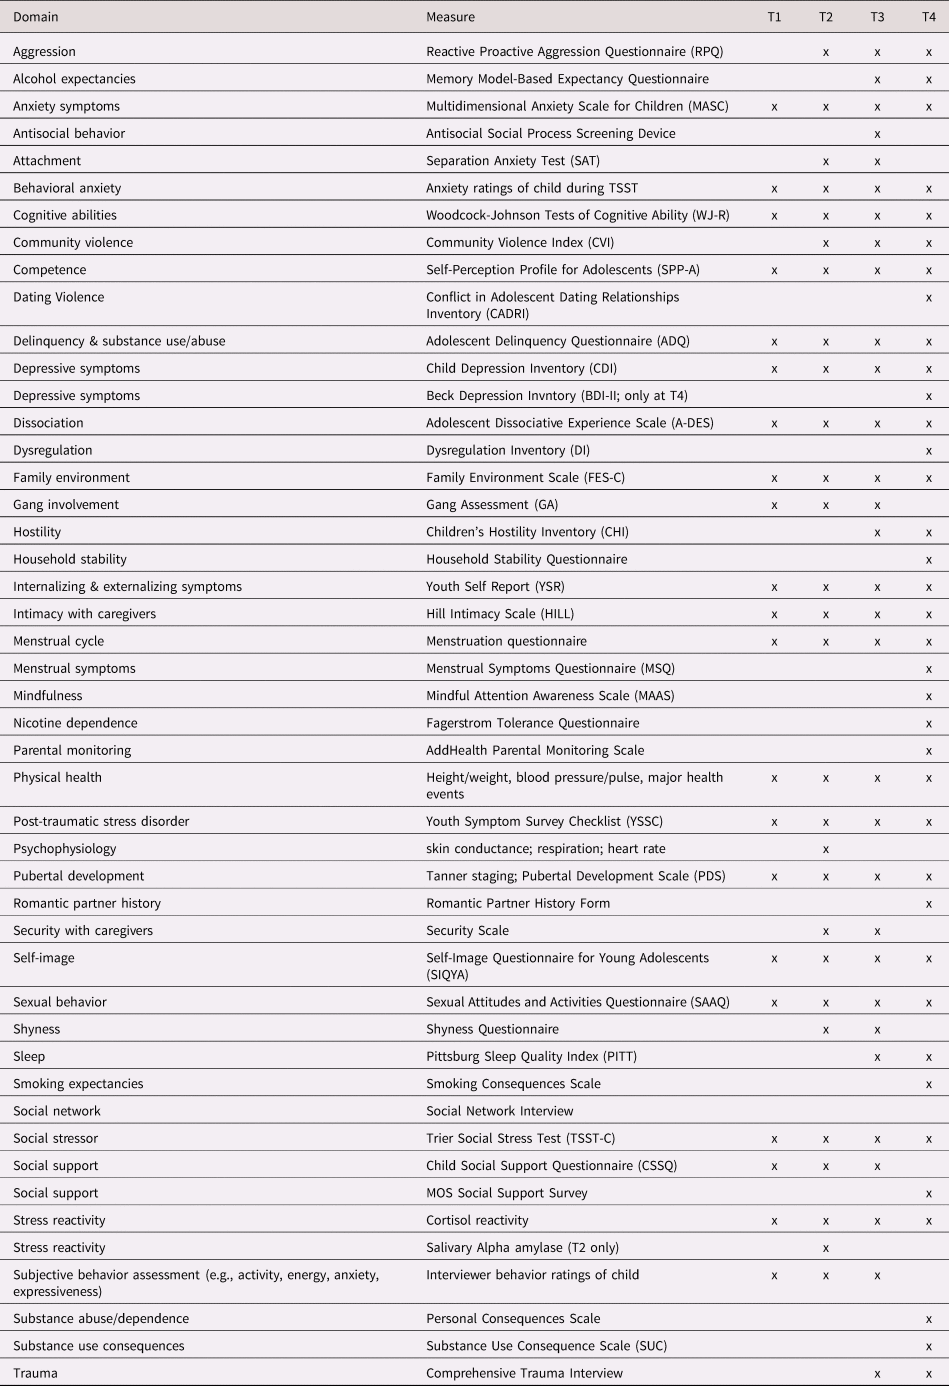
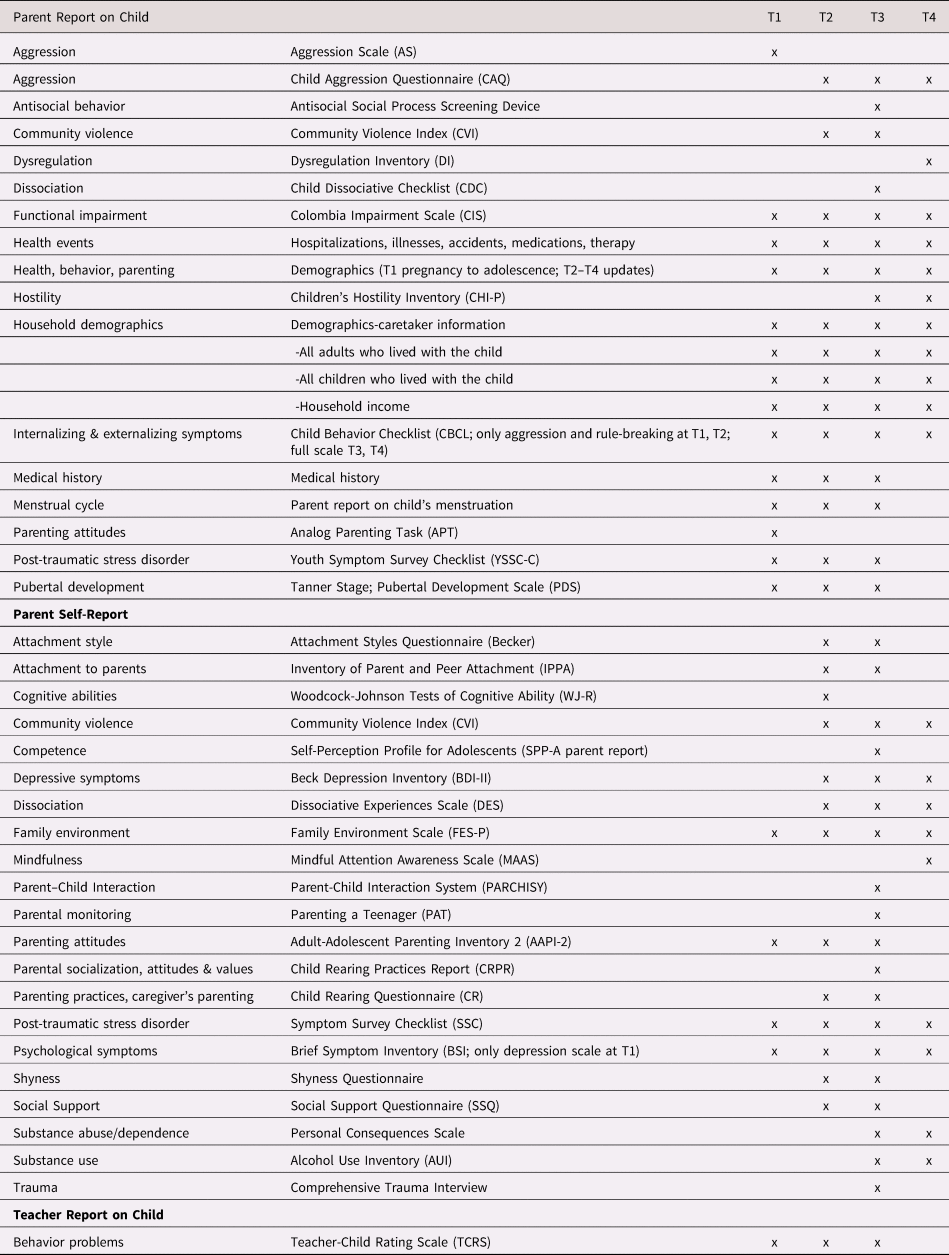
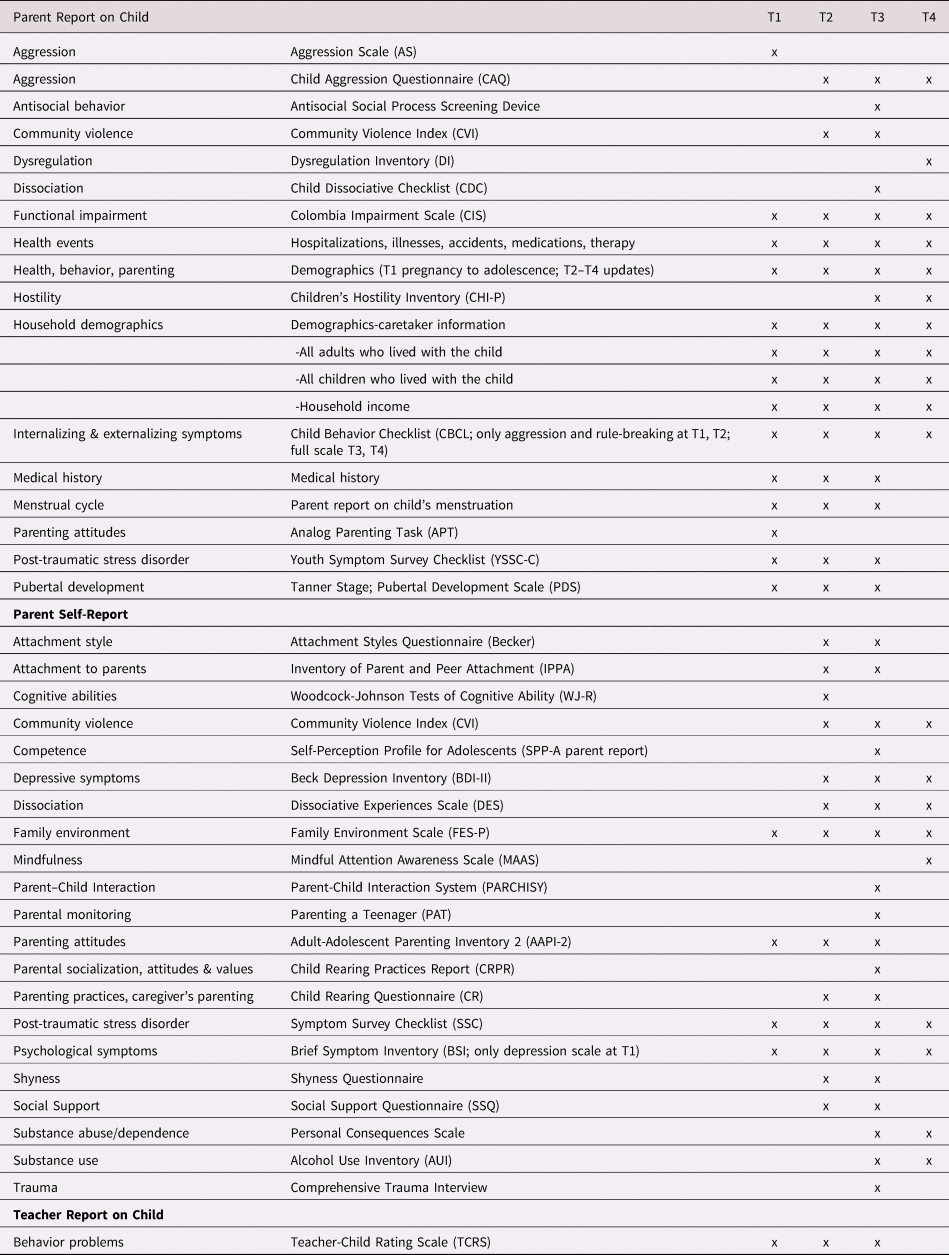
Assessments were conducted in the research offices at the University of Southern California. After assent and consent were obtained from the adolescent and caretaker, respectively, the adolescent was administered questionnaires and tasks during a 4-hr protocol. All four waves with the full sample followed a similar protocol as that for T1 (Figure 2). The Trier Social Stress Test for Children (Buske-Kirschbaum, Jobst, Psych, Wustmans, & Kirschbaum, Reference Buske-Kirschbaum, Jobst, Psych, Wustmans and Kirschbaum1997) was administered 45 minutes after the start of the interview. Two saliva samples were taken prior to the TSST-C, one at the start of the interview and the second 35 minutes later (10 minutes prior to the start of the TSST-C). Four additional samples were taken, one immediately after the TSST-C and three others at 10, 20, and 30 minutes after the TSST-C. Both the child and caretaker were compensated for their participation. The measures obtained at each Time are shown in Table 2 (child) and Table 3 (parent and teacher).
Outline of Time 1 interview procedures.

Child self-report measures T1 to T4

Parent and teacher report measures T1 to T4
Development of the Maltreatment Case Records Abstraction System (MCRAI)
The impetus for the development of a record abstraction system was to provide a standardized instrument for assessing maltreatment to improve the measurement of maltreatment experiences. The child welfare referral that initiated the child's recruitment for the YAP study contained a code for maltreatment type. However, this was a child welfare administrative decision and did not necessarily reflect the complexity of the child's maltreatment experience at the time of referral or take into account any prior case records. This maltreatment code may have simply reflected the type of maltreatment that was the easiest to prove in order to get the child into social services. To obtain the most complete information about the maltreatment histories of our sample, all of the available case records were obtained. For most participants, five years of previous records were available from DCFS, although for some youth data were available from birth. To systematically abstract the large amount of information that was available in each record, we developed a comprehensive database called the Maltreatment Case Record Abstraction Instrument (MCRAI). The MCRAI was based on the Maltreatment Classification System (MCS; Barnett, Manly, & Cicchetti, Reference Barnett, Manly and Cicchetti1993) and the LONGSCAN Modified Maltreatment Classification System (MMCS; English & the LONGSCAN Investigators, Reference English1997). We created a comprehensive codebook to standardize the information from the case records that was abstracted into the database and designed the codebook to include specific data on a child's experience as detailed in official records, thereby allowing the categorization of maltreatment experiences in quantifiable terms (a copy of the MCRAI is available upon request). The MCRAI descriptions differ from the MCS and the MMCS in that the MCRAI retains the details of the youth's experiences, whereas the MCS and MMCS use the youth's experiences to categorize the severity of the maltreatment without retaining the details in the database. For example, the MMCS codes for sexual abuse subtypes (i.e. exposure, exploitation, molestation, and penetration) and the details of the sexual abuse experiences are incorporated into a rating of severity in the MMCS. For example, a score of “1” is given to a child who is exposed to explicit sexual stimuli whereas a score of “5” is given for forced intercourse or prostitution of the child. When developing the MCRAI, we decided not to have raters code the sexual abuse acts into a severity score but instead to indicate which type(s) of sexual abuse the child had experienced to capture the full range of sexual abuse experiences that may have occurred for our participants.
The MCRAI codes four major forms of maltreatment (i.e., physical abuse, sexual abuse, emotional abuse, and neglect) and is based on the maltreatment acts that are inflicted on a child rather than a child's injury. For example, neglect involved failure to provide basic necessities (e.g. shelter, hygiene, food, medical care, or education) and lack of supervision (e.g. child left alone, child left alone with inappropriate substitute care; Mennen, Kim, Sang, & Trickett, Reference Mennen, Kim, Sang and Trickett2010). Furthermore, along with the four forms of maltreatment, two more categories were included in MCRAI. One category included caretaker incapacity (e.g., due to hospitalization, unknown whereabouts, incarceration) and/or caretaker's inability to provide adequate care for the child (e.g., due to caregiver's mental illness, substance use, or physical illness). Also, a substantial risk designation was included, as it applied to instances in which no clear allegation of maltreatment existed for the child but circumstances put the child at risk for maltreatment (e.g., a sibling was abused or neglected).
The database for the MCRAI included the original DCFS categorization of each report of maltreatment (physical abuse, sexual abuse, neglect, emotional maltreatment, substantial risk, and caretaker incapacity), the type of reporting party, and the disposition. In addition, the MCRAI was constructed so that following entry of the official data, a data field with each type of maltreatment was listed that incorporated specific information about each instance of maltreatment. This information included the perpetrator's relationship to the child, age of child at onset of abuse, frequency, duration, and other specifics of the abuse (e.g., whether hospitalization occurred, whether there were physical indicators of maltreatment on the child). Additionally, all of the DCFS allegations of maltreatment and their investigation status (i.e., whether or not the allegations were confirmed) were entered into the database. Information about the parents’ functioning in relation to substance abuse, domestic violence, and mental and physical health was also part of the system. Thus, detailed information could be entered for each category that was relevant for each specific report of maltreatment. A new record was created for each new report of maltreatment that included all of the relevant data for that particular report. Unsubstantiated cases of maltreatment have been noted as having minimal differences from substantiated cases in terms of predicting outcomes; therefore, all maltreatment allegations were included to increase the accuracy of the child's experience (Drake, Reference Drake1996; Hussey et al., Reference Hussey, Marshall, English, Knight, Lau, Dubowitz and Kotch2005).
Procedures for abstracting child maltreatment case records
Two retired DCFS supervisors accessed DCFS records and court reports for each participant in the maltreatment group and reviewed all of the investigation documents on each report of maltreatment. These agency records included emergency referral information, screener's descriptions, investigation narratives, and contact sheets. The DCFS supervisors provided a summary of each youth's case along with the full case records. Trained social work masters students and psychology undergraduate students entered the data from the DCFS case records into the MCRAI database. The record reviews included the maltreatment report that led to the child being identified as a potential participant in the study as well as prior reports of maltreatment for the five years before study entry (this was the limit of most prior records in the current DCFS system). When there were multiple types of maltreatment, the abstractors entered the details of each type of maltreatment in the corresponding section for that type of maltreatment. The child was the unit of analysis so even if the same maltreatment occurred for siblings, each youth's experience was entered individually.
The abstracted data were checked with the summary provided by the DCFS consultants to ensure that no maltreatment incidents were missed. The original DCFS case records were rechecked when inconsistencies were found. Group decision-making occurred to modify entries when needed. Eighty records were randomly chosen during the data collection process to test inter-rater agreement among the five abstractors. Two different abstractors entered the same report into the MCRAI. Inter-rater reliability for each type of maltreatment yielded good kappa statistics: physical abuse κ = .82, sexual abuse κ = .82, emotional abuse κ = .79, and neglect κ = .75.
Summary of Research Findings to Date
Understanding Child Maltreatment Histories
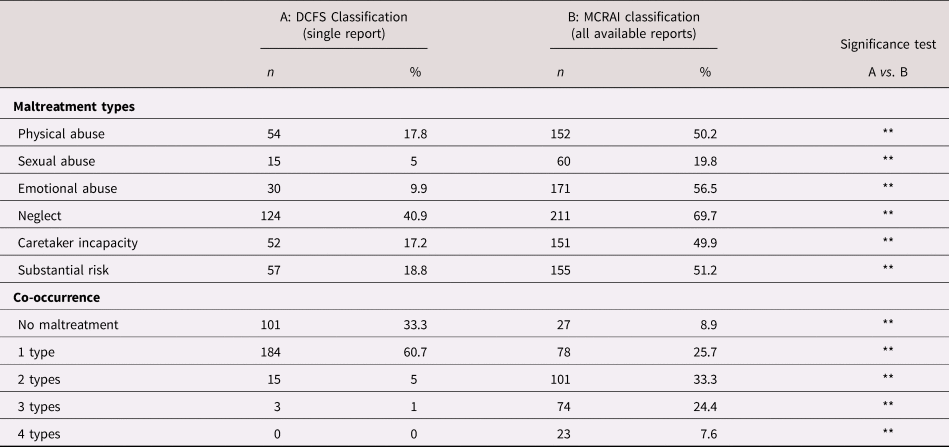
Paramount to the study of child maltreatment is understanding and accurately capturing the variety of experiences of youth that are involved in the child welfare system. Our publications on this topic detail the variation in experiences that are labeled neglect, emotional abuse, sexual abuse, and physical abuse (Kim, Mennen, & Trickett, Reference Kim, Mennen and Trickett2017; Mennen et al., Reference Mennen, Brensilver and Trickett2010; Negriff, Schneiderman, Smith, Schreyer, & Trickett, Reference Negriff, Schneiderman, Smith, Schreyer and Trickett2014; Stevens, Schneiderman, Negriff, Brinkman, & Trickett, Reference Stevens, Schneiderman, Negriff, Brinkman and Trickett2015; Trickett, Mennen, Kim, & Sang, Reference Trickett, Mennen, Kim and Sang2009). In these publications, the prevalence rates of each maltreatment type as coded by CPS (in the referral that initiated the recruitment to the YAP study) was far lower than the prevalence rates found when using the MCRAI (Mennen et al., Reference Mennen, Brensilver and Trickett2010; Negriff et al., Reference Negriff, Schneiderman, Smith, Schreyer and Trickett2014; Stevens et al., Reference Stevens, Schneiderman, Negriff, Brinkman and Trickett2015; Trickett et al., Reference Trickett, Mennen, Kim and Sang2009). The average number of CPS reports for YAP participants was 3.7 (SD = 2.7) within 4 years prior to enrollment in the study. Thus, not surprisingly, only using the single maltreatment type identified by CPS significantly underestimated both the incidence of each maltreatment type and the co-occurrence of types. Indeed, according to the MCRAI coding, 70% of the sample experienced neglect, almost 57% experienced emotional abuse, more than 50% experienced physical abuse, and almost 20% experienced sexual abuse (Kim et al., Reference Kim, Mennen and Trickett2017). Overall, our findings indicate that using the MCRAI reveals information about the prevalence of maltreatment that is likely not clear from data that is available when using only a single CPS report from enrollment in the study (Table 4).
Prevalence and co-occurrence of maltreatment types within the maltreated group (n = 303)

Note: aMaximum possible number of maltreatment types is four (physical, sexual, emotional abuse, and neglect); b Cases having only caretaker incapacity and/or substantial risk; **p < 0.01.
These analyses also identified subtypes within each type of maltreatment. The neglect analysis revealed the most common type of neglect to be supervisory neglect (72.5%), followed by environmental neglect (61.6%; Mennen et al., Reference Mennen, Brensilver and Trickett2010). The most frequent subtype of emotional abuse was terrorizing (parents threatening suicide, threatening the child with harm, or engaging in physical acts that are particularly frightening), and nearly 79% of the participants had experienced more than one subtype (Trickett et al., Reference Trickett, Mennen, Kim and Sang2009). About three-quarters of the 60 sexually abused youth in the sample had experienced nonpenetrative physical contact, 40% had experienced penetration, and 15% had experienced sexual abuse without physical contact (e.g., exposure to pornography or sexual acts; Negriff et al., Reference Negriff, Schneiderman, Smith, Schreyer and Trickett2014). The physically abused youth had a significantly higher mean number of CPS reports and higher mean number of incidents of maltreatment than did nonphysically maltreated youth (Stevens et al., Reference Stevens, Schneiderman, Negriff, Brinkman and Trickett2015).
These data also demonstrate high rates of co-occurrence among maltreatment types. Specifically, 65.3% of the maltreated group experienced multiple types of maltreatment and the MCRAI revealed specific patterns of co-occurrence (Kim et al., Reference Kim, Mennen and Trickett2017). For example, neglect was accompanied by other types of maltreatment or at-risk categories (e.g., parental incapacity, at-risk sibling) in 79.8% of the cases and neglect accompanied by physical and emotional abuse was the most frequent form of maltreatment. The emotionally abused youth also experienced physical abuse (63%) and/or neglect (76%; Trickett et al., Reference Trickett, Mennen, Kim and Sang2009) and almost 97% of the physically abused youth experienced other types of maltreatment or risk (Stevens et al., Reference Stevens, Schneiderman, Negriff, Brinkman and Trickett2015). Caretaker mental illness and domestic violence were significant correlates of children's experiencing multiple types of maltreatment, while substance abuse was not (Kim et al., Reference Kim, Mennen and Trickett2017). Trickett, Kim, and Prindle (Reference Trickett, Kim and Prindle2011) also explored patterns of multiple types of maltreatment using a cluster analysis. The resulting four clusters were physical abuse + neglect group (36%), emotional abuse + physical abuse (11.6%), emotional abuse + physical abuse + neglect group (32.6%), and all four types (19.8%). The four clusters were differentially associated with multiple outcome measures such as mental health, behavioral problems, self-perception, and cognitive development. In general, youth in the four-type group fared worst, with the boys showing more difficulties than the girls.
Although data that is obtained from CPS reports is often considered the gold standard, there are also concerns that unreported maltreatment may exist in child welfare populations (Runyan et al., Reference Runyan, Cox, Dubowitz, Newton, Upadhyaya, Kotch and Knight2005). There is also the possibility that self-reported maltreatment and case-record-reported maltreatment might differentially predict negative outcomes. These differences in methods of measuring maltreatment may contribute to the inconsistencies that are observed in the literature. To examine these questions, we tested the concordance between maltreatment abstracted by the MCRAI and self-reported maltreatment experiences (via the Comprehensive Trauma Interview; CTI). Overall concordance was poor. An average of 48% of maltreatment events that were coded by the MCRAI were unique cases that were not captured by the CTI, whereas an average of 40% of self-reported maltreatment (CTI) was not indicated by the MCRAI (Negriff, Schneiderman, & Trickett, Reference Negriff, Schneiderman and Trickett2017). Analyses with outcomes showed that generally, self-reported maltreatment, regardless of concordance with the MCRAI, was related to the poorest outcomes. However, both self-report and data drawn from reviewing case records appear to provide unique and useful information.
The laborious task of abstracting the CPS case records of the 303 participating maltreated adolescents resulted in rich data that illuminated the considerable complexity in children's maltreatment experiences that has the potential to advance our understanding of the associated outcomes. However, in spite of the potential that this approach may have, case-record abstraction relies heavily on the CPS documents, which may not provide complete information about the maltreatment experiences. In the process of investigation, case records may minimize or underestimate the maltreatment experiences. In sum, most research to date has tended to focus on a single form of abuse (i.e., physical abuse, sexual abuse, and more recently, neglect). Our findings clarify the importance of assessing multiple forms of maltreatment, as single occurrence of type of maltreatment is rare and the high co-occurrence of multiple types of child maltreatment has important implications for developmental outcomes.
Social Support, Family, and Parenting
Child maltreatment has been characterized as a fundamental failure in the caregiver–child relationship, and as such, sets in motion a cascade of associated developmental challenges (Cicchetti & Toth, Reference Cicchetti and Toth1995). Foremost, there is a disruption in the attachment relationship, with maltreated children more likely to show insecure attachment to the primary caregivers (Baer & Martinez, Reference Baer and Martinez2006). This contributes to a schema of inconsistency, unavailability, or punitive responses from the people on whom the child relies for comfort in times of distress. In early childhood, this may translate into deficiencies in interpersonal skills and potential disruption in social support, which has lifelong implications for forming healthy, lasting relationships (Trickett & Negriff, Reference Trickett, Negriff, Underwood and Rosen2011).
In an effort to understand what may distinguish parents who maltreat their children, we examined the parenting attitudes, family environments, and the mental health of maltreating mothers who retained custody of their child(ren) compared with foster and comparison mothers of youth in the study (Mennen & Trickett, Reference Mennen and Trickett2011). Maltreating mothers were found to report levels of depression and anxiety that were nearly twice as high as those reported by foster and comparison mothers. Foster mothers were higher than the other two groups of mothers on the organized/structure subscale of the Family Environment Scale, indicating better family functioning for foster mothers. Foster and comparison mothers had higher levels of education, which in turn related to better parenting attitudes. These findings indicate that maltreating mothers report important differences from other mothers in their communities, which are likely to affect their relationships with their children.
Social support plays a key role in adolescent development and we found important differences in social support networks between maltreated and comparison youth and between maltreated youth with different placement types (i.e. biological parent, nonrelative foster caregiver, kin caregiver; Negriff, James, & Trickett, Reference Negriff, James and Trickett2015). Maltreated youth named significantly fewer people in their social support network than did comparison youth and comparison youth named significantly more same-age friends. Within the maltreated group, youth with a foster parent reported significantly more older friends than those living with a relative caregiver. Fewer maltreated youth named their biological parent as a social support than did comparison youth. More youth in kinship care said that their caregiver was supportive than did those in the foster care group. In considering the implications of poor social support, we then tested whether social support mediated the association between maltreatment and depressive symptoms in mid-adolescence (Negriff, Cederbaum, & Lee, Reference Negriff, Cederbaum and Lee2019). Using a path model with Time 1 and Time 2 depressive symptoms and family and friend social support, the results showed that a higher number of maltreatment victimizations predicted higher depressive symptoms at Time 1 and lower family support at Time 1. However, Time 1 depressive symptoms predicted lower family support at Time 2 (but T1 family support did not predict T2 depressive symptoms), indicating that features of depression may precipitate decline in family support rather than lack of family support leading to depression. Although depression has been found to lead to less social support, often because of depressive and avoidant behavior (Bell-Dolan, Reaven, & Peterson, Reference Bell-Dolan, Reaven and Peterson1993; Starr & Davila, Reference Starr and Davila2008), children who have been maltreated and who are consequently depressed are exactly the youth who need more social support, highlighting the importance of addressing this pathway in treatment approaches.
Given the recent integration of online social interaction into the lives of youth, we sought also to measure aspects of the online social networks/social support that may be relevant to offline functioning. Online social networks are ubiquitous among youth, and assessing their associations with offline behavior is necessary to advance developmental theory. At Time 5, we developed a Facebook application that downloaded the friend list and ties between the friends. This application enabled us to compute the structural characteristics of the network. We found that higher levels of depressive symptoms were associated with fewer friends, fewer ties between friends, and more components (distinct groups of friends; Negriff, Reference Negriff2019a). Given that these data were obtained during the advent and uptake of Facebook, they give us a picture of how mental health may affect the development of online friendships.
Overall, our results support the prevailing view that early life experiences in the family carry forward into interpersonal relationships and social support networks. Interestingly, our analyses demonstrate that mental health symptoms may contribute to the poorer social support networks found among youth with maltreatment histories (Negriff, Reference Negriff2019a; Negriff et al., Reference Negriff, Cederbaum and Lee2019). These findings highlight the need to address mental health symptoms and to provide interventions to help these youth learn necessary social skills that will allow them to create wider and healthier social support networks.
Mental Health
Understanding the relationship of maltreatment and mental health was an important focus of the YAP. When this study began, there was growing evidence that all types of maltreatment could cause psychological problems in developing youth. Because the research used mainly cross-sectional designs and lacked adequate comparison groups, it was difficult to disentangle the effects of maltreatment on mental health from the effects of living in difficult environments with high rates of poverty and community violence. Our carefully constituted comparison group allowed us to begin to make distinctions between the effects of maltreatment and the effects of disruptive environments.
We began by examining the mental health needs of a subsample of our total participants to understand how needs and services compared between maltreated and comparison youth (Mennen & Trickett, Reference Mennen and Trickett2007). More maltreated youth than comparison youth met the clinical cut-off point on at least one mental health symptom measure (e.g., depression, anxiety, externalizing problems, or psychological impairment), indicating the need for mental health services. Of those youth needing services, 62% percent in the maltreated group received services, whereas none in the comparison group did. Interestingly, only 51% of those above the clinically significant cut-offs received mental health services regardless of which group they were in. These findings indicate that there is a serious unmet need for mental health services among urban youth, but maltreated youth are more likely to receive services for those problems than are their nonmaltreated peers.
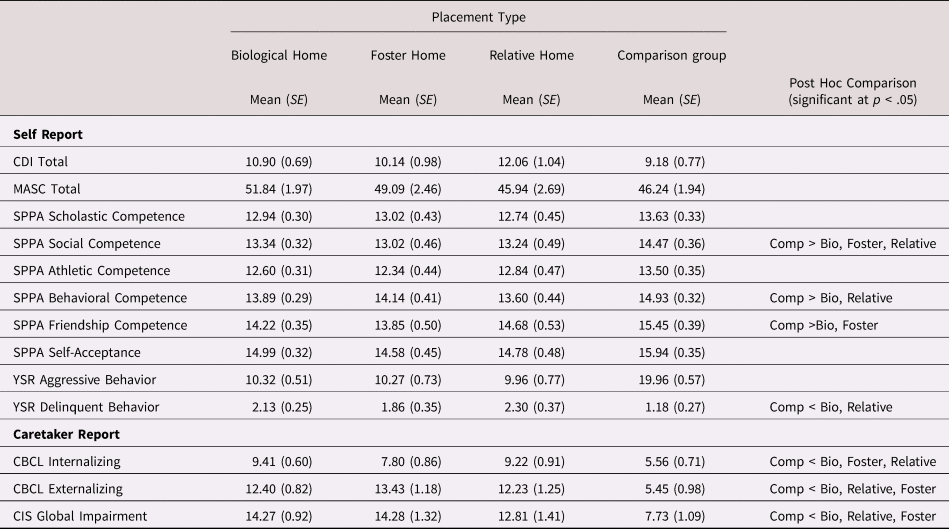
Given the importance of the home environment to youth, we examined psychosocial and mental health functioning with respect to placement type (i.e., biological home, nonrelative foster home, relative home, comparison group; Mennen, Brensilver, & Trickett, Reference Mennen, Brensilver and Trickett2010). Overall, the comparison group had better functioning than the maltreated youth—higher scores on competence measures, and lower scores on behavior problems—as shown in Table 5. However, those placed in foster care did not have poorer mental health than those who remained with their biological parents. Thus, it cannot be assumed that maltreated youth who remain at home have fewer psychological problems, a finding that has important implications for child welfare decisions about initiating foster placements and providing services to youth who are maltreated but not placed in foster care.
Results of MANCOVA for Time 1 functioning by placement type

Note: CDI = Children's Depression Inventory; MASC = Multidimentional Anxiety Scale for Children; SPPA = Self-Perception Profile for Adolescents; YSR = Youth Self-Report; CBCL = Child Behavior Checklist; CIS = Columbia Impairment Scale. Mean difference test using MANCOVA.
In an effort to untangle the relationship of maltreatment, community violence, and mental health, we examined community violence exposure in relation to mental health for maltreated versus comparison youth (Aisenberg, Garcia, Ayon, Trickett, & Mennen, Reference Aisenberg, Garcia, Ayon, Trickett and Mennen2008). Both maltreated and comparison youth reported substantial lifetime community violence exposure. No differences in exposure between the two groups emerged in our sample, suggesting that the groups were well matched on neighborhood characteristics. However, we found that maltreated adolescents had twice the rate of depressive symptoms and behavior problems as did comparison youth. Mediation analyses revealed that maltreatment accounted for more variance in behavior problems than community violence did, underscoring the detrimental effects of maltreatment beyond living in violent neighborhoods.
Parental mental health is another important potential influence on the mental health of maltreated youth. For instance the negative effect of maternal depression on children is well established (National Research Council, 2009) but not well studied in maltreating families. To articulate the relationships between maternal depression and characteristics of the child, we examined the longitudinal relationship of maternal depressive symptoms and children's mental health problems as well as the role of maltreatment and gender as moderators (Mennen, Negriff, Schneiderman, & Trickett, Reference Mennen, Negriff, Schneiderman and Trickett2018). Surprisingly, the experience of maltreatment did not worsen the effect of maternal depression on children's depression or externalizing problems overall. Maternal depressive symptoms predicted rule breaking only in the comparison group. Boys’ but not girls’ depression at T1 predicted maternal depression at T2. Maternal depressive symptoms at T2 predicted externalizing behaviors at T3 for girls but not for boys. Maternal depression and adolescent depression were related only from T2 to T3. These findings highlight the importance of including gender in the examination of the complex relationships between maltreatment and maternal depression. Our results were contrary to our expectations, but they yielded new insight into the associations between parent and child mental health.
We have begun to sort out some of the specific effects of maltreatment beyond living in high risk environments, with indications that maltreatment poses an extra risk factor for the development of mental health problems. However, these relationships are not straightforward and vary by gender. We will continue to explore these relationships and the factors that predict variability in outcomes, with particular interest in the trajectory of the symptoms as these youth move into adulthood.
Risk Behavior
The link between child maltreatment and risk behavior is well established (see Trickett, Negriff, Ji, & Peckins, Reference Trickett, Negriff, Ji and Peckins2011 for a review), and our work from the YAP study has extended the existing literature in several important ways. First, although consistent evidence demonstrates that child maltreatment leads to risky sexual behavior (Leslie et al., Reference Leslie, James, Monn, Kauten, Zhang and Aarons2010; Noll, Shenk, & Putnam, Reference Noll, Shenk and Putnam2009), few studies have examined that association by maltreatment type and fewer still test this association specifically among males. Overall, we found that maltreated youth were significantly younger at their first consensual intercourse and males were younger than females (Negriff, Schneiderman, & Trickett, Reference Negriff, Schneiderman and Trickett2015). Maltreated males reported a significantly higher number of lifetime sexual partners compared with maltreated females. Neglected, physically abused, and sexually abused youth were more likely to report a one-night stand than were comparison youth. Females with sexual abuse histories were at higher risk of having sex under the influence of alcohol or drugs than were nonmaltreated females. Interestingly, neglected females were at the highest risk of teen pregnancy compared with all of the other maltreatment types and the comparison group. Lastly, more maltreatment victimizations (more instances of maltreatment in child welfare case records) predicted younger age at first pregnancy.
Given the strong associations between maltreatment and sexual risk behavior, we also sought to delineate potential predictors and moderators of this risk. We were particularly interested in online contexts as a potential source of risk due to the proliferation of online social media among contemporary adolescents and young adults. To examine these online contexts, we examined how characteristics of Facebook networks such as size (number of friends) and density (how many friends are connected) predict offline high-risk sexual behavior (Negriff & Valente, Reference Negriff and Valente2018). The results showed that for maltreated youth, having a higher percent of isolates—friends who were not connected to others in the online network—predicted higher levels of intentional exposure to online sexual content and offline high-risk sexual behavior. We also examined predictors of substance use in online interactions and found that online-only friends potentially influence offline behavior. Specifically, having a higher number of online-only friends who were substance users was associated with higher substance use in our participants (Negriff, Reference Negriff2019b). Clearly, further examination of online contexts is integral to creating a more complete understanding of the various influences on risk behavior.
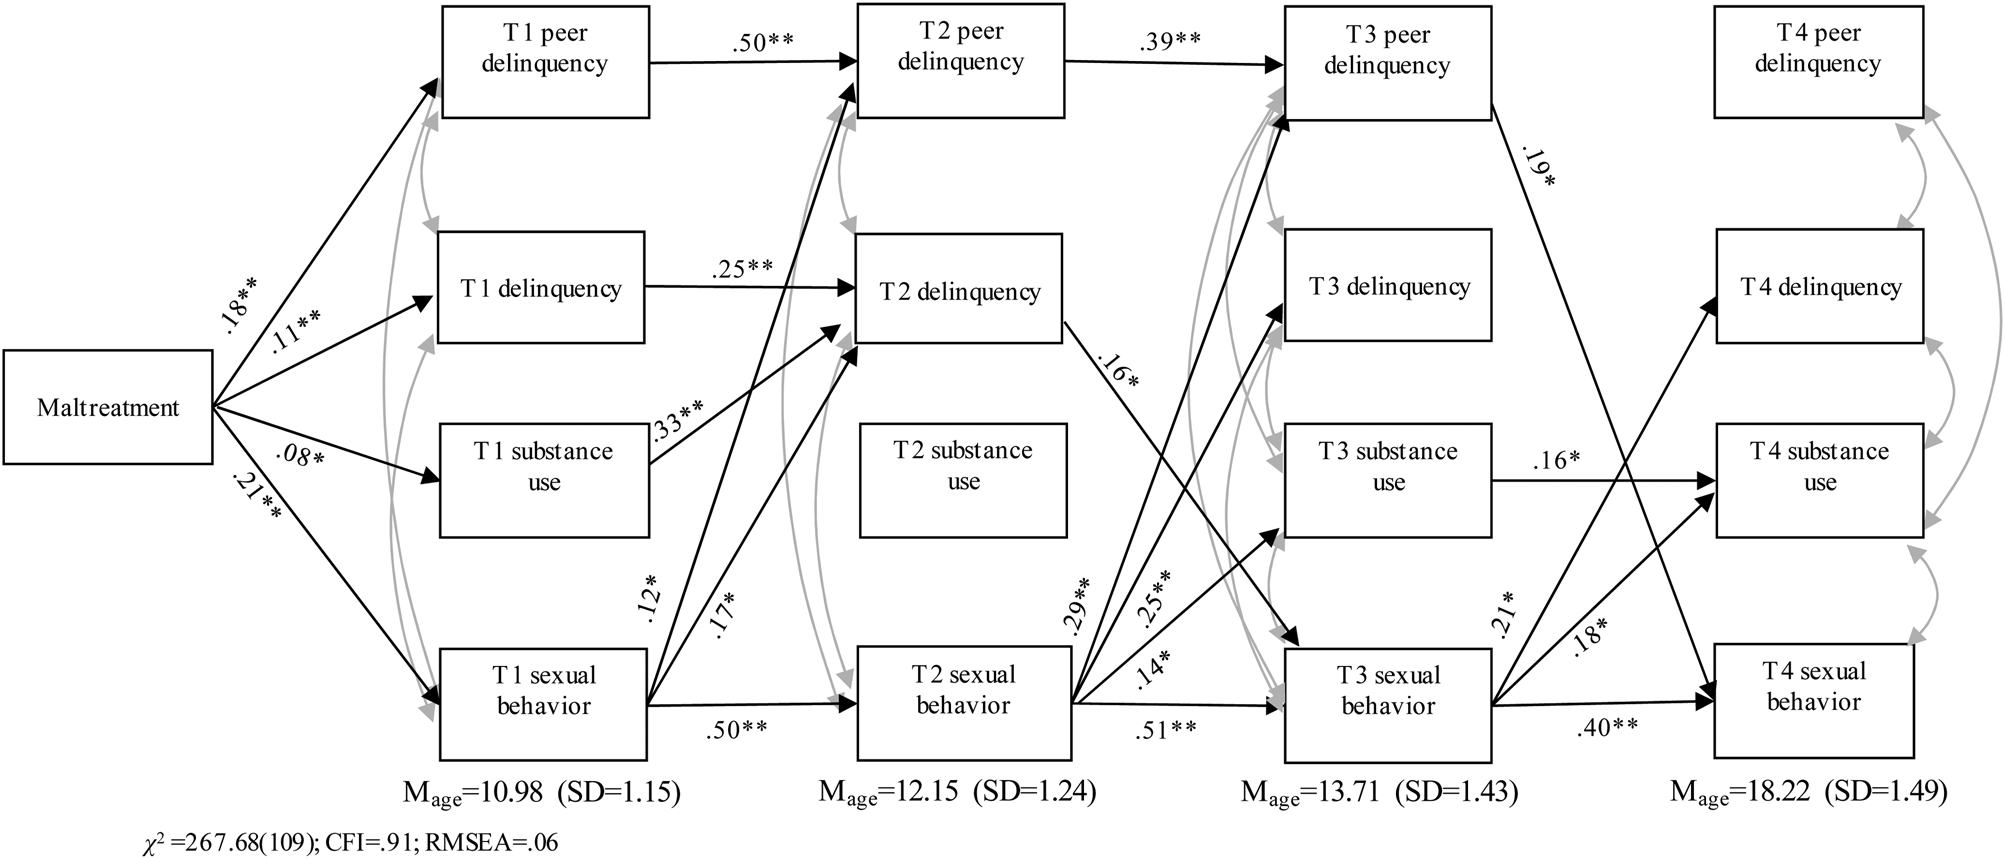
Building on our prior work, we developed a theoretical model to test the pathways from maltreatment to multiple risk behaviors (i.e., sexual activity, substance use, delinquency) across adolescence including the potential effects of peer influence (Negriff, Reference Negriff2018). Many studies have linked maltreatment with multiple risk behaviors, though none have tested the developmental pathways. This model was based on the supposition that adolescents may progress from more introductory forms of risk behavior (e.g., minor delinquency) to more advanced (e.g., substance use). The model showed that maltreatment victimization increased the likelihood of multiple risk behaviors, but sexual behavior (though not necessarily sexual intercourse) was the first in the sequence, with indirect effects on other risk behaviors across adolescence (Figure 3). The implication of these findings is that, although sexual behavior is not necessarily developmentally risky, when initiated too early it may be a catalyst for other risk behaviors.
Cascade model from maltreatment to sexual behavior, delinquency, peer deviance, and substance use.

Lastly, drawing from the evidence showing substantial residential instability among youth that are involved in child welfare (Fowler et al., Reference Fowler, Henry, Schoeny, Landsverk, Chavira and Taylor2013), we sought to examine whether household instability predicts risk behaviors in late adolescence. First, we examined predictors of the number of self-reported lifetime residences and whether more residences (housing instability) was related to delinquency and marijuana use. We found that maltreated adolescents who had lived with a nonparent caregiver at any point, or who were older, reported living in more residences during childhood and adolescence. Additionally, more residences and being male were associated with person offense delinquency and marijuana use (Schneiderman, Kennedy, Negriff, Jones, & Trickett, Reference Schneiderman, Kennedy, Negriff, Jones and Trickett2016). Our second analysis only included the maltreated sample and examined the relationship between unstable housing (e.g., being homeless, living in a car, or residing in a group home) and delinquency and marijuana use [Schniederman et al., Reference Schneiderman, Kennedy and Negriff2019]. Youth with more lifetime residences were more likely to experience unstable housing, although Latino youth (compared with White, Black, or multiethnic/biracial youth) were less likely to experience unstable housing. Additionally, unstable housing was associated with subsequent delinquency but not marijuana use.
Our work in this area bolsters the existing literature and provides additional evidence regarding the detrimental effects of child maltreatment on risky sexual behavior, delinquency, and substance use. This work also highlights the importance of gender and maltreatment type when trying to understand the development of risk behavior. The implications of these findings point to the need for intervention for youth with early sexual behavior because this behavior seems to progress to more serious risk behavior with potential long-term consequences. In addition, efforts should focus on the reduction of residential moves or unstable housing experiences. More support for social needs (e.g., rent assistance, food programs) among these families may help curtail some of the associated risk behaviors.
Physical Health
Researchers have spent considerable effort investigating the links between early trauma and physical health. Prominent theories, including the theory of Allostatic Load (McEwen & Seeman, Reference McEwen and Seeman1999, suggest the process of mounting a physiological response to stressors in the environment contributes to dysregulation of the stress response system, leading to wear and tear on the body and increased risk for physical disease. In line with this theory, evidence suggests that early maltreatment disrupts the stress response system (Bernard, Frost, Bennett, & Lindhiem, Reference Bernard, Frost, Bennett and Lindhiem2017; Bunea, Szentágotai-Tătar, & Miu, Reference Bunea, Szentágotai-Tătar and Miu2017; Tarullo & Gunnar, Reference Tarullo and Gunnar2006), which has ties to inflammation and implications for associated disease (Danese, Pariante, Caspi, Taylor, & Poulton, Reference Danese, Pariante, Caspi, Taylor and Poulton2007). Additionally, studies have shown that child abuse is related to having physical illnesses and obesity in adulthood (Afifi et al., Reference Afifi, MacMillan, Boyle, Cheung, Taillieu, Turner and Sareen2016), though support for this association is weaker in childhood (Danese & Tan, Reference Danese and Tan2014). Importantly, data from the YAP study has allowed us to analyze physical health problems that are associated with maltreatment, including profiles of physiological functioning that may influence risk (see psychophysiology section in this article), and compare them with physical health problems that are found in youth who live in the same low-income environments.
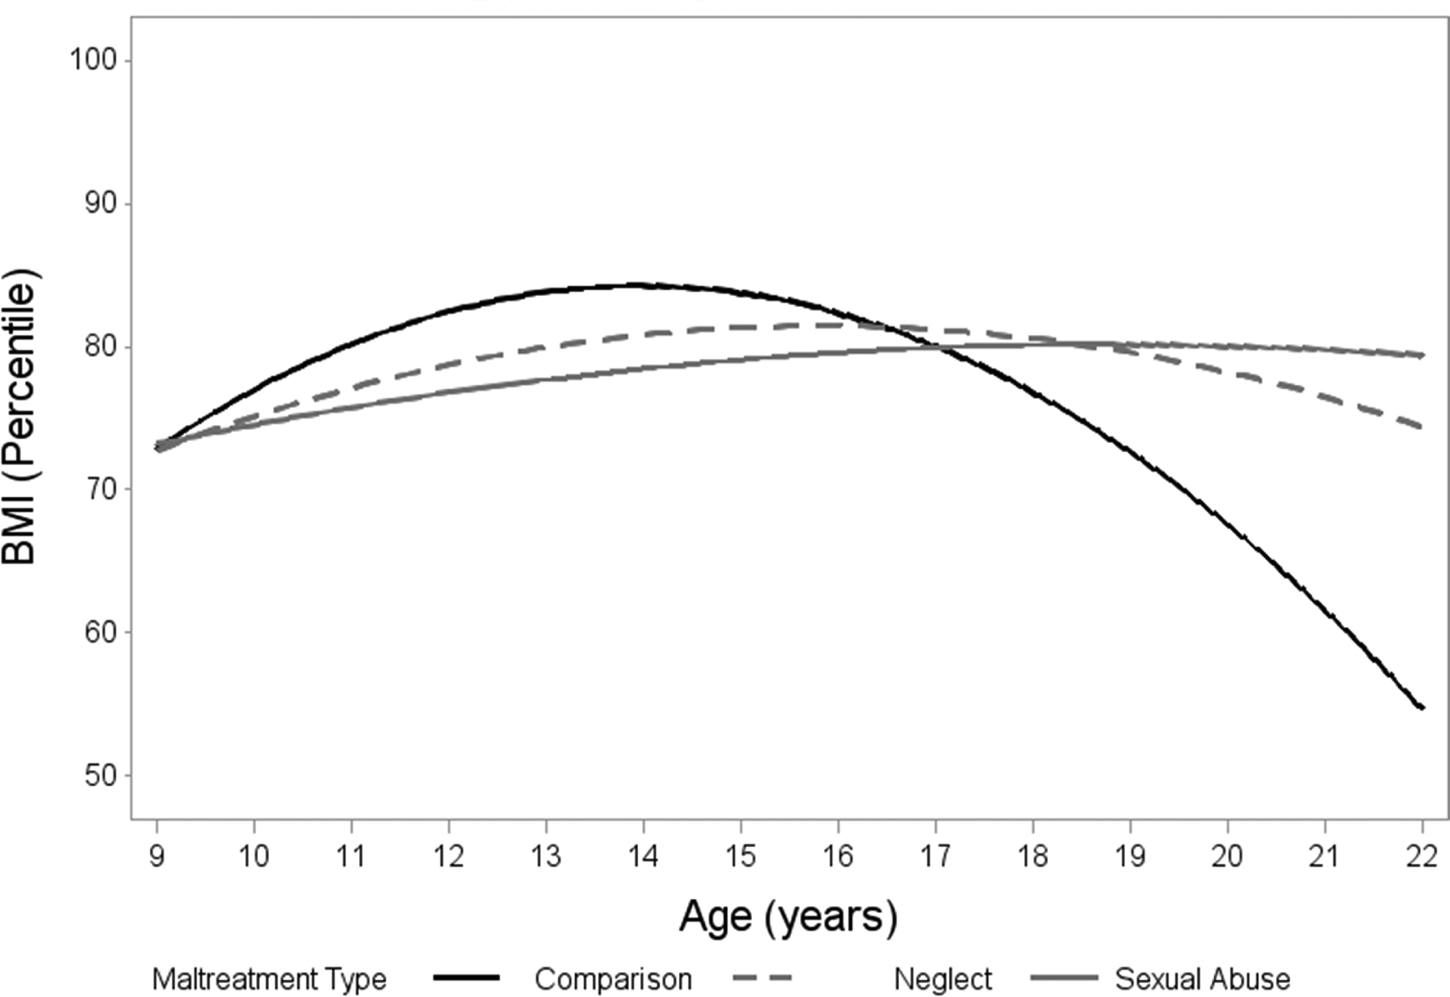
Obesity is one of the most prevalent physical health problems among youth (Hales, Carroll, Fryar, & Ogden, Reference Hales, Carroll, Fryar and Ogden2017), and early-life stress is implicated in its etiology (Incollingo Rodriguez et al., Reference Incollingo Rodriguez, Epel, White, Standen, Seckl and Tomiyama2015). We first examined risk for obesity at Time 1 and found that obesity prevalence was similar between the maltreated and comparison young adolescents (27.1% and 34.4%, respectively). Contrary to our expectations, we also found that comparison young adolescents were 1.7 times more likely to be overweight/obese than the maltreated young adolescents (95% CI = 1.13–2.76; Schneiderman, Mennen, Negriff, & Trickett, Reference Schneiderman, Mennen, Negriff and Trickett2012). Extending our obesity work to a longitudinal framework, we used data from four waves (Time 1 to Time 4) and estimated the growth trajectories for BMI percentile across adolescence by maltreatment type (Schneiderman, Negriff, Peckins, Mennen, & Trickett, Reference Schneiderman, Negriff, Peckins, Mennen and Trickett2015). The results showed that the growth trajectories of sexually abused girls and neglected girls were significantly different from those of comparison girls (Figure 4). Sexually abused girls and neglected girls had lower BMI than did comparison girls until age 16–17 years, when their BMI increased above that of the comparison girls. In contrast, the comparison girls had a growth trajectory that reached its apex at 15 years and then began to decline. There were no differences in the growth trajectories for boys. We followed up on these analyses with a third obesity study that tested whether the association between maltreatment type and BMI percentile growth trajectories across adolescence (Time 1–4) was conditional on the hypothalamic-pituitary-adrenal (HPA) axis response to stress at Time 1 (Peckins, Negriff, Schneiderman, Gordis, & Susman, Reference Peckins, Negriff, Schneiderman, Gordis and Susmanin press). We found a moderating effect for HPA-axis reactivity in girls but not boys. Specifically, at low levels of cortisol reactivity, sexually abused girls increased in BMI at a steeper rate across adolescence than did physically abused and comparison girls. At high levels of cortisol reactivity, sexually abused girls, physically abused girls, and comparison girls did not differ in their BMI trajectories across adolescence, suggesting that low cortisol levels may be a risk profile for sexually abused girls.
BMI percentile trajectories (females) for the comparison group, neglect group, and sexual abuse group (quadratic effect).

Maltreatment is also associated with a range of adverse physical health outcomes and behaviors that increase risk for such outcomes (MacMillan, Reference MacMillan2010). Pediatric providers recognize the need to identify and treat these numerous medical health issues along with the immediate treatment of the effects of maltreatment on youth. Using Time 2 data, we compared caregiver-reported adolescent health problems and health use between maltreated and comparison adolescents (Schneiderman, Kools, Negriff, Smith, & Trickett, Reference Schneiderman, Kools, Negriff, Smith and Trickett2015). Caregivers reported similar rates of physical health problems but more mental health problems and psychotropic medicine use in maltreated youth than in the comparison youth. Although the groups did not differ with respect to health insurance coverage, maltreated youth received preventive medical care more often than did comparison youth. Across both groups, having Medicaid improved their odds of receiving preventive health and dental care. We also examined Time 4 health data by using adolescents’ self-reports of health-related variables (Schneiderman, Negriff, & Trickett, Reference Schneiderman, Negriff and Trickett2016). Comparison adolescents reported more cold and pain symptoms during the previous 30 days than did maltreated youth, but there were no differences in other physical health problems, self-assessment of their physical and mental health, or health care use compared with maltreated adolescents. Girls reported more dental check-ups and more use of psychological counseling than did boys, and girls more often identified their physical health as being poor than did boys.
Sleep is an often overlooked yet integral part of health. Recent evidence demonstrates the importance of sleep to adolescents’ physical and psychosocial health (Shochat, Cohen-Zion, & Tzischinsky, Reference Shochat, Cohen-Zion and Tzischinsky2014), though the associations are likely bidirectional (Charuvastra & Cloitre, Reference Charuvastra and Cloitre2009; Gregory & Sadeh, Reference Gregory and Sadeh2012; Noll, Trickett, Susman, & Putnam, Reference Noll, Trickett, Susman and Putnam2006). To clarify this link, we tested associations between sleep problems and mental health symptoms by the gender of the adolescents (Schneiderman, Ji, Mennen, & Negriff, Reference Schneiderman, Ji, Mennen and Negriff2018). Using a cross-lagged approach with data from Time 3 and 4, we found reciprocal relationships between depressive and PTSD symptoms and sleep disturbances only for females. Specifically, PTSD and depressive symptoms at T3 predicted sleep disturbances at T4 and sleep disturbances at T3 similarly predicted PTSD and depressive symptoms at T4. Symptoms of PTSD at T3 predicted shorter sleep duration at T4 only among females. Surprisingly, maltreatment status had no effect on mental health symptoms or sleep disturbance, but maltreated adolescents reported longer sleep duration at T4 than did comparison adolescents.
Our studies illustrate that not all maltreated youth experience physical health problems, but some have physical health outcomes that are worse than those of their comparable low-income peers. Maximizing good health is important because maltreated youth who have similar medical problems as other low-income youth are more likely to be hospitalized for those problems (Lanier, Jonson-Reid, Stahlschmidt, Drake, & Constatino, Reference Lanier, Jonson-Reid, Stahlschmidt, Drake and Constatino2009). Importantly, gender was also shown to be an important factor when examining links between maltreatment and physical health. Overall, these findings suggest that the physical effects of early maltreatment may not necessarily be apparent proximal to the experience, but longitudinal data may illuminate their full effect on physical health. Clearly, researchers should seek to distinguish the physical health problems that are evident during different developmental periods because that will help guide physicians in treating individuals with early life trauma.
Psychobiology
A substantial amount of research focuses on how childhood maltreatment “gets under the skin” to affect physiological processes across multiple systems, including the two arms of the stress response system (reviewed in Koss & Gunnar, Reference Koss and Gunnar2018; Trickett, Noll, & Putnam, Reference Trickett, Noll and Putnam2011). Theory suggests that changes in physiological functioning in response to maltreatment are adaptive in the short-term, yet they come at a cost, having long-term consequences for health and behavior (Koss & Gunnar, Reference Koss and Gunnar2018). Our publications on this topic, which examine autonomic nervous system (ANS) activity and HPA-axis activity, support existing theory and suggest that physiological stress reactivity may be a psychobiological mechanism through which maltreatment affects health and behavior. For example, Gordis et al. (Reference Gordis, Feres, Olezeski, Rabkin and Trickett2009) examined the effect of sympathetic and parasympathetic activation via skin conductance level (SCL) and respiratory sinus arrhythmia (RSA), respectively, in the link between maltreatment and aggressive behavior. We found that among boys, high RSA may be protective against the effects of maltreatment on aggressive behavior. Among girls, the moderating effect of RSA was further moderated by SCL reactivity such that low levels of both baseline RSA and SCL reactivity, or conversely high levels of both baseline RSA and SCL reactivity, exacerbated the link between maltreatment and aggression.
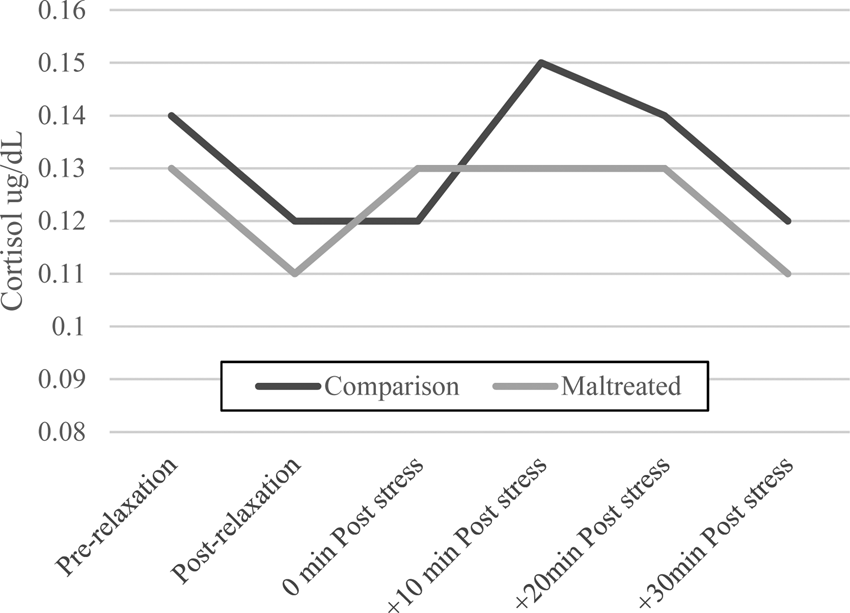
Our analyses published from the YAP sample also suggest that childhood maltreatment affects adolescents’ cortisol response to stress, the primary byproduct of HPA-axis activation. Trickett et al. (Reference Trickett, Gordis, Peckins and Susman2014) examined the effects of maltreatment on adolescents’ salivary cortisol in response to the Trier Social Stress Test for children (TSST-C; Buske-Kirschbaum et al., Reference Buske-Kirschbaum, Jobst, Psych, Wustmans and Kirschbaum1997). We found that maltreated adolescents showed a blunted or attenuated cortisol response to the stressor compared with individuals in the comparison group (Figure 5). This attenuated response was especially pronounced for those whose maltreatment included physical and/or sexual abuse (See Susman, Reference Susman2006 for a discussion of the attenuation hypothesis). A main effect for gender was also found, with boys having higher cortisol levels than girls. Extending our research on the reactivity of the HPA axis, Peckins et al. (Reference Peckins, Susman, Negriff, Noll and Trickett2015) examined cortisol reactivity for 3 waves (T2–T4) using latent class analysis. The results showed three cortisol reactivity profiles at each wave: blunted, moderate, and elevated. Maltreated adolescents were more likely than comparison adolescents to belong to the blunted profile at the first two waves, even after accounting for recent exposures to violence and traumatic experiences. However, by T4, maltreated and comparison adolescents no longer differed in their likelihood of profile membership, demonstrating that there may be a return to normative functioning for some maltreated youth.
Mean differences in cortisol reactivity for maltreated versus comparison groups at Time 1.

While we have shown that maltreatment is associated with cortisol, we also examined the stress response across both the HPA axis and the sympathetic nervous system (SNS) as measured by salivary alpha amylase (sAA) in response to the TSST-C. This multisystem approach allowed us to examine whether maltreatment contributed to asymmetry of the stress response system, a proposed risk factor for health and behavior problems (Bauer, Quas, & Boyce, Reference Bauer, Quas and Boyce2002). Gordis et al. (Reference Gordis, Granger, Susman and Trickett2006) found that in our sample, regardless of maltreatment status, the interaction between cortisol and sAA accounted for aggression such that low cortisol predicted aggression only at lower levels of sAA. Gordis et al. (Reference Gordis, Granger, Susman and Trickett2008) also examined cortisol-sAA asymmetry among maltreated and comparison youth and found that among comparison youth, cortisol and sAA response covaried but in maltreated youth they did not.
Taken together, the results of these studies suggest that maltreatment has a profound effect on the developing psychobiological systems of maltreated youth. Moreover, the influence of maltreatment on the reactivity of psychobiological systems extends beyond the effects of other forms of early-life adversity, including violence exposure. Importantly, this body of research highlights the need for a multisystem approach, as the effects of maltreatment on the neuroendocrine response to stress may not be the same for different axes of the stress response system. The implications for trajectories of mental and physical health are concerning, and they highlight the need to follow these youth to determine long-term outcomes.
Pubertal Development
Another important implication of dysregulation of the stress system pertains to the early initiation of pubertal development. Drs. Trickett and Putnam were among the first researchers to hypothesize links between maltreatment and the physiological systems that are linked with early pubertal development. Their original theory, which was published in Psychological Science (Trickett & Putnam, Reference Trickett and Putnam1993), was specific to sexual abuse, but in her proposal for the YAP study, Dr. Trickett expanded this original theory to encompass other forms of maltreatment that may alter the stress system. More specifically, Trickett and Putnam (Reference Trickett and Putnam1993) posited that early trauma sets in motion a series of psychobiological events via the HPA and HPG axes, consequently altering the normative hormonal milieu and subsequent pubertal development.
In line with the theoretical model set out by Dr. Trickett, data from the YAP study have supported these proposed links between maltreatment, puberty, and psychosocial functioning. We have published papers showing the effects of different maltreatment types on pubertal development, the effect of cortisol on pubertal tempo (i.e., the pace of pubertal development), and the effects of early puberty on subsequent psychosocial functioning. While several of our papers have supported an association between early pubertal timing and depression and delinquency (Negriff, Fung, & Trickett, Reference Negriff, Fung and Trickett2008; Negriff & Trickett, Reference Negriff and Trickett2010), we have also sought to uncover the specific mechanisms through which early puberty confers negative effects. First, we tested peer delinquency as a mediator between early puberty and delinquency (Negriff, Ji, & Trickett, Reference Negriff, Ji and Trickett2011). The results showed that exposure to peer delinquency fully mediated the relationship between early pubertal timing and delinquency, but only for comparison adolescents. There was a direct effect of pubertal timing on delinquency among maltreated adolescents. Similarly, a separate analysis examined substance use and found that peer substance use mediated the association between early pubertal timing and later substance use, but only for comparison youth (Negriff & Trickett, Reference Negriff and Trickett2012). Subsequently, we tested a model where sexual activity and risky peers were competing mediators and found that the link between early puberty and delinquency was mediated by sexual activity, not by peers (Negriff, Susman, & Trickett, Reference Negriff, Susman and Trickett2011). In a follow-up analysis we found that early pubertal timing was associated with substance-using peers only for maltreated adolescents, indicating that the mediation path from early pubertal timing through substance-using peers to subsequent adolescent substance use and sexual behavior only holds for maltreated adolescents. However, mediation via sexual behavior was significant for both maltreated and comparison adolescents. Overall, these analyses indicate that the expected mechanisms may not necessarily hold for adolescents who have had traumatic experiences such as maltreatment, so we need further work to identify how maltreatment alters the expected developmental pathways.
As mentioned above, we also investigated associations between maltreatment types and the timing and tempo of puberty (Negriff, Blankson, & Trickett, Reference Negriff, Blankson and Trickett2015). Using latent growth curve analysis, we found that boys who had experienced neglect had a slower initial tempo that increased later in adolescence. We also used a person-centered approach, finding a 2-class solution for girls that differentiated early versus later pubertal timing. Additionally, sexual abuse was associated with membership in the earlier pubertal timing class. While this supports the initial theory of the effects of stress on physiological systems, we more directly tested this pathway by examining the links between cortisol reactivity at Time 1 and pubertal tempo between Time 1 and Time 2 (Saxbe, Negriff, Susman, & Trickett, Reference Saxbe, Negriff, Susman and Trickett2015). We found that for girls (but not for boys), a lower cortisol area under the curve (with respect to ground) at Time 1 predicted more advanced pubertal development at Time 2, controlling for Time 1 pubertal development. This association persisted after additional covariates including age, body mass index, race, and maltreatment history were introduced, and it was stronger for adrenal rather than gonadal secondary sex characteristics. No interaction by gender or by maltreatment appeared. Overall this demonstrates that downregulation of the HPA axis, which acts as a hormonal brake for the HPG axis (Chrousos & Gold, Reference Chrousos and Gold1992), may drive accelerated pubertal development. Building on this finding, we then investigated a longitudinal biopsychosocial model that links maltreatment to cortisol reactivity at Time 1, accelerated pubertal development at Time 2, and depressive symptoms, substance use, and delinquency at Times 3 and 4 (Negriff, Saxbe, & Trickett, Reference Negriff, Saxbe and Trickett2015). We ran models separately for males and females and showed that for females, maltreatment was not linked with lower cortisol reactivity, but lower cortisol was associated with accelerated pubertal development, which, in turn, predicted subsequent delinquency and substance use. For males, maltreatment was linked with blunted cortisol reactivity, but it did not have direct effects on puberty or any of the other outcomes. However, advanced pubertal development did predict higher delinquency at Time 3 for males.
Taken together these studies demonstrate that certain types of maltreatment are linked with the timing and tempo of puberty based on gender and that differences in the timing of puberty have both acute and prolonged effects on development throughout adolescence. Importantly, the findings also demonstrate that the differences in expected developmental pathways vary by maltreatment status. These studies on puberty have advanced our understanding of the common and unique pathways from early puberty to risk behavior in adolescence for maltreated and nonmaltreated youth.
Discussion
It has been nearly 20 years since the YAP began and we have acquired a great deal of knowledge about the effects of abuse and neglect on a variety of domains. However, there is still much left to learn. Importantly, the rigor of the study design has allowed us to draw much stronger inferences about the specific effects of maltreatment than have many prior studies. The YAP is particularly well-suited for isolating the specific effects of maltreatment from other aspects of adversity in childhood. The careful selection of maltreated and comparison groups from similar neighborhoods of origin enables us to control for a number of additional aspects of disadvantage that can influence developmental outcomes, such as neighborhood poverty, environmental toxin exposure, and community violence. The use of official records to abstract detailed information about maltreatment experiences is also an important strength and has led to a much more nuanced understanding of the variability in experiences among youth in contact with the child welfare system. We believe the contributions of this study, thus far, are an enormous boon to maltreatment research and that the YAP can serve as blueprint for future studies.
There are a few key contributions from our summary that should be highlighted. First, the findings from this study reinforce the reality that maltreatment is not simple to assess and the complexities of these experiences are not easily captured. While many studies use retrospective reports of maltreatment experiences assessed with a single item, we found that the variability even within a single maltreatment type was astonishing. One example of this variability comes from our physical abuse publication (Stevens et al., Reference Stevens, Schneiderman, Negriff, Brinkman and Trickett2015). We found that one participant had their first report to DCFS at age 4 and had 12 more reports detailing 23 separate instances of maltreatment between age 4 and their enrollment in the study at age 10. Contrast this with another participant whose first and only report was at age 9, though the report described two types of abuse. A number of questions arise from this example: are the effects of being physically abused the same for both of these participants? Do we label both children as physically abused and leave it at that? How do we operationalize these nuances? Our work on person-centered clusters of maltreatment experiences may be one way to capture differential outcomes (Trickett, Kim, et al., Reference Trickett, Kim and Prindle2011), whereas a more qualitative approach may be justified as well. The Dimensional Model of Adversity and Psychopathology classifies all early adversities into two dimensions, threat (e.g., physical abuse, domestic violence) and deprivation (e.g., neglect; McLaughlin & Sheridan, Reference McLaughlin and Sheridan2016). Although this is a potential strategy for delineating the unique effects of different types of adverse experiences, challenges remain regarding the measurement of the multiple domains of maltreatment, the combination of experiences that fall into the same domain, and the operationalization of the nuances of adverse experiences. Other researchers have taken a polyvictimization approach (Finkelhor, Ormrod, Turner, & Hamby, Reference Finkelhor, Ormrod and Turner2005; Finkelhor, Ormrod, & Turner, Reference Finkelhor, Ormrod, Turner and Hamby2007), given the strong evidence that a single type of victimization is rare (Outlaw, Ruback, & Britt, Reference Outlaw, Ruback and Britt2002). Dovetailing with our work, it is clear that experiencing just one type of maltreatment is uncommon. The potential co-occurrence as well as the chronicity of maltreatment experiences needs strong consideration when attempting to determine the effects of maltreatment on development. In addition, the high co-occurrence of multiple types of child maltreatment has important implications for treatment. Interdisciplinary treatment approaches are essential but are not yet universal. These strategies should be encouraged by protective service agencies at the discovery stage so as not to overlook hard to identify symptoms and syndromes such as in the case of inattention and hyperactivity. An interdisciplinary approach is especially crucial in the cases of physical and mental health, as health problems in both domains have been identified among participants in the YAP study and others.
Second, the significance of the findings from the YAP on our understanding of psychobiological development has been particularly pivotal. Foremost, the findings that cortisol reactivity appears to be blunted in youth with maltreatment solidify this result in the field. While there have been equivocal results regarding different aspects of HPA-axis functioning (e.g., cortisol awakening, diurnal cortisol; Bernard et al., Reference Bernard, Frost, Bennett and Lindhiem2017), it is fairly clear that early maltreatment is linked with downregulation of the HPA axis as reflected by blunted cortisol reactivity in adolescence (Bunea et al., Reference Bunea, Szentágotai-Tătar and Miu2017). The effect on physiological systems goes beyond cortisol; the HPA and HPG axes are primarily responsible for the cascade of hormones that triggers the onset and progression of puberty. The implication of early stress on pubertal development had been examined in previous studies that were unable to draw inferences about the actual temporal associations. However, in our study we were able to show that sexual abuse in girls predicted earlier timing and faster tempo of puberty, whereas in boys neglect was associated with later timing. This dovetails with work from Dr. Trickett's study on sexual abuse in females showing that girls with sexual abuse enter puberty nearly one year earlier than nonabused girls (Noll et al., Reference Noll, Trickett, Long, Negriff, Susman, Shalev and Putnam2017). In addition, we have found that sexual abuse is a unique and deleterious predictor of many different outcomes, including sexual risk behavior, early pregnancy, and obesity among others. This and other work demonstrates that sexual abuse is substantively different from other types of victimization and should always be considered a distinct risk factor. The implications of sexual abuse intervention need to be considered differently given the vast array of serious problems associated with sexual abuse. Child welfare personnel, teachers, and caregivers need to receive intensive education on the severity and vast array of potential outcomes of sexual abuse to effectively mitigate the multidomain consequences.
Third, the YAP study findings show that the physical health of maltreated youth is generally not worse than that of youth in the comparison group. This is unexpected because other studies have shown that maltreated youth suffer from more physical health problems such as chronic diseases, worse self-reported health, and need for acute care for health problems (Annerbäck, Sahlqvist, Svedin, Wingren, & Gustafsson, Reference Annerbäck, Sahlqvist, Svedin, Wingren and Gustafsson2012; Lanier et al., Reference Lanier, Jonson-Reid, Stahlschmidt, Drake and Constatino2009; Stein et al., Reference Stein, Hurlburt, Heneghan, Zhang, Rolls-Reutz, Silver and Horwitz2013). Although some of these studies used low-income children as a comparison (for example, Lanier et al., Reference Lanier, Jonson-Reid, Stahlschmidt, Drake and Constatino2009), most lacked a comparison group that had experienced similar physical environmental factors that may affect health. Our careful recruitment strategy may have controlled for the environmental risks that contribute to disparities in health for maltreated youth. These findings reinforce the profound effect of the physical and social environment, especially in low-income neighborhoods, on physical health in youth (Franzini, Caughy, Spears, & Esquer, Reference Franzini, Caughy, Spears and Esquer2005). We also may not have observed group differences because the effects of chronic stress will be more evident as our samples ages and the effects on allostatic load become more pronounced with time. While physical health did not differ between the groups, maltreated youth reported more mental health problems than did youth in the comparison group, which has implications for their long-term physical health. For example, studies have shown that depression increases risk for coronary heart disease (Rugulies, Reference Rugulies2002). Therefore, addressing mental health in adolescence will affect physical health across the lifespan.
Limitations
As with any study there are inherent gaps that we cannot fill. While extraordinarily comprehensive in the breath of data that we collected (see Tables 2 and 3), the YAP does not cover all of the possible outcomes and the measurement of physical health outcomes in particular are lacking. Our measures of physiological functioning are limited to cortisol, sAA, and peripheral psychophysiological measures of skin conductance and respiratory sinus arrhythmia. Given the evidence linking early stress with changes across physiological systems, it would have been beneficial to be able to have additional biomarkers that would give us a better understanding of disease processes. It is also important to note that although this study design allows stronger causal inference than cross-sectional or retrospective studies, only true randomized control designs can hold up to causal conclusions. However, we can never randomly assign children to be maltreated or not, so this type of design is currently the gold standard to use for inferring temporal associations. It also allows us to test developmental questions and pinpoint periods of vulnerability for certain outcomes. This study also has limitations with respect to the family factors that contribute to maltreatment and outcomes. Because nearly half of our maltreated group did not reside with their biological parent, we were only able to obtain limited information about the child's birth family. Future studies should attempt to enroll maltreated birth parent(s) of all maltreated youth, even if the youth do not live with their birth parents. This would allow researchers to collect physical, physiological, and psychological data that could potentially help us better understand proximal and long-term outcomes of the youth. Also, more detailed data describing the specific type of out-of-home care, in terms of differences in formal or informal foster care (kin care), could provide more context on whether the provision of child welfare resources might affect a maltreated child's development. Lastly, we must be transparent about the likelihood of unreported maltreatment in both the maltreated and comparison groups. While we coded the maltreatment experiences that were available in DCFS case records, there may have been additional maltreatment that never came to the attention of child welfare. This caveat also applies to the comparison group. Although we confirmed with the caregiver that the child had never been involved with child welfare, there may have been maltreatment experiences that were never reported to the DCFS. There also may have been maltreatment experiences for both groups that occurred outside of Los Angeles County, so they were not abstracted as part of our study.
Future Directions
As with Dr. Trickett's study on the effects of sexual abuse in females that has continued for over 30 years (Trickett, Noll, et al., Reference Trickett, Noll and Putnam2011), our hope is to follow this cohort into adulthood to provide data on the long-term effects of maltreatment. The participants are entering adulthood, another developmental transition when we may see critical successes or failures in the achievement of adult roles. Our ability to delineate pathways from psychosocial and psychobiological functioning in adolescence to outcomes in young adulthood will be of considerable benefit to the field. In addition, including the offspring of our original study participants will answer important questions about the intergenerational effects of maltreatment. Lastly, our continued follow-up will enable us to study potential protective factors among maltreated participants who demonstrate positive outcomes. We are conducting a qualitative study with a subset of maltreated youth who showed good functioning in late adolescence. Our goal is to discern their perspectives on the protective factors that enhanced their resilience. As perceptions of early experiences are important predictors of trauma symptoms and later functioning, the insight from these youth, now young adults, will help move us toward identifying targets for intervention to cultivate resilience and positive adaptation after early trauma.
Conclusions
The findings from the Young Adolescent Project have made significant contributions to our understanding of maltreatment experiences and the effects on adolescent development. The focus on adolescence helps to reveal the effects of these experiences at a particularly vulnerable time of life. Many of our findings paint a rather dismal picture of the lives of these youth; however, we have also found a few points of hope. We have found that 70% of our maltreated participants showed good functioning in late adolescence/young adulthood (as indicated by graduating high school, having social support, and no/low mental health symptoms or substance abuse). Our findings also indicate that youth that live in foster care versus those that live with their biological parent have similar mental health functioning, allowing some optimism for those who have been placed in foster care. Overall, the YAP study has advanced our understanding of maltreatment in a myriad of ways and provided a blueprint for rigorous study design. The multidomain assessment in the YAP study demonstrates the far-reaching effects of maltreatment and the interconnections between domains, highlighting the need to develop more complex biopsychosocial models in order to fully understand the multiple pathways from maltreatment to outcomes and treatment approaches to address the multisystem effects.
Acknowledgments
Foremost we recognize our brilliant leader Dr. Penelope Trickett, who was the principal investigator and grant recipient for the study. Her vision and the lessons that she learned from years of experience studying maltreated youth guided this seminal study. Dr. Trickett left an important legacy after her death in 2016. We also thank Dr. John Horn, who was integral to the rigorous study design and statistical analyses until his death in 2006. This study would not have been possible without the many research staff, undergraduates, and graduate students who contributed to recruitment, scheduling, and data collection: Eugene Aisenberg, Irving Argaez, Nayena Blankson, Matthew Brensilver, Tina Bryson, Yolanda Cespedes, Mariella Cordero, Lorena Duran, Nashla Feres, Alejandro Fernandez, Julia Hernandez, Adam James, Juye Ji, Dawn Kurtz, Fatima Morales, Cara Pohle, John Prindle, Irma Romero, Jina Sang, Kristopher Stevens, Dolores Villanueva, Michelle Yeh, and our many, many undergraduate research assistants over the years.
Financial Support
This study was funded by National Institutes of Health Grants R01HD39129 and R01DA024569 (to P.K. Trickett., Principal Investigator), K23HD041428 and R03HD56060 (to E.B. Gordis, Principal Investigator), and K01HD069457 (to S.N., Principal Investigator).
University of Southern California Urban Fellow Faculty seed grant (To E.B. Gordis, Principal Investigator).
An Alcoholic Beverage Medical Research Foundation Research Grant also supported this research (To E.B. Gordis, Principal Investigator).