


Introduction
Bovine respiratory disease (BRD) affects dairy and beef cattle of all ages. Its most common clinical presentation in beef calves is referred to as shipping fever, while in dairy calves it is referred to as enzootic pneumonia (Callan and Garry, Reference Callan and Garry2002). The multifactorial nature of BRD challenges the US dairy industry with tremendous negative impacts on calf health and welfare before and after weaning. A marginal cost-benefit analysis estimated the average short-term cost of BRD in preweaned dairy calves at $42 per case (Dubrovsky et al., Reference Dubrovsky, Van Eenennaam, Aly, Karle, Rossitto, Overton, Lehenbauer and Fadel2020). Moreover, US surveillance data show no improvement in BRD morbidity in preweaned dairy calves since 1991 (USDA, 1993, 2012).
In the USA, 24% of the preweaned and 59% of postweaning heifer mortality, respectively, are attributed to BRD, making it the second most common cause of preweaned calf mortality and the top mortality cause in postweaned calves (USDA 2018). Prevalence estimates of BRD on US dairies show that it affects 12% and 5.1% of preweaned and weaned heifers, respectively, and extends as high as 37% in a study of preweaned dairy calves on California (CA) dairies (Karle et al., Reference Karle, Maier, Love, Dubrovsky, Williams, Anderson, Van Eenennaam, Lehenbauer and Aly2019; Maier et al., Reference Maier, Love, Karle, Dubrovsky, Williams, Champagne, Anderson, Rowe, Lehenbauer, Van Eenennaam and Aly2019; USDA, 2018). In addition, the 2014 NAHMS dairy study reported that respiratory issues accounted for 33.4% of all calf illnesses (Urie et al., Reference Urie, Lombard, Shivley, Kopral, Adams, Earleywine, Olson and Garry2018). Despite advances in our understanding of genetic predisposition to BRD (Neibergs et al., Reference Neibergs, Seabury, Wojtowicz, Wang, Scraggs, Kiser, Neupane, Womack, Van Eenennaam, Hagevoort, Lehenbauer, Aly, Davis and Taylor2014, Quick et al., Reference Quick, Ollivett, Kirkpatrick and Weigel2020) and effective vaccines and drugs, BRD incidence has not decreased over the last 20 years (Fulton, Reference Fulton2009; McVey, Reference McVey2009).
Several pathogens are involved in BRD causation, including viruses such as bovine respiratory syncytial virus, bovine herpes virus 1, bovine viral diarrhea virus, and bovine coronavirus (Love et al., Reference Love, Lehenbauer, Kass, Van Eenennaam and Aly2014, Reference Love, Lehenbauer, Van Eenennaam, Drake, Kass, Farver and Aly2016a). Bacteria commonly associated with BRD are Mannheimia haemolytica, Pasteurella multocida, Mycoplasma bovis, Histophilus somni, Bibersteinia trehalosi, and Arcanobacterium pyogenes (Hodgson et al., Reference Hodgson, Aich, Manuja, Hokamp, Roche, Brinkman, Potter, Babiuk and Griebel2005; Fulton, Reference Fulton2009; Lehenbauer et al., Reference Lehenbauer, Aly, Davis, Blanchard, Crossley, Rossitto, Neibergs and Van Eenennaam2013). Contributing to BRD's difficult control and prevention is its complex etiology including the interplay between primary pathogens and commensals, and host and environmental factors (Ackermann et al., Reference Ackermann, Derscheid and Roth2010; Gorden and Plummer, Reference Gorden and Plummer2010). Among the host-related risk factors for BRD are genetic susceptibility, inadequate transfer of passive immunity, calves' developing immune system, and nutritional status. Incidence of BRD increases during the periods of extreme weather and temperature changes (Louie et al., Reference Louie, Rowe, Love, Lehenbauer and Aly2018). The complex causation of BRD further contributes to the challenge of identifying herd-specific interventions required to prevent or control BRD.
Management practices on dairies can be used to limit or modify calf exposure to all three classes of risk factors: pathogen, host, and environmental risk factors. As a result, prevention and control of BRD is primarily achieved through on-farm management changes implemented to reduce the risk of BRD (USDA, 2018). Furthermore, BRD risk factors can be classified into more logical intervention themes, such as colostrum management, housing, and vaccination, among others that contribute to a herd's overall BRD risk. A practical approach to developing control and prevention plans for BRD based on management interventions must allow for a comprehensive assessment of all known risk factors and a herd-specific plan. Hence, to control and prevent BRD and reduce its negative impact in a dairy herd, a producer and herd veterinarian must be aware of all the risk factors associated with BRD that are specific to their dairy. Innovative strategies are required to provide veterinary clinicians and dairy producers with herd specific, simple and functional tools that integrate the results of research on the risk factors associated with BRD and provide guidance for areas that require further improvement. In addition, a low-cost and reliable method to benchmark the disease occurrence in the specific herd over time is critically needed to demonstrate the impact of interventions on BRD because of the typical lag or delay between the modification of the risk factor(s) and BRD outcomes. Such demonstration of the impact of control and preventative measures implemented incentivizes producers to make the changes by positive reinforcement.
One successful example for a functional and comprehensive tool to prevent and control disease in human and veterinary medicine is the use of a risk assessment tool. Risk assessment tools have been used extensively in human and veterinary medicine (Pearson, Reference Pearson2002; USDA 2003, 2011; Nandy et al., Reference Nandy, Parsons, Cryer, Underwood, Rashbrook, Carter, Eldridge, Close, Skelton, Taylor and Feder2004; Berghaus et al., Reference Berghaus, Lombard, a Gardner and Farver2005; Rexius et al., Reference Rexius, Brandrup-Wognsen, Nilsson, Odén and Jeppsson2006; Harrison et al., Reference Harrison, Parry, Carpenter, Short and Rowan2007; Rello et al., Reference Rello, Rodriguez, Lisboa, Gallego, Lujan and Wunderink2009). For example, the use of a risk assessment tool to control Johne's disease in cattle has been shown to offer a comprehensive and effective assessment to identify the risk factors for Mycobacterium paratuberculosis transmission (USDA, APHIS, VS, 2011). A risk assessment approach may be even more effective in prevention of BRD, given that producers may observe the benefits of the prescribed interventions relatively sooner compared to diseases with longer incubation periods like Johne's disease. The steps taken in the development of the first BRD risk assessment tool for preweaned calves are described here.
Materials and methods
The methods for determining the risk of BRD in preweaned dairy calves on a dairy farm are patent pending, 2018 The Regents of the University of California.
Risk assessment tool components
Risk factor questionnaire
First, a questionnaire was designed to inquire on aspects of calf-rearing including management practices that affect calf health generally, and BRD specifically (Love et al., Reference Love, Lehenbauer, Karle, Hulbert, Anderson, Van Eenennaam, Farver and Aly2016b). Prior to being mailed, the questionnaire was tested by the study authors which included researchers, clinicians, and extension and outreach specialists. The mailing list included California's grade A milk producing dairies at the time of the survey. Data from the survey were analyzed using principal component analysis to identify the risk factor variables (questions) and group them into risk component constructs (questionnaire sections). In addition, producer responses helped determine the appropriate answer options for the questions. For example, how often producers may change the maternity pen bedding is a risk factor for infection with pathogens at birth (Pithua et al., Reference Pithua, Espejo, Godden and Wells2013). However, the range of frequency of maternity pen bedding changes was only known through personal experiences and the survey helped identify the actual range that should be provided as an answer option for that specific question. Finally, data from this questionnaire allowed us to outline the options that would capture the variability observed in the dairy industry for each risk factor. For example, the survey helped identify for inclusion as a response the use of magnesium chloride for dust abatement, otherwise commonly used in equestrian sports and which was not common knowledge despite being used on a percentage of dairies.
Once the questionnaire was reorganized into the different risk component sections and within each section the risk factor questions, the next research goal was to estimate the risk scores. Each of the risk scores represents the magnitude of the association between an exposure (the question's answer) and the outcome assessed (BRD). However, the mail survey alone lacked an outcome measure (of BRD occurrence) and hence could not provide the risk scores. Instead, risk scores were estimated using observational studies.
Risk scores
Although some risk scores may be estimated using previous studies, the latter lacked adjusting for known exposures and management practices since most studies test a specific hypothesis and involve investigating one or a few exposures. Furthermore, exposure and outcome ascertainment standards may vary between studies along with inherent differences between study designs (prospective versus retrospective), and data collection and validation methods which are all likely to result in additional variability. As a result, risk scores were estimated from prospective studies designed for the purpose of the risk assessment tool development.
First, a prospective cohort study design was sought to estimate BRD incidence density rates (cases per unit time at risk) and hazard. The cohort study led to the enrollment and follow-up of more than 11,000 calves from birth to weaning on six dairies representing California's three milk sheds (Northern CA, Northern San Joaquin Valley, and Greater Southern CA) described by Love et al. (Reference Love, Lehenbauer, Van Eenennaam, Drake, Kass, Farver and Aly2016a, Reference Love, Lehenbauer, Karle, Hulbert, Anderson, Van Eenennaam, Farver and Aly2016b). On each dairy, calves were enrolled and monitored daily for BRD. Data on the variables identified in the risk factor questionnaire were collected every 2–4 months using the same questionnaire. Covariates were tracked over time. For example, dairies with more than one hutch type were visited repeatedly to document the type of hutch for each calf enrolled. Management changes that occurred as calves aged, such as volume of milk fed, or between seasons, such as introducing a new vaccine or changes in dust conditions at the calf raising area, were similarly tracked. The longitudinal study (BRD 10K) provided risk estimates given its prospective design, and despite its herds' wide geographic distribution was limited given it was based on six dairies (Dubrovsky et al., Reference Dubrovsky, Van Eenennaam, Karle, Rossitto, Lehenbauer and Aly2019a, Reference Dubrovsky, Van Eenennaam, Karle, Rossitto, Lehenbauer and Aly2019b).
A second study was sought to capture the variability in management practices and provide greater representation through enrollment of a larger number of dairies. Given the scale of this study, a cross-sectional study design was employed to determine the BRD status on dairies and collect data on the risk factors identified in the risk assessment questionnaire. A random sample of calves was assessed for BRD on each herd which resulted in more than 4600 calves on all 104 dairies. Statistical models were used to estimate the odds ratio for each risk factor. The cross-sectional study (BRD 100) complemented the BRD 10K in terms of generalizability (Maier et al., Reference Maier, Love, Karle, Dubrovsky, Williams, Champagne, Anderson, Rowe, Lehenbauer, Van Eenennaam and Aly2019).
The coefficients for the odds ratios from the BRD 100 and the coefficients for the hazard ratios from the BRD 10K, provided the estimates for the risk scores for each risk factor in the risk assessment questionnaire. In addition, prevalence estimates from the BRD 100 dairies were used to explore the regional differences in dairy management practices and prevalence (Karle et al., Reference Karle, Maier, Love, Dubrovsky, Williams, Anderson, Van Eenennaam, Lehenbauer and Aly2019). Once the risk scores were determined, they were transformed to a total of 1000 for ease of interpretation without loss of overall magnitude of each risk factor (Maier et al., Reference Maier, Love, Karle, Dubrovsky, Williams, Champagne, Anderson, Rowe, Lehenbauer, Van Eenennaam and Aly2020).
BRD prevalence
Along with identifying the necessary herd-specific prevention measures, observing a decrease in disease incidence is likely to justify to the producer their investments in time, effort, and money. A rapid and low-cost diagnostic tool should facilitate benchmarking disease burden before and after BRD preventive measures are implemented on a dairy. Furthermore, diseases with short incubation periods and little to no latency, such as BRD, are rapid and are more likely to benefit from a risk assessment approach. However, a low-cost, calf side test for BRD is required to allow producers to identify the disease burden in their calves. Hence, a novel on-farm scoring system was developed and validated to allow for rapid assessment of calves for BRD (Aly et al., Reference Aly, Love, Williams, Lehenbauer, Van Eenennaam, Drake, Kass and Farver2014; Love et al., Reference Love, Lehenbauer, Kass, Van Eenennaam and Aly2014, Reference Love, Lehenbauer, Van Eenennaam, Drake, Kass, Farver and Aly2016a). The new scoring system was based on the previously described Wisconsin (WI) BRD scoring system (McGuirk, Reference McGuirk2008). The WI system is characterized by a gradient (from 0 to 4) in clinical severity for each of five clinical signs: nasal and ocular discharge, ear droop or head tilt, cough, and fever. The new scoring system, known as the California (CA) BRD scoring system, is composed of a dichotomous assessment (normal or abnormal) of each of the five clinical signs in addition to breathing character as the sixth clinical sign (labored or rapid respiration compared to adjacent calves). Cough was only noted if spontaneous and not based on the cough test as in the WI scoring system (using digital manipulation of a calf's larynx or trachea). Validation of both clinical scoring systems was completed on three dairies and two calf ranches using thoracic ultrasound and auscultation as the reference test status. A smart phone and tablet mobile application, the UC Davis BRD Scoring, was designed to facilitate prevalence estimation, interpretation and reporting. The prevalence estimation feature of the application allows the producer to estimate the prevalence in a herd based on a simple random sample survey of the calf herd. Specifically, using the sample size estimation formula (Equation (1)):
 $$n = \displaystyle{{Npq} \over {\lpar {N-1} \rpar D + pq}}\comma \;\quad {\rm where}\;q = 1-p\;{\rm and}\;D = \displaystyle{{B^2} \over 4}.$$
The inputs of the formula are: p is the BRD prevalence hypothesized in the calf herd, which is entered on an integer scale. The default value is 25% (0.25 on an integer scale) but can be changed to the user's preference, n is the number of calves scored, out of N which is total number of calves in the herd, and B is the bound on the error, here assumed to be 10%, entered into the formula as 0.1. Users should note that the smaller the bound on the error, the greater the sample size required.
Based on the estimated n and N, the app will generate a vector of random numbers of size n that range from 1 to N, and prepare a list of differences between each element in the vector, which will be the number of hutches to skip before scoring the next calf.
The prevalence is then estimated using Equation (2):
 $$\hat{\,p} = \bar{y} = \displaystyle{{\sum\nolimits_{i = 1}^n {y_i} } \over n}.$$
The inputs of the formula are:  $\hat{p}$ is the estimate of BRD prevalence in the calf herd; n is the number of calves scored, out of N, the total number of calves in the herd; and y i is BRD status of the ith calf, taking the value 0 (BRD score negative) or 1 (BRD score positive) and is based on the sum of scores for the CA scoring system's six clinical signs.
To estimate the 95% confidence interval for the calf herd's BRD prevalence the variance of the prevalence  $\hat{p}$ is estimated using Equation (3):
 $$\hat{V}\lpar {\hat{\,p}} \rpar = \displaystyle{{\hat{\,p}\hat{q}} \over {n-1}}\left({\displaystyle{{N-n} \over N}} \right).$$
Users estimating the prevalence of BRD in a calf herd that is group housed can still utilize the application by obtaining a list of calves in the group pen and scoring the calves in the list's sequence instead of hutch order. The application can also be used to identify a random sample of animals as part of other preventive veterinary medicine activities in herds requiring such random selection. Users can do so by skipping through the actual scoring of BRD clinical signs and only utilizing the sample size estimation and random sample selection aspects of the prevalence estimate feature.
Risk assessment recommended changes
The final section in the risk assessment identifies each risk factor contributing risk points (scores) to the herd's total risk score. For each risk factor identified, the investigator notes the current management practice and its associated risk score. Management practices with lower risk scores can then be discussed with the goal of reducing the herd's total BRD risk, assuming similar herd management as those observed in the study herds. The producer can then identify the changes feasible at the time of the risk assessment and assign staff to the duties required to implement these necessary and agreed upon interventions.
Results and discussion
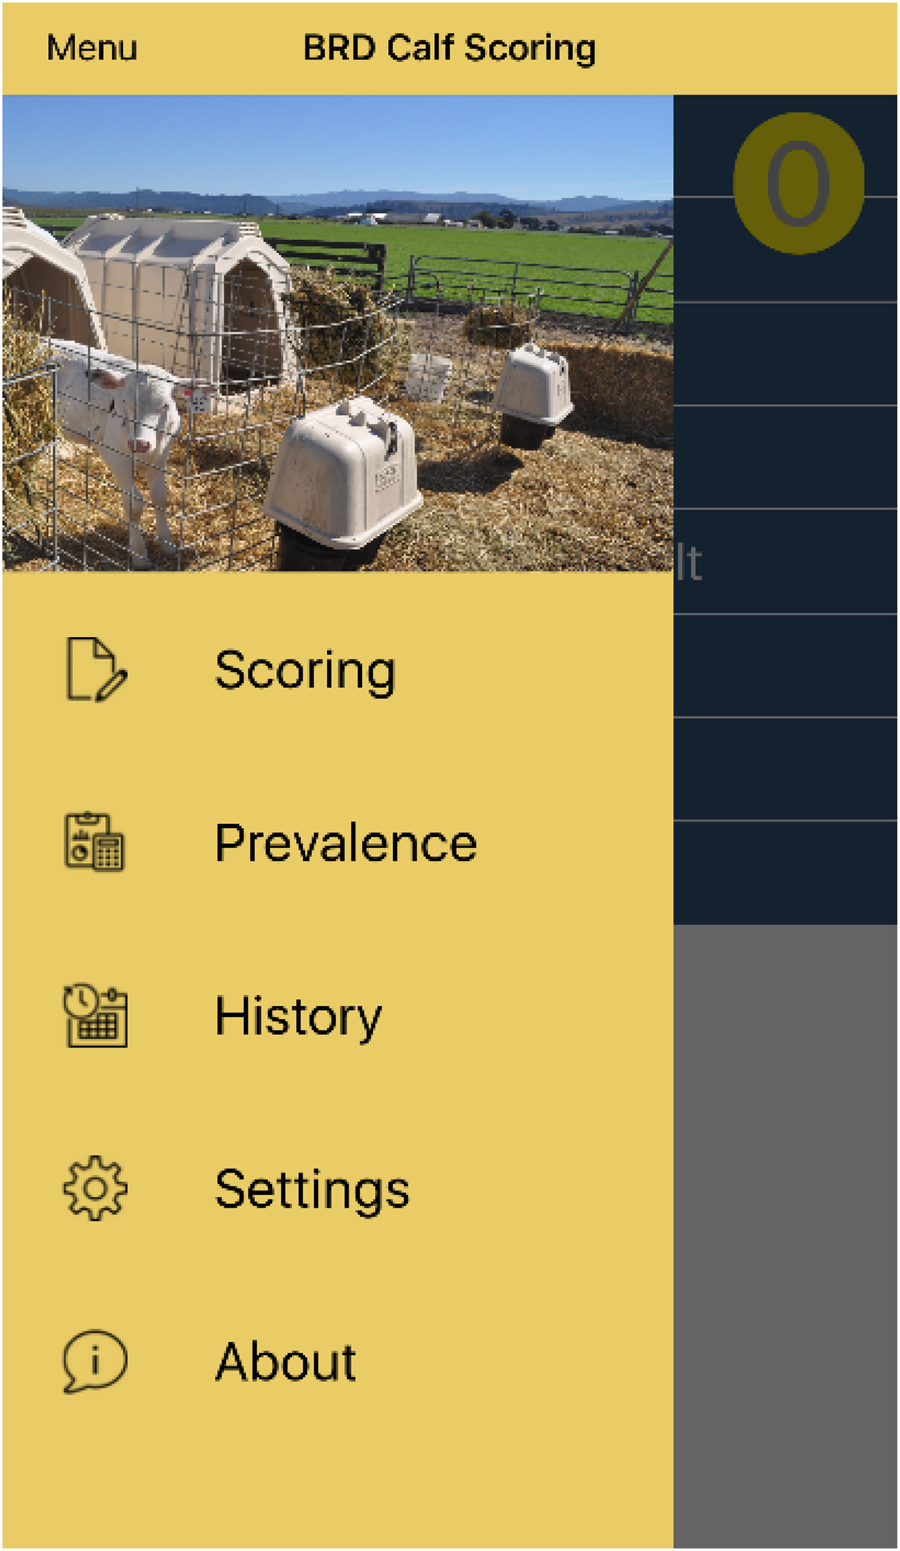
The report here describes the steps used to develop a risk assessment tool for BRD in preweaned dairy calves. The complete BRD Risk Assessment Tool is available online (https://escholarship.org/uc/item/1jb2f7rm). The survey conducted on California dairies helped identify the risk assessment sections and questions that should be included. Specifically, the basic herd risk profile section estimated using herd demographics, the maternity pen management section, colostrum management section, milk feeding section, vaccinations section, and calf housing section. An important component of the risk assessment is the risk scores. The risk scores were estimated based on model estimates from the BRD 10K and the BRD 100 studies (Karle et al., Reference Karle, Maier, Love, Dubrovsky, Williams, Anderson, Van Eenennaam, Lehenbauer and Aly2019; Maier et al., Reference Maier, Love, Karle, Dubrovsky, Williams, Champagne, Anderson, Rowe, Lehenbauer, Van Eenennaam and Aly2019; Dubrovsky et al., Reference Dubrovsky, Van Eenennaam, Karle, Rossitto, Lehenbauer and Aly2019a, Reference Dubrovsky, Van Eenennaam, Karle, Rossitto, Lehenbauer and Aly2019b). Similarly, the derivation of the risk scores and their scaling for ease of use are a subject of another article (Maier et al., Reference Maier, Love, Karle, Dubrovsky, Williams, Champagne, Anderson, Rowe, Lehenbauer, Van Eenennaam and Aly2020). Producers and herd veterinarians seeking such a risk assessment tool should determine BRD's disease burden in their herd. Prevalence estimation can be facilitated using a smart phone and tablet application, the UC Davis BRD Score, which is available in English, Spanish, and Arabic languages. The application can be downloaded in both iOS and Android environments using key words: UC Davis and BRD (Fig. 1).
Smart phone and tablet application for BRD scoring in preweaned dairy calves. (Image reprinted by permission from Dr. Sharif Aly)

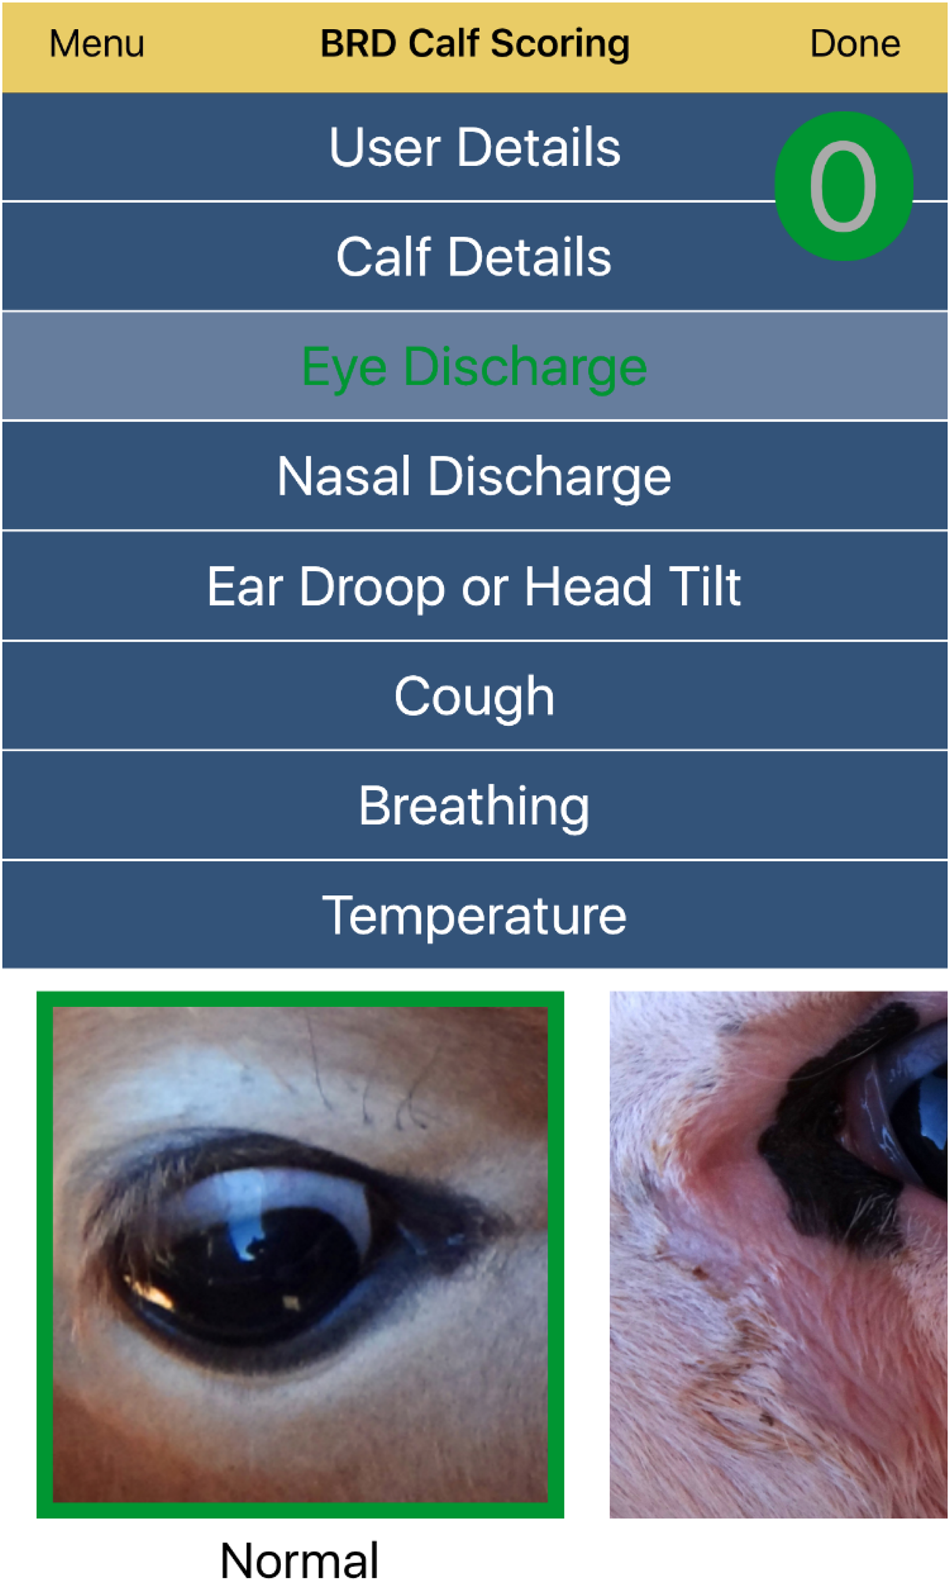
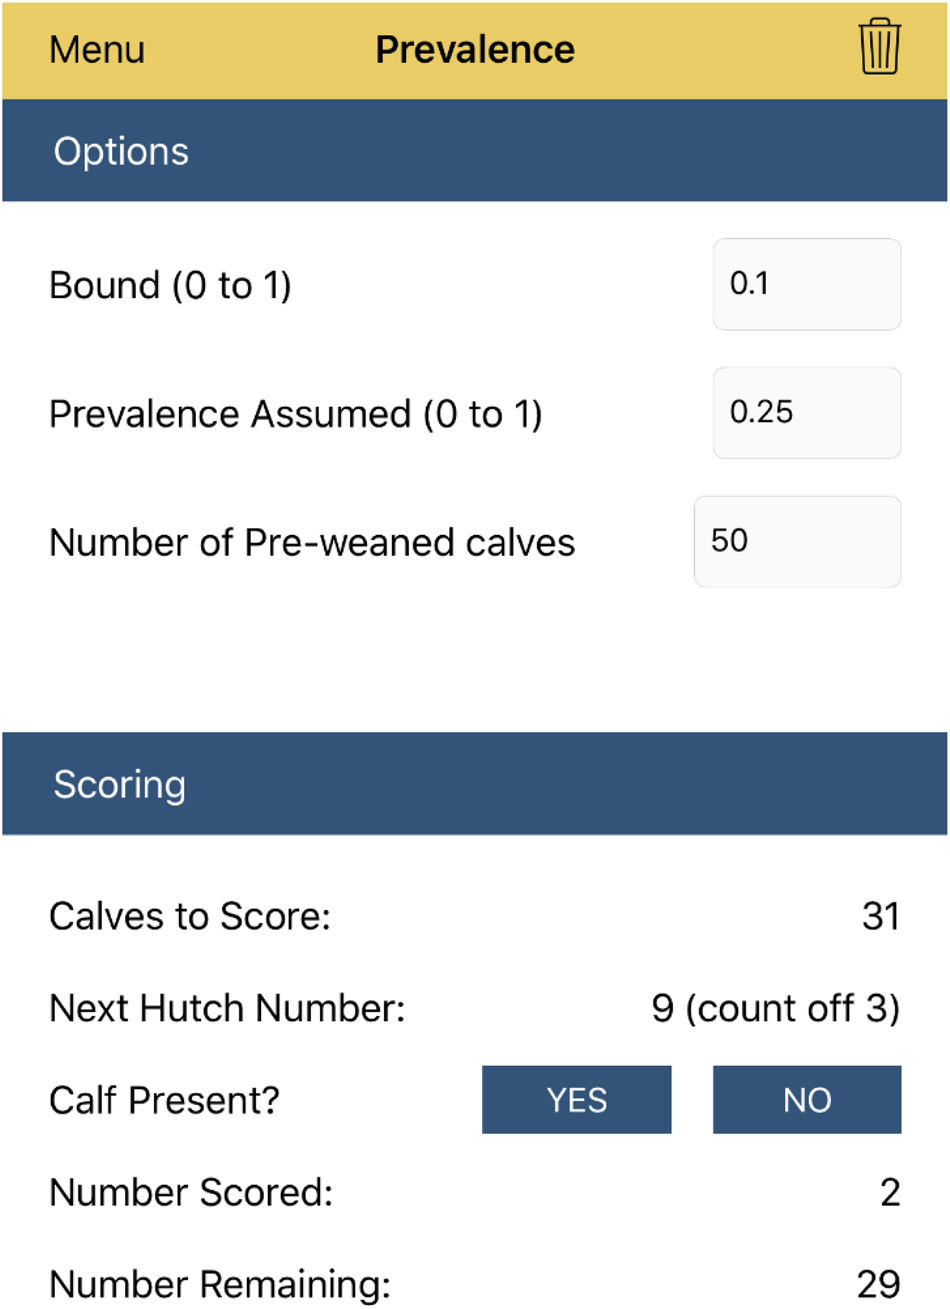
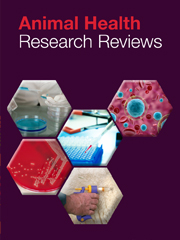
The mobile application was designed to aid producers scoring a single calf or multiple calves, determine the BRD prevalence in a calf herd, query results of previous calves scored, and modify settings (Fig. 2). Entering information on the herd, calves scored, date, and time is optional to facilitate rapid scoring, however, such data are valuable when accessing previous records. Similarly, unchecked clinical signs are assumed absent, hence users may only select the observed clinical signs by tapping on the example pictures (Fig. 3). A user scores the calf in the hutch or pen identified by the app, which also provides the number of hutches to count off from the first hutch on the farm. A user would proceed to the next randomly selected hutch based on the app's output of how many hutches to skip (Fig. 4). Between scoring calves, the application inquires whether the calf is present in the hutch since hutches may be vacant, as when a calf dies or is removed for other reasons. If the next hutch is empty the application will instruct the user to proceed to the next randomly selected hutch. The application will internally adjust the vector of hutches to score such that the sample size is fulfilled close to, but before the last hutch (N, the total number of calves in the herd).
Smart phone and tablet application options to score preweaned dairy calves for BRD, estimate prevalence of BRD in a calf herd and query previously scored calves. (Image reprinted by permission from Dr. Sharif Aly)

Clinical signs for BRD on a horizontal slide bar. (Image reprinted by permission from Dr. Sharif Aly)

Prevalence estimation screen on a smart phone and table application indicating the inputs required to calculate the number of calves to score and identified by guiding the user through the calf housing units. (Image reprinted by permission from Dr. Sharif Aly)

The producer in collaboration with the herd veterinarian can decide which interventions can be implemented to prevent and control BRD in a calf herd. Since interventions most likely involve additional effort and costs, the producer may seek further analysis of the herd's scores by risk components and how they compare across the risk scale for each component and the expected reduction in BRD risk. For example, the investigator may preferentially implement interventions related to risk factors from one component over another depending on the expected reduction in total herd risk score. The advantage the risk assessment provides is an approximate estimate of the reduction in BRD risk assuming similar herd conditions as observed in the study herds. Investigators should also consider the distribution of BRD score positive calves by age, breed, calf sex, and clinical signs. Although the clinical signs for BRD are not specific, a presentation such as tilted heads or drooped ears seems to be associated with M. bovis infections. Similarly, the age distribution of cases may help exclude aspiration pneumonia commonly seen earlier in life when untrained staff use an esophageal tube to feed calves. Despite genetic related differences between breeds, an increase in cases in one breed of calves compared to another within the same herd may be related to breed-associated management differences such as amount of milk fed, use of a specific hutch type, or management practice for one breed versus another. Similar differences in management may confound associations observed between calf-sex and BRD, especially that female calves may be preferentially fed more colostrum on dairies at birth resulting in greater antibody transfer and lower risk for BRD compared to male calves fed less colostrum.
In addition to the prevalence estimate obtained at initiation of the risk assessment, a second estimate should be obtained after a new cohort of calves has experienced the recommended management changes and as part of a follow-up risk assessment. Such a follow-up risk assessment is recommended to determine whether the changes implemented were sufficient to decrease the prevalence of BRD; or troubleshoot a lack of impact on BRD burden in the calf herd. The duration between the initial and follow-up risk assessments may vary by herd. Longer durations between assessments, especially across seasons, may confound such contrasts. Similarly, a shorter duration between assessments may not be long enough to observe changes in disease burden. Furthermore, the minimum duration may vary between herds depending on the length of the preweaning period and whether an investigator seeks a completely new cohort of calves to be exposed to the interventions implemented after the initial risk assessment. A duration as long as the preweaning period is a suggested timeframe as a new cohort of calves would have been exposed to the new management practices identified by the risk assessment. A longer duration would be necessary to evaluate the effectiveness of new management practices that may not immediately affect the current calf cohort, such as vaccination of dry cows.
Development of the risk assessment tool for BRD was based on two observational study designs, a longitudinal cohort and a cross-sectional study. Use of a single cohort study design would have been preferred, however, even with the current cohort study of six dairies, over 11,000 calves were enrolled and followed up which makes a single cohort study of 100 dairies beyond feasible. Another limitation of the current risk assessment tool is that data used to estimate the risk scores were based on dairies from a single state which limits its applicability to calf herds in regions with similar management practices and climate. However, California's climate varies widely from coastal, Mediterranean, to hot and arid which were all represented in both studies due to the wide spatial distribution of the BRD 10K and BRD 100 dairies. Further validation of the risk assessment tool is needed. In addition, efforts to regionalize the risk assessment tool can allow for its use in calf herds managed differently under different climates.
Conclusions
BRD continues to have a significant impact on the health and welfare of preweaned dairy calves. A BRD risk assessment tool can be used as a comprehensive approach to identify the management practices associated with high BRD risk. Subsequently, decision makers can decide which of the recommended changes can be implemented, such decisions can be educated by the costs involved. At the same time, changes can be prioritized based on the magnitude of BRD associated with each change. Producers are also encouraged to estimate the prevalence of BRD as part of the risk assessment which can be used to monitor the impact of changes undertaken on the disease burden in the herd.
Acknowledgments
The authors acknowledge the dairy owners, their staff and herd veterinarians involved in the different studies conducted to collect the data to develop the risk assessment. Funding support for developing the risk assessment was provided by the University of California's Division of Agriculture and Natural Resources, Competitive Grants Program (PI: S. Ay, Project 1753), USDA National Institute of Food and Agriculture (PI: S. Aly, Projects: CA-V-PHR-4041-H and CALV-AH-360), Center of Food Animal Health and the Dairy Epidemiology Lab (Aly Lab), School of Veterinary Medicine, University of California, Davis.