Implications
The response to selection is expected to be different according to the environment in which the animals of the population are evaluated. Genetic variation exists in the sensitivity of animals to the environment, a fact that permits the selection of more plastic or robust genotypes for growth traits in the composite beef cattle studied. The genotype by environment interaction is an important factor that should be considered in the genetic evaluation of animals of the present population.
Introduction
Phenotypic plasticity or environmental sensitivity is the ability of a genotype to alter its phenotypic expression in response to environmental influences (Bradshaw, Reference Bradshaw1965). Phenotypic plasticity often characterizes the so-called genotype by environment interaction (G × E). This interaction provokes alterations in genetic, phenotypic and environmental variations that consequently lead to changes in genetic and phenotypic parameter estimates, thus permitting to change selection criteria depending on the environment where the animals are raised and evaluated (Alencar et al., Reference Alencar, Mascioli and Freitas2005).
There are various approaches to study and detect G × E. One of the most widely used methods is reaction norm, which permits the visualization of the trajectory of animal performance as a function of the environment, thus describing environmental sensitivity (Via and Lande, Reference Via and Lande1985; Kirkpatrick and Heckman, Reference Kirkpatrick and Heckman1989). Reaction norms are able to indicate where G × E occurs across the environmental gradient and their magnitude.
A reaction norm can be obtained by random regression on environmental descriptors (Kolmodin et al., Reference Kolmodin, Strandberg, Madsen, Jensen and Jorjani2002; Fikse et al., Reference Fikse, Rekaya and Weigel2003). The environmental variable is unknown and is defined as the average phenotypic performance of the animals in each environment. Traditionally, one approximation proposed is to compute the mean phenotypic of the trait studied in each environment and then use these estimates as known covariates in the model (Kolmodin et al., Reference Kolmodin, Strandberg, Madsen, Jensen and Jorjani2002 and Reference Kolmodin, Strandberg, Danella and Jorjani2004). According to Su et al. (Reference Su, Madsen, Lund, Sorensen, Korsgaard and Jensen2006), this approach can lead to bias in the estimation of genetic parameters and breeding values. To overcome this problem, these authors proposed the simultaneous estimation of environmental values and other parameters of the model (reaction norm model with unknown covariate), which provided more accurate estimates.
In the case of composite beef cattle, the different breed compositions provide numerous alternative genetic responses to different environments. Few studies have investigated the effect of G × E on the performance of these animals. Therefore, the objective of the present study was to determine the presence of G × E and to characterize the phenotypic plasticity of birth weight (BW), weaning weight (WW), postweaning weight gain (PWG) and yearling scrotal circumference (SC) in composite beef cattle using the reaction norms model with unknown covariate.
Material and methods
Data
Data were taken from animals born between 1995 and 2008 on 33 farms located between latitude −7° and −31°, longitude −40° and −63°, in the Brazilian states of Goiás, Minas Gerais, Mato Grosso do Sul, Mato Grosso, Pará, Rio Grande do Sul e São Paulo (Figure S1). The farms participated in the Montana Tropical Composite Breeding Program, CFM-Leachman Pecuária Ltda. These farms were practically located throughout all Brazilian biomes (Amazon, Cerrado, Pantanal, Atlantic Rain Forest and Pampa), which are characterized by wide variations in the conditions of climate, soil and vegetation.
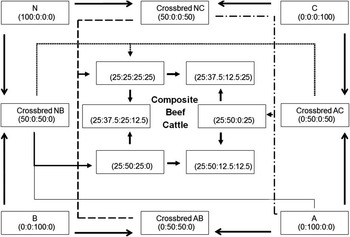
The objective of Montana Tropical Composite Breeding Program is to produce animals with high level of production, fertility and adaptation to the tropical conditions of climate and management using a combination of multiple breeds (Bos taurus × Bos indicus). In the present population, the bulls are selected based on an index including standardized Estimated Progeny Differences for BW, WW, PWG, SC and muscle score, weighted −1, +3, +4, +1 and 1, respectively. On the basis of the original program of formation of composite beef cattle, that is, the population used in the present study, the breeds were pre-grouped according to their genetic similarity and performance into four large biological types, which are identified by the abbreviation NABC (Ferraz et al., Reference Ferraz, Eler and Golden1999): group N (B. indicus) represented by Zebu breeds, which mainly include Guzerat, Indubrasil, Nellore, Tabapuã and other Zebu breeds of African origin such as Boran; group A (B. taurus) represented by breeds adapted to tropical climates such as Afrikaner, Belmont Red, Bonsmara, Caracu, Romosinuano and Senepol; group B (B. taurus) represented by European breeds of British origin such as Aberdeen Angus, Red Angus, Devon and Hereford; group C (B. taurus) represented by European breeds of continental origin such as Charolais, Gelbvieh, Brown Swiss, Simmental, Limousin and others. In this population, an animal (composite beef cattle) should be composed of at least three different breeds, 12.5% adapted breed to the tropical environment and 25% of Zebu breed (N) plus tropically adapted breeds (A). The maximum acceptable values are 37.5% group N, 87.5% group A, 100% group N plus A, 75% for groups B, C and B plus C. Further details about the population studied can be found in Santana et al. (2012a) The schematic diagram of the composite beef cattle program is shown in the Figure 1.
Schematic diagram of the composite beef cattle program showing breed compositions (% N = Zebu; % A = tropically adapted taurine; % B = Britain; % C = Continental).

The animals were kept on pasture with or without supplements in the dry season. In general, the pastures were composed of Brachiaria brizantha. Especially in the Pantanal (Midwest) and Pampa (southern Brazil), the native pasture plays an important role in animal feeding. All farms provided mineral supplements and some protein. About 60% of cows were inseminated and 40% were placed in lots with a group of bulls. The cow-to-bull ratio was 30 : 1 or 25 : 1. Calves born between September and December (spring in Brazil, the beginning of the rainy period) remained with their dams up to 7 months of age. Weight recordings were obtained at weaning and at yearling (∼205 and 420 days of age, respectively). The SC was measured by placing a tape around the scrotum at the point of maximum diameter.
Model and parameter estimation
The statistical models for BW, WW, PWG and SC included the fixed effects of contemporary group (CG; farm, year of birth, management group and sex) and age of animal at recording (linear effect), age of dam at calving (linear and quadratic effects). For PWG, the model included the age of animal at weaning and age of animal at yearling as linear covariates.
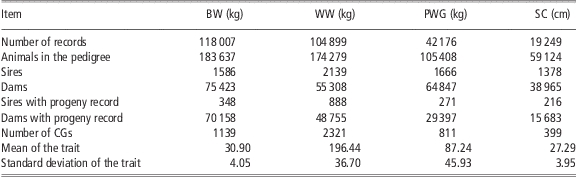
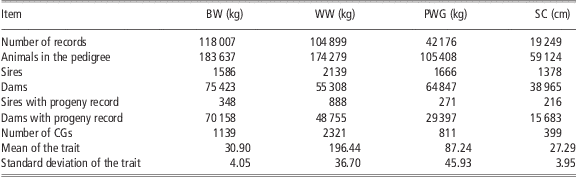
All observations were previously adjusted using adjustment factors developed by the Animal Breeding and Biotechnology Group of University of Sao Paulo (GMAB), for maternal breed composition and individual and maternal heterozygosis. Further details on this procedure can be found in Bocchi et al. (Reference Bocchi, Oliveira, Ferraz and Eler2008). Records exceeding 3.5 standard deviations below or above the overall mean, CG containing fewer than 20 animals were excluded from the data set. A summary of the data file is shown in Table 1.
Structure of the data set for BW, WW, PWG and SC in composite beef cattle
BW = birth weight; WW = weaning weight; PWG = postweaning weight gain; SC = scrotal circumference; CG = contemporary groups.
The hierarchical reaction norms model with unknown covariate (Su et al., Reference Su, Madsen, Lund, Sorensen, Korsgaard and Jensen2006) was used to estimate genetic parameters and study the G × E. In the present study, the CG was chosen as the environmental descriptor, that is, the environmental covariate of the reaction norms. This covariate was jointly estimated with the reaction norms of the animals.
The reaction norm model used can be described as
 $$y_{ij} \, = \,{x^{\prime}}_i \beta \, + \,X_j \, + \,a_i \, + \,b_i X_{(cg)j} \, + \,{m_i \, + \,mp}_i \, + \,e_{ij}, $$
where yij is the record of animal i in the environment j; β the vector of fixed effects;  $${x^{\prime}}_i $$ the corresponding incidence vector; X (cg )j the environment random effect
 $[X_{(cg)j} \sim N{\rm{(0,}}\sigma _{cg}^2 {\rm{)];}}$ai the additive genetic value of the intercept or random level of the animal reaction norm i; bi the random regression coefficient or slope of reaction norm of animal i in environment represented by X (cg )j; mi the maternal additive genetic effect (only BW and WW); mpi the maternal permanent environmental effect (only WW) and eij the residual effect,
 ${{e}_i}\, \sim \,N\,{\rm{(0,}}\,\sigma _e^2 )$. The covariance between direct and maternal effect was set to zero.
The additive genetic variance in the environment  $X\,(\sigma _a^2 |X)$ was estimated by
 $\sigma _a^2 |X\, = \,{\rm var}(a_i \, + \,b_i X)\, = \,\sigma _a^2 \, + \,X^2 \sigma _b^2 $$ + \,2X\sigma _{ab} $. The direct heritability for a trait with maternal additive genetic and maternal permanent environment effects was obtained by
 $$h_a^2 \, = \,\frac{{\sigma _a^2 |X}}{{\sigma _a^2 |X\, + \,\sigma _m^2 \, + \,\sigma _{mp}^2 \, + \,\sigma _{cg}^2 \, + \,\sigma _e^2 }},$$
where  $\sigma _a^2 |X,\,\sigma _m^2, \,\sigma _{mp}^2, \,\sigma _{cg}^2 \,{\rm{and}}\,\sigma _e^2 $ are variances due to direct additive genetic effect in the environment X, maternal additive genetic effect, maternal permanent environmental effect and CG effect. The maternal heritability (
 $h_m^2 $) and the proportion of the total phenotypic variance due to maternal permanent environment effect (c 2) were obtained in a similar manner. More details about the hierarchical reaction norms model with unknown covariate are reported by Su et al. (Reference Su, Madsen, Lund, Sorensen, Korsgaard and Jensen2006).
The (co)variance components were obtained using a Bayesian approach through the Intergen program (Cardoso, Reference Cardoso2010). Analysis consisted of a single chain of 550 000 cycles, with a conservative burn-in period of 50 000 cycles and a thinning interval of 50 cycles. Thus, 10 000 samples were effectively used to estimate the parameters and highest posterior density intervals. A random sample of animals was used to illustrate the phenotypic plasticity by the reaction norms approach.
Results and discussion
The environmental gradients obtained based on the solutions for the effect of CG ranged from −6.45 to +4.75 kg, −65 to +65 kg, −72 to +112 kg and −6.5 to +5.5 cm for BW, WW, PWG and SC, respectively. According to Mattar et al. (Reference Mattar, Silva, Alencar and Cardoso2011), the CG combines important environmental information that affects animal performance. Therefore, the CG can be naturally defined as environmental descriptor.
Heritability
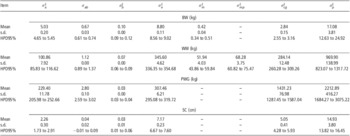
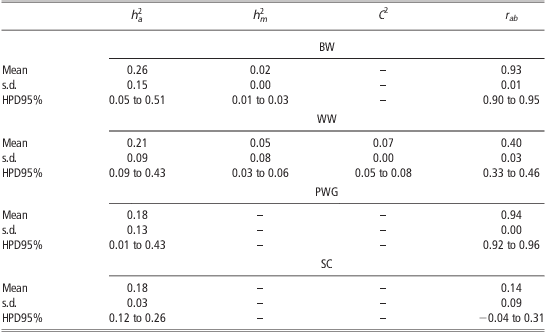
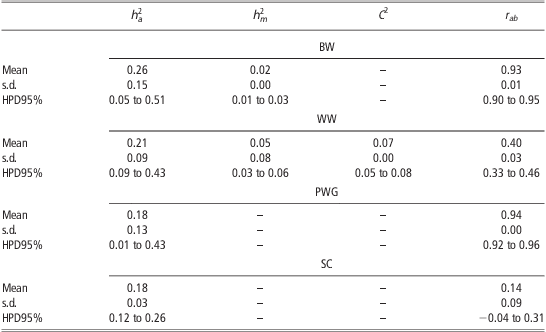
The direct additive genetic component obtained for all traits indicates that these traits should respond to selection (Table 2). The proportion of phenotypic variance due to maternal permanent environmental effects and the maternal additive genetic variance were relatively low (Table 3). These results agree with those reported by Eler et al. (Reference Eler, Ferraz, Golden and Pereira2000) for BW, WW and PWG of Nellore cattle and by Santana et al. (Reference Santana, Eler, Ferraz and Mattos2010) for PWG and SC using part of the same population of composite cattle.
Components of (co)variance for BW, WW, PWG and SC in composite beef cattle

BW = birth weight; WW = weaning weight; PWG = postweaning weight gain; SC = scrotal circumference;  $\sigma _a^2 $ = direct additive genetic variance of intercept;
 $\sigma _{ab}^{} $ = additive genetic covariance between intercept and slope;
 $\sigma _b^2 $ = direct additive genetic variance of slope;
 $\sigma _e^2 $ = residual variance;
 $\sigma _m^2 $ = maternal additive genetic variance;
 $\sigma _{mp}^2 $ = maternal permanent environmental variance;
 $\sigma _{cg}^2 $ = contemporary group variance;
 $\sigma _p^2 $ = phenotypic variance; s.d. = standard deviation; HPD95% = high posterior density interval 95%.
Direct heritability ( $h_a^2 $), maternal heritability (
 $h_m^2 $), proportion of the total phenotypic variance due to maternal permanent environment effect (C 2) and correlation between intercept and slope of reaction norm (rab) for traits studied of composite beef cattle
s.d. = standard deviation; HPD95% = high posterior density interval 95%; BW = birth weight; WW = weaning weight; PWG = postweaning weight gain; SC = scrotal circumference.
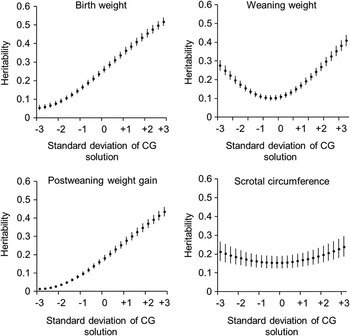
In general, higher direct heritabilities were observed in extreme favorable environments (Figure 2). Similar results have been reported by Corrêa et al. (Reference Corrêa, Dionello and Cardoso2009) and Cardoso et al. (Reference Cardoso, Braccini Neto, Cardoso, Cobuci, Biassus and Barcellos2011) who observed an increase of heritability for PWG in Devon and Hereford cattle, respectively, as the environmental gradient became more favorable. As seen in the present study for WW and SC, Pégolo et al. (Reference Pégolo, Oliveira, Albuquerque, Bezerra and Lôbo2009) obtained higher heritabilities for weight of Nellore cattle at 450 days of age in extreme environments. In a study involving Swedish Red and White dairy cattle, Kolmodin et al. Reference Kolmodin, Strandberg, Danella and Jorjani2004 observed an increase of heritability for protein yield and days open with increasing environmental gradient.
Mean of direct heritability (dots) and high posterior density interval 95% (vertical bars) for the traits studied according to the environmental gradient (CG, contemporary group).

Several authors studying the postweaning performance of beef cattle reported changes in genetic parameters across the environmental gradient, with the observation of a higher proportion of phenotypic variation due to genetic factors in more favorable environments (Corrêa et al., Reference Corrêa, Dionello and Cardoso2009; Cardoso et al., Reference Cardoso, Braccini Neto, Cardoso, Cobuci, Biassus and Barcellos2011; Mattar et al., Reference Mattar, Silva, Alencar and Cardoso2011). Heritability is a property of the population and of the environment to which the animal is exposed, whereas environmental variance depends on production and management conditions. In this respect, greater environmental variation reduces heritability and a more uniform environment increases heritability (Falconer and Mackay, Reference Falconer and Mackay1996). The variation in direct heritability observed indicates a different response to selection according to the environment in which the animals of the population are evaluated.
In general, the mean heritability estimates obtained were similar to those reported for Nellore cattle raised under similar conditions of climate and management. In the present study, the mean of direct and maternal heritability for BW was 0.26 and 0.02, respectively (Table 3). Eler et al. (Reference Eler, Ferraz, Golden and Pereira2000) found direct and maternal heritabilities for BW of 0.25 and 0.03, respectively, in Nellore cattle using a model that included the effect of sire × herd interaction. Direct heritabilities for BW of 0.32 and 0.26 have been reported by Albuquerque and Meyer (2001) and Dias et al. (2005), respectively, for Nellore cattle. In an extreme favorable environment, the mean direct heritability for BW was 0.51 (Figure 2), a value similar to that reported for cattle raised under temperate climate conditions. Eriksson et al. (Reference Eriksson, Näsholm, Johansson and Philipsson2004) obtained direct heritabilities of 0.44 to 0.51 and maternal heritabilities of 0.06 to 0.15 for BW in Swedish Hereford and Charolais cattle. The heritability estimates for BW suggest that this trait should respond to mass selection, especially in environments with better management and feed conditions. The mean of direct and maternal heritability for WW was 0.21 and 0.05, respectively. In Nellore cattle, Albuquerque and Meyer (Reference Albuquerque and Meyer2001) found a direct heritability for WW of 0.14 to 0.16 and a maternal heritability of 0.07 to 0.08. In contrast, Burrow (Reference Burrow2001) reported direct and maternal heritabilities of 0.17 and 0.34, respectively, for WW of a composite cattle population. As observed for BW, in a more favorable environment the phenotype for WW better expressed the genetic potential of the individuals of this population, with a mean maximum direct heritability of 0.41 (Figure 2).
PWG presented a mean direct heritability of 0.01 in the worst environment and of 0.43 in the most favorable environment. According to DeNise et al. (Reference DeNise, Torabi, Ray and Rice1988) and Toral et al. (Reference Toral, Silva, Martins, Gondo and Simonelli2004), in distinct environments a trait is influenced by sets of different genes and these genes are expressed at variable intensities according to the degree of similarity or difference within and between environments.
The heritability estimates for PWG obtained in the present study were similar to those reported in the literature (0.18 to 0.59; Gregory et al., Reference Gregory, Cundiff and Koch1995; Bennett and Gregory, Reference Bennett and Gregory1996; Marcondes et al., Reference Marcondes, Bergmann, Eler, Ferraz, Pereira and Penna2000). For SC, mean heritability ranged from 0.15 to 0.23 across the environmental gradient. These estimates are lower than those reported by Vargas et al. (Reference Vargas, Elzo, Chase, Chenoweth and Olson1998), Eler et al. (Reference Eler, Silva, Evans, Ferraz, Dias and Golden2004) and Santana et al. (Reference Santana, Eler, Cardoso, Albuquerque, Bignardi and Ferraz2012b), who found heritabilities ranging from 0.28 to 0.57 for SC of purebred animals. However, similar estimates were obtained by Santana et al. (Reference Santana, Eler, Ferraz and Mattos2010) in a study, with part of the present composite cattle raised in the Midwest and Southeast of Brazil. As can be seen in Figure 2, this trait should respond satisfactorily to selection both in unfavorable and in favorable environments. This finding is an interesting opportunity for selection programs designed to achieve genetic progress in this trait in extreme environments.
G × E parameters and phenotypic plasticity
The correlation between the level and slope of the reaction norm for BW and PWG was high, indicating that animals with higher average breeding values responded better to improvement in environmental conditions, a fact characterizing a scale effect of G × E (Table 3). A high correlation for PWG has also been observed by Corrêa et al. (Reference Corrêa, Dionello and Cardoso2009) and Cardoso et al. (Reference Cardoso, Braccini Neto, Cardoso, Cobuci, Biassus and Barcellos2011) in Devon and Hereford cattle, respectively, and by Calus et al. (Reference Calus, Groen and de Jong2002) in Friesian cattle. According to Namkoong (Reference Namkoong1985), if scale effects differ for traits that are combined in an economic index, the relative importance of each trait may change and result in the re-ranking of animals based on this index.
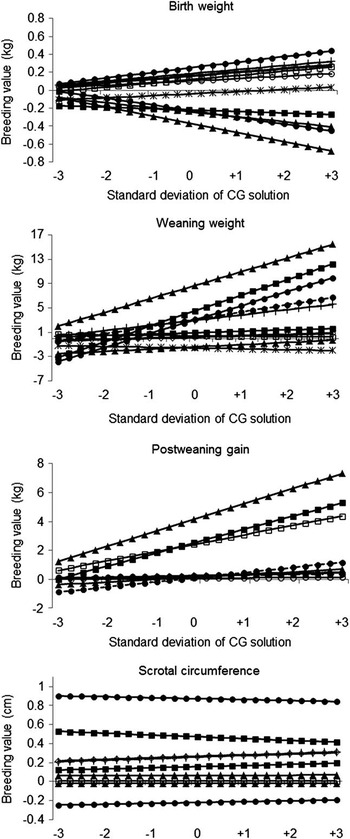
The correlation between the intercept and slope was low for WW and SC. According to Su et al. (Reference Su, Madsen, Lund, Sorensen, Korsgaard and Jensen2006), this finding implies the re-ranking of animals in different environments, that is, the best animal in one environment is not necessarily the best in another environment. The reaction norms of animals are illustrated in the Figure 3.
Individual reaction norms according to the environmental gradient (CG, contemporary group) for a random sample of 10 animals of the composite beef cattle population studied.

According to Falconer (Reference Falconer1990), the variation in the reaction norm slope is directly related to the importance of G × E and reflects environmental sensitivity. Genetic variation in environmental sensitivity of the animals was observed for all traits studied (Table 2). Most animals presented an intermediate sensitivity, that is, the reaction norm slope was close to zero. As a consequence, moderate responses to variations in environmental conditions are expected for the traits studied.
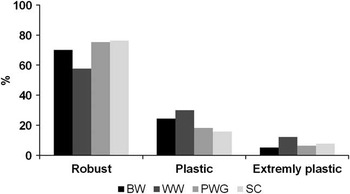
According to the scale of phenotypic plasticity proposed by Mattar et al. (Reference Mattar, Silva, Alencar and Cardoso2011), the individuals can be classified as robust genotypes  $|b|\, \less \,\sigma _b $, plastic genotypes
 $\sigma _b \,\leqslant \,|b|\, \less \,{2\sigma }_b $ and extremely plastic genotypes
 $|b|\,\geqslant \,2\sigma _b $. The distribution of animals in the three classes proposed is shown in the Figure 4. A greater number of extreme plastic genotypes were observed for WW, that is, animals with reaction norm slope far from zero. Thus, selection for greater plasticity should be more effective for this trait.
Percentage of robust, plastic and extremely plastic animals for birth weight (BW), weaning weight (WW), postweaning weight gain (PWG) and scrotal circumference (SC) in the composite beef cattle population studied.

de Jong and Bijma (Reference de Jong and Bijma2002) reported that the phenotypic plasticity must be taken into consideration in the selection of livestock because it offers the possibility to include the environment in the breeding goal. According to Strandberg et al. (Reference Strandberg, Kolmodin, Madsen, Jensen and Jorjani2000), for most production systems it would be preferable to select animals that present a high level and flat slope of the reaction norm for production traits, that is, more robust animals that show good performance under different environmental conditions. These authors acknowledge that the identification of such animals might be a very difficult task. In reality, no matter how robust a genotype, it will hardly be able to produce a superior phenotype under any condition. According to Stearns (Reference Stearns1989), plastic animals might be able to make the genetic alterations necessary according to the environment to which they are exposed. In terms of adaptation, more plastic genotypes may better adapt to drastic environmental changes, whereas robust genotypes may not even be able to survive under certain conditions.
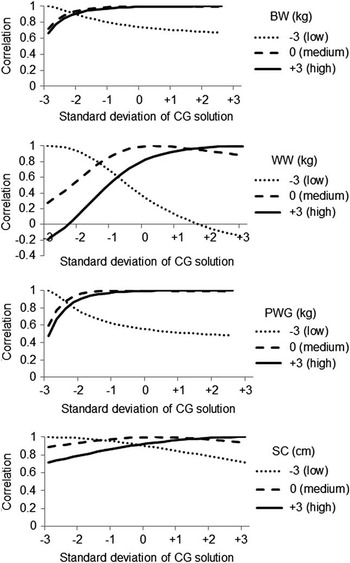
The Spearman correlations between expected breeding values for low (unfavorable), medium (intermediate) or high (favorable) environments and the other environments demonstrated the occurrence of re-ranking of animals, to a greater or lesser extent, according to the environment in which they are evaluated (Figure 5). In general, the correlation between environments was higher for BW and SC than for WW and PWG. The correlation between opposite environments was >0.60 for BW and >0.70 for SC. For WW, the correlation between breeding values of opposite environments reached negative values, whereas a correlation >0.40 was observed for PWG. Strongly negative to positive correlations have been reported by Strandberg et al. (Reference Strandberg, Kolmodin, Madsen, Jensen and Jorjani2000 and Reference Strandberg, Brotherstone, Wall and Coffey2009) for productive and reproductive traits of Dairy Nordic and Holstein cattle. The same was observed by Pollott and Greeff (Reference Pollott and Greeff2004) for fecal egg count and six productive traits in Merino sheep. According to Corrêa et al. (Reference Corrêa, Dionello and Cardoso2009), these correlation estimates indicate that the genetics necessary for production in adverse environments is not the same as that necessary for production in intermediate and favorable environments. These results have major implications for genetic evaluations and selection decisions in the population studied. For example, the correlation between medium and high environments was >0.8 for all traits. In general terms, the best animals in medium environments also show the best performance in high environments. However, this situation changes when the correlation between medium and low environments is considered, which was <0.40 depending on the trait studied. Thus, it is important to indicate the best environment for the animals and what animal should be selected in each environment (de Jong and Bijma, Reference de Jong and Bijma2002). In this sense, the reaction norms approach should be suitable for this proposal.
Spearman correlations between expected breeding values for birth weight (BW), weaning weight (WW), postweaning weight gain (PWG) and scrotal circumference (SC) of composite beef cattle. The lines indicate the correlation between one environment (low, medium or high) and all other environments.

Conclusion
A G × E was observed for all traits studied. The model used here permitted to identify the type and extent of G × E, which differed depending on the trait evaluated. Superior genotypes in favorable environments may not be the best genotypes in unfavorable environments, especially when WW is considered. Therefore, G × E is an important factor that should be included in the genetic evaluation of animals of the present population. Genetic variation exists in the sensitivity of animals to the environment, a fact that permits the selection of more plastic or robust genotypes in the population studied. Because of the present composite beef cattle breeding program providing genetic material for a range of production systems, it can be important to include the phenotypic plasticity as breeding goal. The hierarchical reaction norms model with unknown covariate is a valid and interesting option for the genetic evaluation of animals of the population of composite beef cattle studied here.
Acknowledgments
The authors are grateful to CFM-Leachman Pecuária Ltda. for providing the data set. They thank the Fundação de Amparo à Pesquisa do Estado de São Paulo (FAPESP) for the fellowship granted to the first author (2009/05072-4).