INTRODUCTION
In recent research on second language (L2) acquisition, there has been considerable investigation into interface structures, with a particular emphasis on whether L2 learners experience difficulties in integrating different levels of linguistic knowledge (Sorace, Reference Sorace2011; Sorace & Filiaci, Reference Sorace and Filiaci2006; Sorace & Serratrice, Reference Sorace and Serratrice2009; White, Reference White2011). One influential hypothesis regarding interface structures is put forward by Sorace and Filiaci (Reference Sorace and Filiaci2006). According to their Interface Hypothesis (IH), linguistic structures involving an interface are less likely to be fully acquired and processed by advanced L2 learners. Sorace and Filiaci found that near-native L2 learners had acquired the syntactic constraints on pronominal subjects in Italian, but had residual optionality (a failure to consistently restrict overt pronouns to discourse) in comprehending null/overt pronouns involving integration of syntax and discourse.
Sorace (Reference Sorace2011) further refined the IH and classified interfaces into two categories: internal interfaces involving components of the language system (e.g., syntax-semantics) and external interfaces involving a cognitive system not specific to language (e.g., syntax-discourse). According to the IH, internal interfaces are less likely to be problematic, while the external interfaces are the prime locus of protracted delays and difficulties in L2 acquisition (Hopp, Reference Hopp2009; Sorace, Reference Sorace2011; Sorace & Serratrice, Reference Sorace and Serratrice2009).
However, whether external interfaces are necessarily problematic for L2 learners has been questioned. Some researchers argued that not all external interface structures would lead to difficulty in acquisition (e.g., White, Reference White2011). For example, doubling of a topic using clitics, which lies at the interface between syntax and discourse, was found to be problematic for L2 learners (Valenzuela, Reference Valenzuela, Slabakova, Montrul and Prévost2006). Nonetheless, other studies showed that nativelike performance was possible for the same structure (Slabakova et al., Reference Slabakova, Kempchinsky and Rothman2012). Moreover, some structures (e.g., topic and focus) are sensitive to both internal and external interfaces. It is still unclear whether these interface phenomena would pose challenges to advanced L2 learners.
Apart from the definition of IH, how to account for underlying differences between L1 and L2 acquisition of interface structures is also controversial. Two accounts have been proposed. The representational account suggests that L2 learners’ knowledge of the interface structures is less detailed due to the absence of a similar condition in their native language (L1). It is the L2 speakers’ representation of interface structures that leads to difficulty in acquisition (Belletti et al., Reference Belletti, Bennati and Sorace2007; Tsimpli et al., Reference Tsimpli, Sorace, Heycock and Filiaci2004). However, this representational account has been challenged by recent research in which L1 and L2 share similar representations of interface structures. For example, inappropriate use of overt subject pronouns has been attested in L2 speakers whose L1 and L2 are both null subject languages (Filiaci et al., Reference Filiaci, Sorace and Carreiras2014; Lozano, Reference Lozano, Torrens and Escobar2006). Results from these studies led to the processing account that L2 learners may be nonnativelike in acquiring interface structures because they are less efficient in integrating different types of information, regardless of L1–L2 pairs (Hopp, Reference Hopp2009; Roberts et al., Reference Roberts, Gullberg and Indefrey2008).
Taken together, it remains an open question whether structures involving both internal and external interfaces are problematic for advanced L2 learners. If difficulty is observed in these domains, it is not clear whether this is due to less developed representations or less efficient processing. To address these questions, the current study explores the comprehension of focus-to-accentuation mapping in sentences with focus particle only by advanced L2 learners of English whose L1 is either Cantonese or Dutch.
Focus is an essential category of information structure. Comprehension of focus involves many levels of linguistic knowledge, for example, syntax, semantics, prosody, and discourse. In English, the focus of a sentence is typically realized by assigning an accent (i.e., pitch movement associated with a certain word in a sentence, typically accompanied by an increase in duration and intensity) to the focal word (Gussenhoven, Reference Gussenhoven1983; Ladd, Reference Ladd1980; Trommelem & Zonneveld, Reference Trommelem, Zonneveld and van der Hulst1999). In a sentence with the focus particle only, appropriate focus-to-accentuation mapping is critical to the interpretation: only restricts the focus domain and signals an upcoming contrast; accentuation not only is relevant for pragmatic felicity of the sentence in context but also directly affects it meaning (Rooth, Reference Rooth1992). Focus-to-accentuation mapping thus provides an ideal test case of a phenomenon that is sensitive to both internal interface (syntax-prosody-semantics) and external interface (syntax-prosody-pragmatics). By involving both Cantonese learners and Dutch learners of English, we aim to explore the underlying mechanism of L1–L2 differences. Dutch is similar to English in focus-to-accentuation mapping (Gussenhoven, Reference Gussenhoven1983; Trommelem & Zonneveld, Reference Trommelem, Zonneveld and van der Hulst1999), whereas Cantonese, a tonal language with six contrastive lexical tones, primarily varies the position of focus particles and uses word order to achieve the same purpose (Chao, Reference Chao1947; Matthews & Yip, Reference Matthews and Yip2011). The Dutch–English and Cantonese–English language combinations make it possible to examine whether L2 learners’ comprehension difficulty (if any) is due to less detailed mapping between focus and accentuation or to less efficient processing in general.
The article is structured as follows. First, we provide an overview of focus and accentuation in English, Dutch, and Cantonese, and discuss previous studies on the comprehension of focus-to-accentuation mapping in sentences with and without only. We then present the research questions and hypotheses. Subsequently, we report the results from two experiments and discuss the findings with respect to multiple interfaces and underlying mechanisms of L1–L2 differences.
Focus-to-accentuation mapping
Focus is a key concept of informational structure. It commonly refers to new or contrastive information in a sentence. For instance, focus in the answer of (1) merely presents apple as nonpresupposed information about the question (1). Focus becomes contrastive if it rejects a stated alternative in the context (Chafe, Reference Chafe and Li1976; Gussenhoven, Reference Gussenhoven, Lee, Gordon and Büring2006). For example, the focus apple in (2) forms a contrast with the alternative pear mentioned in the question (2).

In Western Germanic languages like English and Dutch, focus is typically realized by assigning an accent to the focal element(s). Accents are manifested primarily in expanded pitch range, accompanied by increased intensity and longer duration (Gussenhoven, Reference Gussenhoven1983). For instance, the answer to question (1) would typically be uttered as (3a), where APPLE is accented (capitalization denotes accentuation). The answer (3a) with accentuation on the object is felicitous to the question (1), while (3b) with accentuation on the verb ATE is not.

Accentuation plays an even more important role in sentences with the focus particle only. In English and Dutch only-sentences, different positions of accentuation trigger different interpretations of focus and affect the truth conditions of the sentences (Jackendoff, Reference Jackendoff1972; Mulders & Szendröi, Reference Mulders and Szendröi2016; Rooth, Reference Rooth1992). The examples in (4) illustrate how accentuation affects the interpretation and truth conditions of an English sentence with only. When accentuation is placed on APPLE, it triggers an object-focus reading that John ate nothing else but the apple, rendering (4a) true and (4b) false in a situation in which John both ate and washed the apple. When accentuation is placed on ATE, it triggers a verb-focus reading that John did nothing to the apple but ate it, rendering (4a) false and (4b) true in a situation in which John ate an apple and a banana. Thus, while inappropriate focus-to-accentuation mapping merely delays comprehension in sentences without only, the misplacement of accentuation hinders the parsing of meaning in sentences with only.

It has long been recognized that languages differ in both the linguistic devices they use to realize focus and the extent to which the same linguistic devices are used. While Dutch is similar to English in the realization of focus, Cantonese differs from English substantially in this respect. Specifically, there is no clear evidence for on-focus pitch expansion in Cantonese (Man, Reference Man2002; Wu & Xu, Reference Wu and Xu2010). Instead, longer duration and higher intensity are manifested in Cantonese focused elements (Gu & Lee, Reference Gu and Lee2007; Wu & Xu, Reference Wu and Xu2010). Further, Cantonese uses focus particles to a larger extent than English. For example, it uses different focus particles in different sentence positions to mark focus, such as zing6hai6 and zaa3. Similar to English only, the preverbal zing6hai6 may associate with any elements rightward, based on the contextual and prosodic information (i.e., primarily variation in duration and intensity), as in (5). Unlike only, the sentence-final zaa3 can associate with any leftward constituent, depending on the context and prosody, as in (6). Regarding sentences (5) and (6), zing6hai6 and zaa3 are interchangeable semantically. They both function like the English focus particle only, specifying the focus element and introducing an alternative set. They also contribute to the truth conditions of the sentence.Footnote 1

In addition, as pointed out by Shyu (Reference Shyu2010), speakers of Chinese languages, including Cantonese, utilize various syntactic structures for disambiguation of sentence meaning involving focus, preferably followed by an overt (or contextually implied) negation conjunct, as shown in (7), which illustrates contrastive object focus.

Comprehension of focus-to-accentuation mapping in sentences with and without only
For comprehension of focus-to-accentuation in sentences without only, previous research on English and Dutch speakers’ comprehension has found that appropriate accentuation facilitates focus comprehension, while inappropriate accentuation delays it (Birch & Clifton, Reference Birch and Clifton1995; Chen, Reference Chen2010). Using the reaction time (RT) paradigm, Birch and Clifton (Reference Birch and Clifton1995) investigated the interaction between focus and accentuation in L1 comprehension by native speakers of English. Participants first heard auditory question-answer dialogues in which the accentuation either matched or mismatched focus in the answer, and then judged whether the answer made sense for the question. English speakers performed faster and made more “YES” judgments with the appropriate focus-to-accentuation mapping than with the inappropriate focus-to-accentuation mapping. Similar results were found in native speakers of Dutch (Chen, Reference Chen2010), using a similar research paradigm. These findings confirm that accentuation plays a crucial role in the comprehension of focus in English and Dutch.
Previous studies on sentences with only have also shown that native speakers of English and Dutch rely on accentuation to interpret focus (Gennari et al., Reference Gennari, Meroni, Crain, Trueswell and Tanenhaus2004; Gualmini et al., Reference Gualmini, Maciukaite and Crain2002; Mulders & Szendröi, Reference Mulders and Szendröi2016). In Gualmini et al.’s study, native speakers of English first heard a story and then a dative only-sentence with accentuation either on the indirect object or direct object (e.g., Bill only gave the book to SUE vs. Bill only gave the BOOK to Sue). They were then asked to judge whether the only sentence was a true description of the story. Native speakers of English were able to use accentuation alone to resolve ambiguities involving only: they associated accentuation on SUE with the interpretation that Bill gave the book to Sue but nobody else, and accentuation on BOOK with the interpretation that Bill gave the book but nothing else to Sue.
Using eye-tracking in the visual world paradigm, Mulders and Szendröi (Reference Mulders and Szendröi2016) investigated how accentuation was used for the interpretation of focus in native speakers of Dutch. The experimental sentences involved the focus particle alleen “only” and different accentuation either on the direct object or the indirect object (e.g., Ik heb alleen SELDERIJ aan de brandweerman gegeven “I only gave CELERY to the fireman” versus Ik heb alleen selderij aan de BRANDWEERMAN gegeven “I only gave celery to the FIREMAN”). Their results showed that Dutch L1 speakers’ eye gaze patterns started to diverge across the conditions as soon as the indirect object selderij “celery” was heard, indicating anticipatory eye movements based on the presence of accentuation during auditory sentence processing.
The role of accentuation in comprehending focus in sentences with only is less clear in tonal languages. Using a similar task and test sentences to Gualmini et al. (Reference Gualmini, Maciukaite and Crain2002), Shyu (Reference Shyu2010) examined how Taiwan Mandarin speakers used prosodic cues to resolve ambiguity in dative constructions with zhi “only,” as in (8). It was found that Taiwan Mandarin speakers consistently associated zhi “only” with direct object in their interpretation, regardless of the position of prosodic prominence. Her findings suggest that Taiwan Mandarin speakers were insensitive to prosodic prominence in resolving ambiguity in sentences with zhi “only,” despite the fact that Taiwan Mandarin does utilize pitch to express focus in production (Xu et al., Reference Xu, Chen and Wang2012).

In spite of cross-linguistic differences in the comprehension of focus-to-accentuation mapping, there is limited work on L2 comprehension.Footnote 2 Akker and Cutler (Reference Akker and Cutler2003) examined the interaction between focus and accentuation in Dutch learners of English. In their experiments, participants first heard a question that manipulated the position of focus (e.g., Which bones were found by the archaeologist? OR Which archaeologist found the bones?), then an answer involving the target phoneme (e.g., [d] in the bearing word dinosaur) that was either accented or deaccented (e.g., The bones of the DINOSAUR were found by the Cuban archaeologist OR The bones of the dinosaur were found by the CUBAN archaeologist). Participants were asked to detect the target phoneme as quickly as possible. Native speakers of English were faster in detecting the target phoneme when the bearing word was accented or focused, and the effect of accentuation and focus interacted (i.e., the effect of accentuation was smaller for the focused words than for the nonfocused words). The interaction between accentuation and focus was, however, absent in Dutch learners of English. As the mapping between focus and accentuation is similar between English and Dutch, Akker and Cutler excluded influence from L1 representation but attributed Dutch learners’ nonnativelike performance to reduced efficiency in the mapping of accentuation to focus.
Nonetheless, a more recent study by Ortega-Llebaria and Colantoni (Reference Ortega-Llebaria and Colantoni2014) suggested that L2 learners’ representation of focus affected the use of prosody in L2 comprehension. Ortega-Llebaria and Colantoni compared L2 learners of English whose L1 was either Spanish or Mandarin. While Spanish primarily uses word order to express focus, Mandarin uses prosody to encode focus by expanding the pitch range and duration of the word (Liu, Reference Liu2009; Wang & Xu, Reference Wang and Xu2011), which is more similar to English at the acoustic level. In the comprehension tasks, participants were forced to select one of three possible answers with accentuation on the subject (e.g., TOBY fell out of the tree), the verb (e.g., Toby FELL OUT of the tree), or the object (e.g., Toby fell out of the TREE), depending on the availability of contextual information. Mandarin learners of English were observed to pattern with native controls, whereas Spanish learners of English were significantly less accurate, which was interpreted as evidence of influence from the representation of accentuation and focus in L1.
Although these two studies shed light on L2 comprehension of the focus-to-accentuation mapping, there are some limitations in them. First, these two studies investigated focus in sentences without only, that is, whether accentuation has a facilitatory effect without contributing to the truth conditions of sentences. Therefore, failure to map accentuation to focus does not necessarily lead to communication failure. L2 learners’ nonnativelike performance might be attributed to their heavy reliance on the meaning of sentences. Second, the English proficiency of L2 learners was not systematically controlled. The differences across groups in the two studies could be attributed to proficiency level of English. In Akker and Cutler’s (Reference Akker and Cutler2003) study, no test or self-report of English proficiency was administered for the Dutch learners of English. It is unclear how well the Dutch learners comprehended English and how long they had been exposed to English. In Ortega-Llebaria and Colantoni’s (Reference Ortega-Llebaria and Colantoni2014) study, L2 learners were selected based on self-report. No proficiency tests were carried out to directly match the English proficiency of the two L2 groups. The two groups of L2 learners also differed in their age at testing (Spanish learners: Mean age = 42, range = 28–58; Mandarin learners: Mean age = 22, range = 19–28), age of acquisition, and length of residency in an English-speaking country, which prevents direct comparison. Furthermore, Ortega-Llebaria and Colantoni’s study did not test L2 learners’ perception of accentuation at phrasal level. As Spanish primarily uses word order to express focus, it might be that Spanish learners of English could not detect accentuation in English sentences and thus were less accurate in their comprehension of focus.
Research questions and hypotheses
In the current study, we investigate focus-to-accentuation mapping in the comprehension of sentences with only by advanced L2 learners of English whose L1 is either Cantonese or Dutch. The interpretation of focus in only-sentences poses greater demands than sentences without only because L2 learners need to integrate prosodic information into their semantic parsing to compute the truth conditions of the sentences, apart from pragmatic processing. In our study, accentuation in sentences with only plays a more crucial role because one cannot compute the correct meaning of the sentences without noticing where the accentuation is. Our aim is to determine whether a structure involving both internal interface (i.e., the use of only and accentuation affects the semantic meaning of the sentence) and external interface (i.e., the use of only and accentuation affects the pragmatic felicity of the sentence) is problematic for advanced L2 learners. By involving both Cantonese learners and Dutch learners, we can also examine whether L1–L2 differences (if any) are due to less developed representation or less efficient processing. We pose three research questions as follows:
1. Is the comprehension of focus-to-accentuation mapping in sentences with only problematic for advanced Cantonese learners of English and Dutch learners of English?
2. If L2 learners have difficulty in comprehending focus-to-accentuation mapping in sentences with only, is it because they cannot perceive accentuation in English sentences in the first place?
3. If L2 learners cannot comprehend focus-to-accentuation mapping in the same way as English controls, how do we account for the L1–L2 differences?
Two experiments were conducted to address the three research questions, in accordance with research ethical procedures at the universities where the experiments took place. Experiment 1 examined L2 learners’ comprehension of focus-to-accentuation mapping in sentences with only. Experiment 2 tested whether L2 learners could correctly perceive accentuation in sentences with only.
Regarding the first research question, it is unclear whether the comprehension of focus-to-accentuation mapping in English only-sentences, which involves the syntax-prosody-semantics interface (internal interface) and the syntax-prosody-pragmatics interface (external interface), would be problematic for advanced L2 learners in accordance with the IH. In terms of the second research question, Dutch learners are expected to show nativelike performance, given the similarities between Dutch and English in focus realization. Cantonese learners, however, might find it difficult to perceive accentuation in English sentences with only.
Regarding the underlying mechanism of L1–L2 differences, the two accounts would give rise to different hypotheses. According to the representational account, L2 learners’ knowledge of focus realization would lead to L2 comprehension difficulty. Given the similarities between Dutch and English as well as differences between Cantonese and English in focus realization, the representational account would predict nativelike comprehension patterns in Dutch learners but nonnativelike performance in Cantonese learners in Experiment 1. In accordance with the processing account, L2 learners’ difficulty of comprehending the focus-to-accentuation mapping is due to their reduced processing efficiency. Thus, both Cantonese learners and Dutch learners would show difficulty in comprehending focus-to-accentuation mapping in sentences with only, regardless of the L1–L2 pairs.
EXPERIMENT 1: THE “MAKE-SENSE” JUDGMENT
In this experiment, we adopted Birch and Clifton’s (Reference Birch and Clifton1995) RT paradigm, which was also used in Chen (Reference Chen2010). Similar design has been widely used in other studies on focus comprehension (e.g., Clifton Jr. & Frazier, Reference Clifton and Frazier2016; Ito, Reference Ito2002; Yan & Calhoun, Reference Yan and Calhoun2019). On each trial, participants first listened to a short story and were presented with a question-answer dialogue about the short story on each trial. They were then asked to judge whether the answer made sense as a response to the question. The answer sentences were systematically varied in accentuation such that either the verb or object was accented, leading to either contextually appropriate or inappropriate prosodic patterns. Participants’ judgments and RTs were measured. If participants were able to successfully comprehend focus-to-accentuation mapping, they were expected to show more “YES” judgments and faster speed in the cases of appropriate accentuation than in the cases of inappropriate accentuation.
Method
Participants
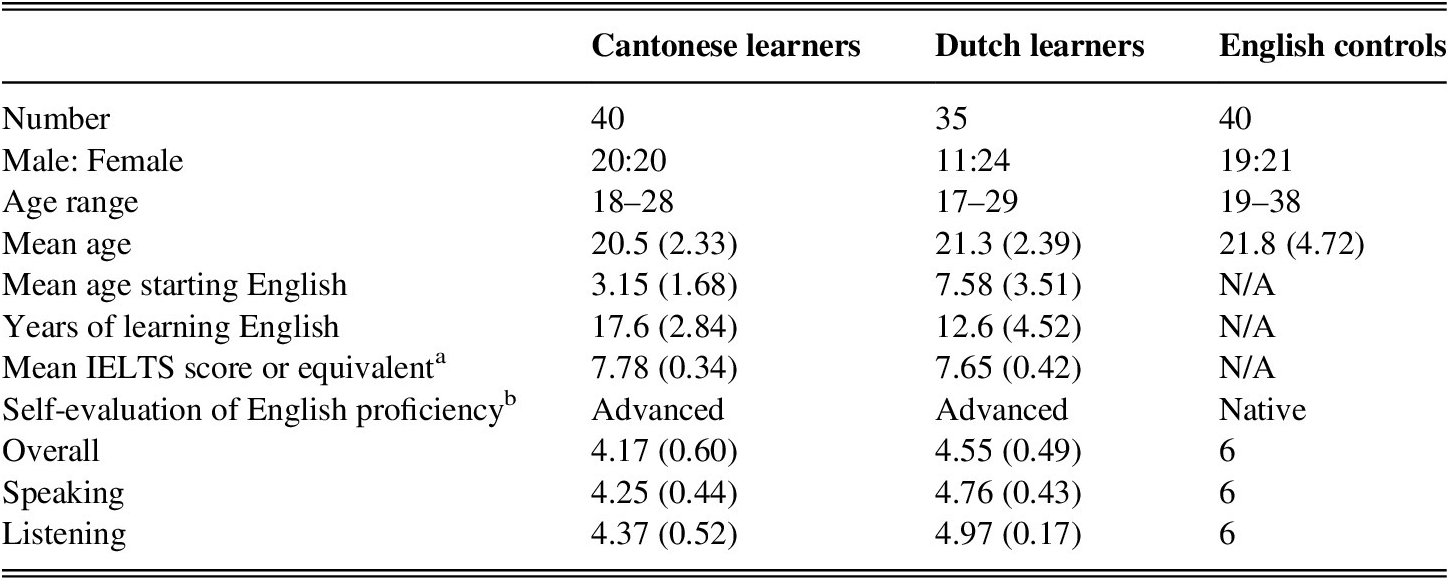
Forty Cantonese learners and thirty-five Dutch learners participated in Experiment 1, together with a control group of 40 native speakers of English. None of the participants reported deficits in vision or hearing. All participants filled in a language background questionnaire before proceeding to the experiment. The native speakers of English were exchange students studying in Hong Kong, of whom 19 spoke American English and 21 British English. They had quite limited or no proficiency of Cantonese, Mandarin, or other varieties of Chinese at the time of testing. The Cantonese learners of English were undergraduate students at a research university in Hong Kong, while the Dutch learners of English were undergraduate students majoring in English language and culture from a research university in the Netherlands. Both L2 groups were advanced learners of English. Although the Dutch learners rated themselves higher than the Cantonese learners in terms of overall English proficiency and listening, the Cantonese learners started learning English at a much younger age and had learned English for a much longer time than the Dutch learners. Crucially, there was no significant difference between the two L2 groups regarding their IELTS scores or equivalent (t(72) = 1.45, p = 0.15). Thus, the two L2 groups were matched for proficiency level in English. The background information of the three groups is summarized in Table 1.
Language background of L2 learners and English controls (SD in parentheses)

a The HKDSE English Language Examination scores for the Cantonese learners and the VWO scores for the Dutch learners were converted to IELTS scores, based on the standards between the IELTS and 2012 HKDSE English Language Examination conducted by Hong Kong Examinations and Assessment Authority (HKEAA) ( http://www.hkeaa.edu.hk/en/recognition/benchmarking/hkdse/ielts/).
b On a 1–6 scale: 1 = almost no knowledge/fluency/understanding, 2 = limited knowledge/fluency/understanding, 3 = some knowledge/fluency/understanding, 4 = good knowledge/fluency/understanding, 5 = excellent knowledge/fluency/understanding, 6 = native.
Design and Materials
A 3 × 2 × 2 design was used to manipulate Group (Cantonese learners, Dutch learners, English controls), Accentuation (appropriate, inappropriate), and Focus (object focus, verb focus). The short stories provided the participants with background information of the dialogues, introducing the agents, verbs and objects involved, as in (9).
(9) Story: The fox has some honey and an ice cream. She was going to lick and freeze both of them. Then she changed her mind.
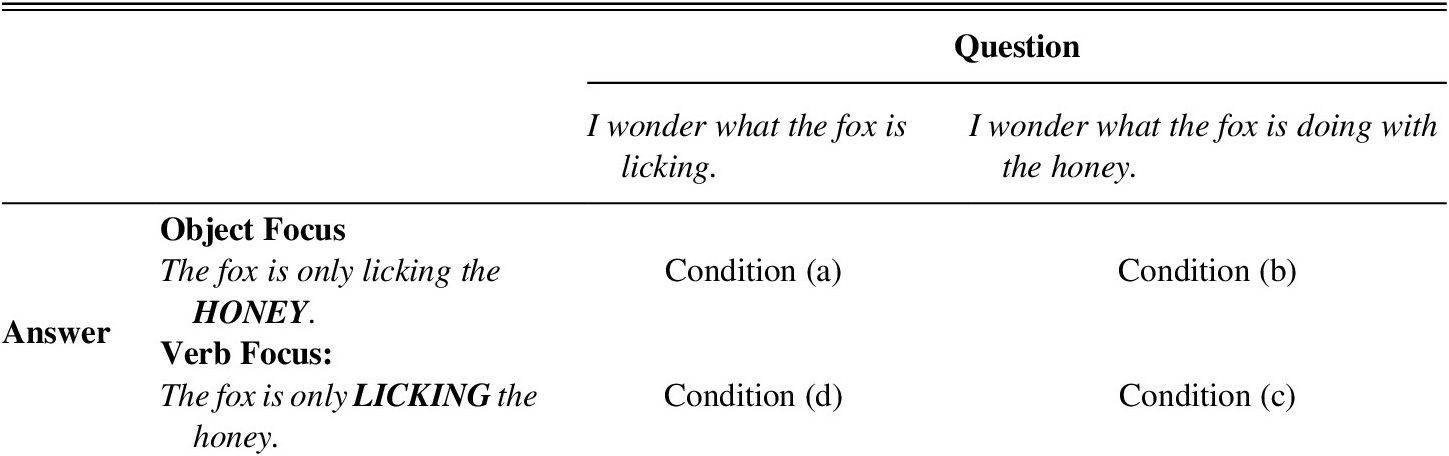
For the experimental dialogues, there were two versions of each question and two versions of each answer. One version of the questions set up object focus in the answers whereas the other version set up verb focus in the answers. The variable Accentuation (appropriate, inappropriate) was embedded in the answer sentences. Combining the two focus conditions and two accentuation conditions gave rise to four experimental conditions: Condition (a) object focus with appropriate accentuation, Condition (b) object focus with inappropriate accentuation, Condition (c) verb focus with appropriate accentuation, and Condition (d) verb focus with inappropriate accentuation. An example of the four conditions are illustrated in Table 2, where the accented target words are in bold and capital letters, and the subject noun in the answer (e.g., fox) always receives accentuation for the sake of phrasal level metrical well-formedness (Calhoun, Reference Calhoun2010).
An example of stimuli in four conditions in Experiment 1

To add variation to the stimuli, two types of fillers were included. The answers in the fillers were incorrect half of the time either because of semantic errors (e.g., referring to licking as drinking or fox as bear) or pronunciation errors (e.g., mispronouncing fox as fax). The accentuation was appropriate in half of the fillers with error-free answers, and inappropriate in the other half of the fillers with error-free answers. The same held for answers of the fillers that contained either semantic or pronunciation errors. In total, there were 160 experimental dialogues and 160 fillers, distributed over the four conditions using a Latin Square design. Four lists of dialogues were created such that each dialogue appeared in every experimental condition but not in the same list. Each participant was presented with only one list, including 80 dialogues (4 experimental conditions × 10 experimental dialogues + 20 fillers with errors + 20 error-free fillers). All the stimuli were cross-checked by two native speakers of English (one American English–speaking female and one British English–speaking male) to make sure the experimental sentences were natural.
The stimuli were recorded by a male native speaker of British English at 44.1 kHz sampling frequency with 16 bits resolution in a recording booth. He was asked to produce the stimuli as naturally as possible with appropriate accentuation. To create stimuli with inappropriate accentuation, the answers to the object-focus questions were combined with the verb-focus questions, and the answers to the verb-focus questions were combined with the object-focus questions. The intensity of all stimuli was normalized to 70 dB.
To ensure that accentuation was placed in the right position, the answer sentences of the experimental dialogues were subjected to a phonetic analysis using Praat. There was no difference between the two conditions in terms of the overall duration of the answer sentence (t(78) = 0.692, p = 0.49). The peak height of the verb was significantly higher in the verb-focus condition than in the object-focus condition (t(78) = −23.02, p < 0.001), and the peak height of the object in the object-focus condition was significantly higher than in the verb-focus condition (t(78) = 19.37, p < 0.001). The mean pitch of the verb was significantly higher in the verb-focus condition than in the object-focus condition (t(78) = −16.62, p < 0.001), and the mean pitch of the object was much higher in the object-focus condition than in the verb-focus condition (t(78) = 18.67, p < 0.001). Although there was no difference between the two conditions in the mean duration of the verb (t(78) = −0.31, p = 0.76), the object duration in the object-focus condition was significantly longer than in the verb-focus condition (t(78) = 2.84, p = 0.006).
Procedure
Each testing session began with eight practice trials, aiming to familiarize the participants with the experiment. Each trial was set up in E-Prime 2.0 as follows. First, a cross appeared in the center of the screen. A short story was played 1,000 ms after the appearance of the cross. Then, a question-answer sequence was played right after the story with a 2,000-ms interval between the question and the answer. The two options, “YES or NO,” were displayed on the screen at the end of the answer. The participants were instructed to rest their thumbs on a RT box and press the button to indicate their response as quickly as possible, but not before the end of the answer sentence. If the answer made sense as a response to the question, they were asked to press the “YES” button (on the left side of the RT box), otherwise the “NO” button (on the right side of the RT box). “YES–NO” judgments and RTs were recorded at the end of each answer sentence until a button was pressed using E-prime. The participants could take a break of any length in the middle of the task. It took each participant 30–40 minutes (Mean = 33 minutes) to complete the experiment. The participants were unaware of the purpose of the experiments. Each participant received 5 Euros or equivalent for completing both Experiment 1 and Experiment 2.
Data Analysis
Only RTs in the experimental trials where the answers were judged to “make sense” were included for further analysis. Raw RTs smaller than 100 ms or above 4,000 ms were further excluded. We conducted the Shapiro–Wilk test on the remaining raw RTs in the R statistical program (R Core Team, 2018) to examine its normality. As the RTs were not normally distributed (W = 0.765, p < 0.001), we log-transformed the RT data to reduce the nonnormality of residuals. To measure the task reliability, we carried out a reliability analysis on the log-transformed RTs comprising 160 items in the R statistical program, using the psych package (Revelle, Reference Revelle2019). Cronbach’s alpha showed that the task reached acceptable reliability (α = 0.861).
To examine whether language background, accentuation appropriateness, and focus position affect L1 and L2 speakers’ comprehension of focus-to-accentuation mapping, we used logit or linear mixed-effects models in the lme4 package (Bates et al., Reference Bates, Kliegl, Vasishth and Baayen2015a) for all analyses in the R statistical program. In the models, we included fixed factors of Group (Cantonese learners, Dutch learners, English controls), Accentuation (appropriate, inappropriate), and Focus (object focus, verb focus) with Participant as a random factor. The dependent variables are “YES–NO” judgment (YES = 1, NO = 0) and log-transformed RTs. For each dependent variable, we took the backward elimination approach, starting with a model that included all fixed effects, the random factor, and all interactions between them (the most complex model) (Bates et al., Reference Bates, Mächler, Bolker and Walker2015b). Then, we used the “step” function in the lmerTest package (Kuznetsova et al., Reference Kuznetsova, Brockhoff and Christensen2017) to reduce the models by eliminating nonsignificant fixed and random factors or interactions using the default selection criteria as set by the “step” function. If there were significant interactions between fixed factors (e.g., Group and Accentuation), we conducted further analyses on the interaction effects using subsequent models separately. The best-fit models for the “YES–NO” judgments and log-transformed RTs are presented in the following section.
Results
“YES–NO” Judgments
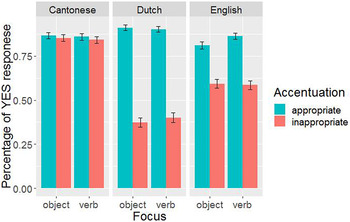
The mean proportion of “YES” responses in Experiment 1 is shown in Figure 1.
Mean percentage of YES response in L2 learners and English controls in Experiment 1. Error bars indicate ± 1SE.

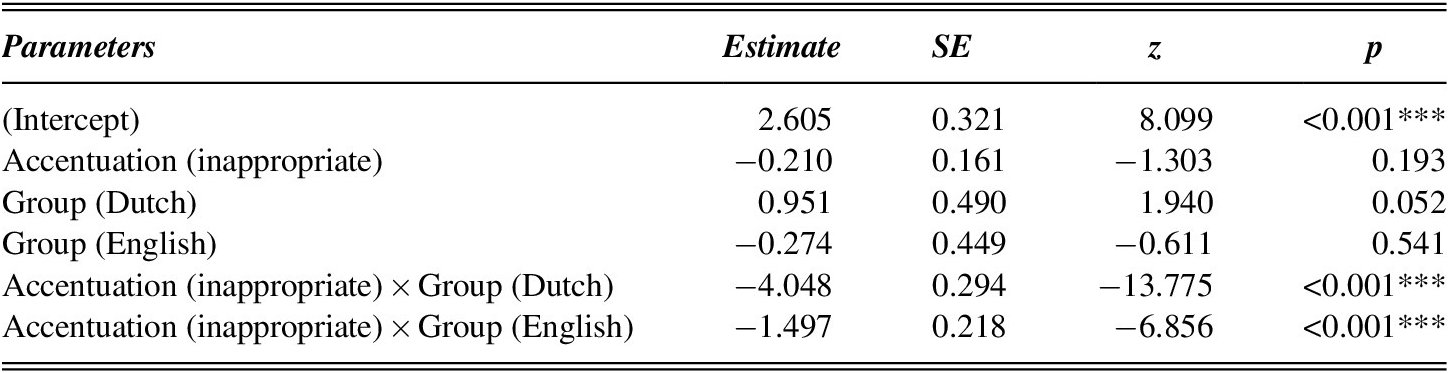
The model with the best fit included the fixed factors of Group, Accentuation, and their interaction, as summarized in Table 3. The factor Focus (object focus, verb focus) did not improve the model, suggesting a lack of evidence that participants’ performance changed with different focus positions in a similar way. Importantly, the model yielded a significant two-way interaction between Group and Accentuation, indicating that the three groups differed in judging stimuli with inappropriate accentuation.
Best-fit model for YES–NO judgments of L2 learners and English controls in Experiment 1

Note: Intercept in Table 3 represents Cantonese learners and appropriate accentuation. ***p < 0.001.
To understand the nature of the two-way interaction between Group and Accentuation, subsequent logit mixed-effects models were performed on the participants’ “YES–NO” judgments for each group. The main effect of Accentuation was found in both English controls and Dutch learners but absent in Cantonese learners. English controls’ proportion of “YES” was significantly higher in the appropriate-accentuation condition than in the inappropriate-accentuation condition (Estimate = −1.693, SE = 0.147, z = −11.494, p < 0.001). In terms of Dutch learners, they gave significantly more “YES” response to stimuli with appropriate accentuation than stimuli with inappropriate accentuation (Estimate = −4.397, SE = 0.258, z = −17.035, p < 0.001). However, Cantonese learners made “YES” judgments at a similar rate for both appropriate and inappropriate accentuation.
To further compare Dutch learners and English controls, we performed logit mixed-effects models on the two groups’ “YES–NO” response. There were a main effect of Group, a main effect of Accentuation and more importantly a two-way interaction between Group and Accentuation. Specifically, Dutch learners gave significantly more “YES” response than English controls when accentuation was appropriate (Estimate = −1.246, SE = 0.529, z = −2.358, p = 0.018), and significantly more “NO” response to stimuli with inappropriate accentuation than native controls did (Estimate = 2.593, SE = 0.289, z = 8.96, p < 0.001).
Reaction Times
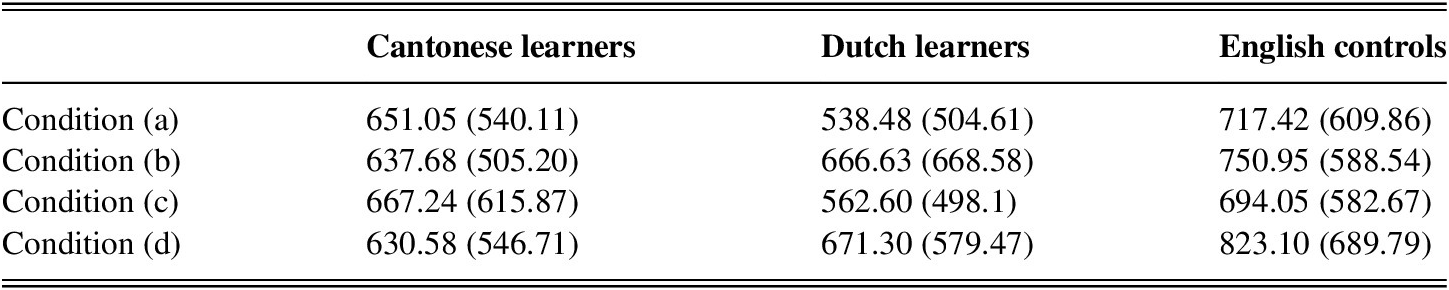
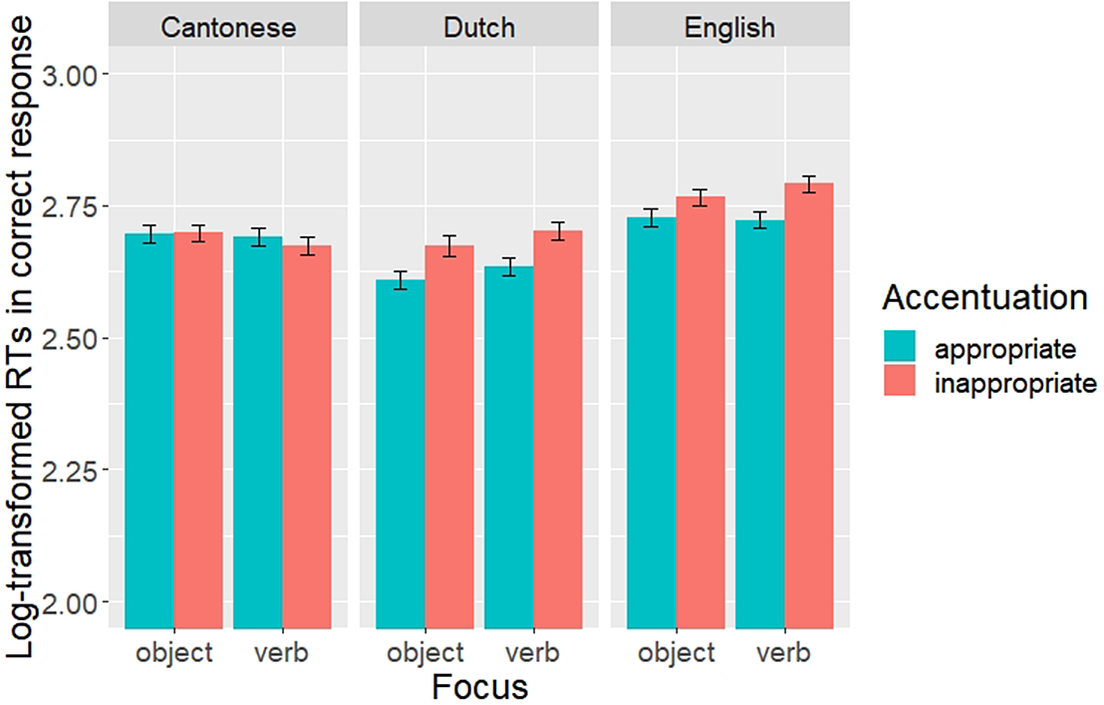
The mean RTs and log-transformed RTs of the three groups in four conditions are given in Table 4 and Figure 2. Cantonese learners showed similar RTs across the four conditions. By contrast, Dutch learners and native controls showed longer RTs for answers with inappropriate accentuation than those with appropriate accentuation.
Mean RTs (ms) (SD in parentheses) of L2 learners and English controls in four conditions of Experiment 1

Note: Condition (a) object focus with appropriate accentuation; Condition (b) object focus with inappropriate accentuation; Condition (c) verb focus with appropriate accentuation; Condition (d) verb focus with inappropriate accentuation
Mean log-transformed RTs in L2 learners and English controls in Experiment 1. Error bars indicate ± 1SE.

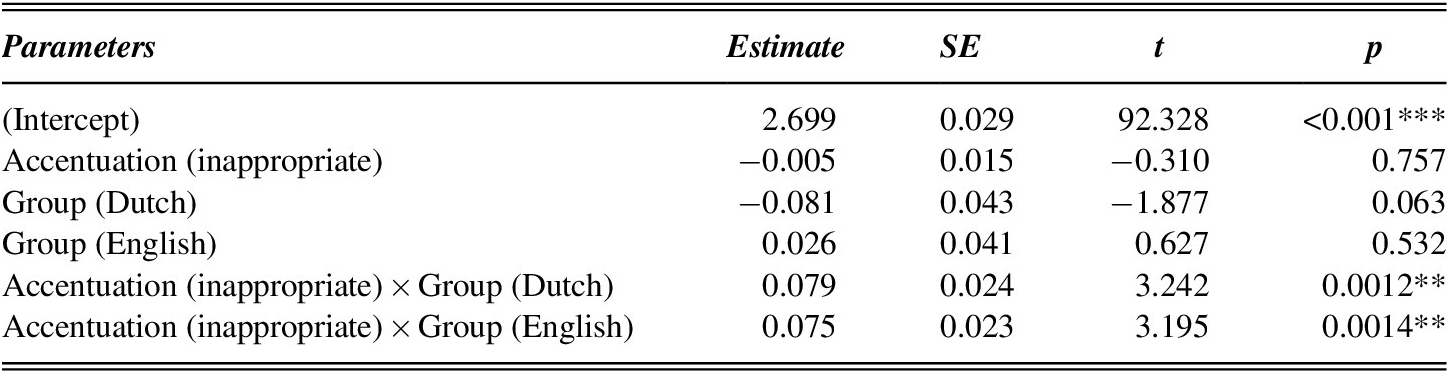
Recall that a linear mixed-effects model was applied to participants’ log-transformed RTs to examine the effects of Group, Accentuation, Focus, and their interactions. The best-fit model included the effects of Group, Accentuation, and their interactions. Again, the factor Focus did not improve the model and was thus excluded. A summary of the model results is presented in Table 5. Crucially, there was also a two-way interaction between Group and Accentuation.
Best-fit model for log-transformed RTs of L2 learners and English controls in Experiment 1

Note: Intercept in Table 5 represents Cantonese learners and appropriate accentuation; **p < 0.01; ***p < 0.001.
To further examine the two-way interaction between Group and Accentuation, subsequent linear mixed-effect models were performed on log-transformed RTs for stimuli with appropriate and inappropriate accentuation within each group separately. Regarding native controls, they were significantly faster in responding to stimuli with appropriate accentuation than stimuli with inappropriate accentuation (Estimate = −0.070, SE = 0.017, t = 4.046, p < 0.001). Similar patterns were found in Dutch learners: appropriate accentuation triggered significantly faster speed than inappropriate accentuation did (Estimate = 0.074, SE = 0.019, t =3.869, p < 0.001). Nonetheless, Cantonese learners showed similar RTs to stimuli with appropriate and inappropriate accentuation, which was completely different from English controls and Dutch learners.
Comparing Dutch learners and English controls, we performed further linear mixed-effects models on their log-transformed RTs between the two groups. The results showed a main effect of Accentuation whereby appropriate accentuation led to shorter RTs than inappropriate accentuation, and more importantly a main effect of Group (Estimate = 0.105, SE = 0.042, t = 2.485, p = 0.015), indicating that Dutch learners were significantly faster than English controls in deciding that a response made sense regardless of whether the focus-to-accentuation mapping was appropriate or not.
Discussion
In Experiment 1, appropriate accentuation triggered more “YES” judgments than inappropriate accentuation did in both Dutch learners and native controls. Cantonese learners, however, treated both appropriate and inappropriate accentuation as indistinguishable and judged both similarly, regardless of focus position. In deciding whether an answer made sense for the question, Dutch learners and native controls were faster in the appropriate-accentuation condition than in the inappropriate-accentuation condition, independent of focus position. The effect of Accentuation was, however, again absent in Cantonese learners, whose comprehension was not slowed down in the inappropriate-accentuation condition. Our results thus indicate that accentuation can affect how accurately and fast Dutch learners and native controls comprehend focus in English sentences with only, whereas it plays little role in Cantonese learners’ L2 comprehension of focus in English only-sentences.
Apart from the similarities between Dutch learners and native speakers of English, there were some differences between the two groups. Dutch learners significantly assigned more “YES” responses to answers with appropriate accentuation and more “NO” responses to answers with inappropriate accentuation than English controls. Furthermore, Dutch learners were significantly faster than English controls in judging that a response made sense, regardless of whether the focus-to-accentuation mapping was appropriate or not. These results suggest that although Dutch learners patterned with native controls, unlike Cantonese learners, they exhibited differences of a gradient nature, compared to native controls.
A further question arising from the results of Experiment 1 is whether Cantonese learners’ nonnativelike performance was due to their difficulty in correctly perceiving accentuation at phrasal level in English only-sentences in the first place. This is not unlikely considering that prosodic prominence is mainly achieved by pitch in English, but using duration in Cantonese. A second experiment was needed to examine whether L2 learners, especially Cantonese learners, could correctly perceive accentuation in English only-sentences.
EXPERIMENT 2: PERCEPTION OF ACCENTUATION
We thus conducted Experiment 2 to examine L2 learners’ perception of accentuation in English sentences with only. If L2 learners, especially the Cantonese learners, failed to perceive accentuation in English sentences, their nonnativelike performance might be attributed to their insensitivity to accentuation in English.
Method
Participants
The same groups of participants as in Experiment 1 took part in Experiment 2.
Design and Materials
A 3 × 2 design was used to manipulate the fixed factors: Group (Cantonese learners, Dutch learners, English controls) and Accentuation (object-accented, verb-accented). Two conditions of experimental sentences were constructed, one with accentuation on the object and the other on the verb. Examples of the experimental items are illustrated in (10).

Twenty-four fillers with accentuation on the subject were added. A Latin Square was used to distribute the stimuli over the experimental conditions. Two lists were created. In each list, the stimuli were pseudo-randomized. Thus, each participant heard one list with 32 stimuli in total (20 experimental items + 12 fillers).
As in Experiment 1, similar phonetic analyses were carried out in Praat on the experimental stimuli to check the placement of accentuation. No significant difference was found between the two conditions in the overall duration of the stimuli (t(38) = −0.69, p = 0.49). The mean peak pitch of the verb was significantly higher in the verb-accented condition than in the object-accented condition (t(38) = −26.63, p < 0.001), and the mean peak pitch of the object was significantly higher in the object-accented condition than in the verb-accented condition (t(38) = 7.69, p < 0.001). Similarly, the mean pitch of the verb was significantly higher in the verb-accented condition than in the object-accented condition (t(38) = −17.09, p < 0.001), and the mean pitch of the object was significantly higher in the object-accented condition than in the verb-accented condition (t(38) = 9.3, p < 0.001). The mean duration of the verb in the verb-accented condition was significantly longer than in the object-accented condition (t(38) = −3.2, p = 0.0026), whereas the mean duration of object was marginally longer in the object-accented condition than in the verb-accented condition (t(38) = 1.86, p = 0.071).
Procedure
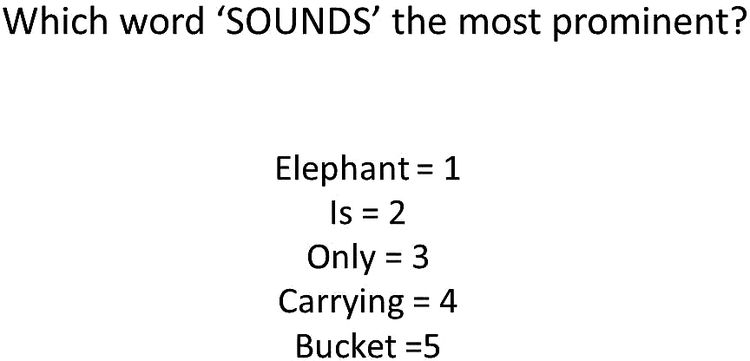
The same set of E-Prime equipment was used in Experiment 2. The participants first heard a sentence and then judged which part of the sentence sounded the most prominent. Each testing session started with three practice trials, on which participants were familiarized with the task. The timeline of a trial was as follows. A cross appeared on the screen. A sentence was played 1,000 ms after the appearance of the cross. At the end of the sentence, the words occurred in the sentences were immediately displayed on the screen, labeled with numbers. To facilitate the experiment, functional words, that is, the, were omitted for display, resulting in five words appearing on the screen in each trial (Figure 3).
An example of visual displays in Experiment 2.

Buttons of the RT box were labeled with numbers “1–5.” The participants were requested to pick out the acoustically most prominent word by pressing the corresponding button as quickly as possible. The next trial was automatically initiated after a response was made. The testing session lasted for 5 minutes on average for each participant.
Data Analysis
Data analyses were performed similarly to those of Experiment 1. First, only raw RTs from the trials where correct responses were given were included for further analysis. The remaining RTs were log-transformed due to their nonnormal distribution (W = 0.886, p < 0.001). A reliability analysis was conducted on the log-transformed RTs comprising 40 items in the R statistical program. A good measurement of reliability was observed according to Cronbach’s alpha (α = 0.946).
Logit mixed-effects models were performed for accuracy rate (1 = correct, 0 = incorrect), and linear mixed-effects models were conducted for log-transformed RTs. The fixed factors included Group (Cantonese learners, Dutch learners, English controls) and Accentuation (object-accented, verb-accented) with Participant as a random factor. Similar to Experiment 1, we fitted the models in R and used the “step” function to select the best-fit model that accounted for significantly more of the variance than simpler models, following the backward elimination approach. Only the results of the model with the best fit are presented in the following section.
Results
Accuracy Rate
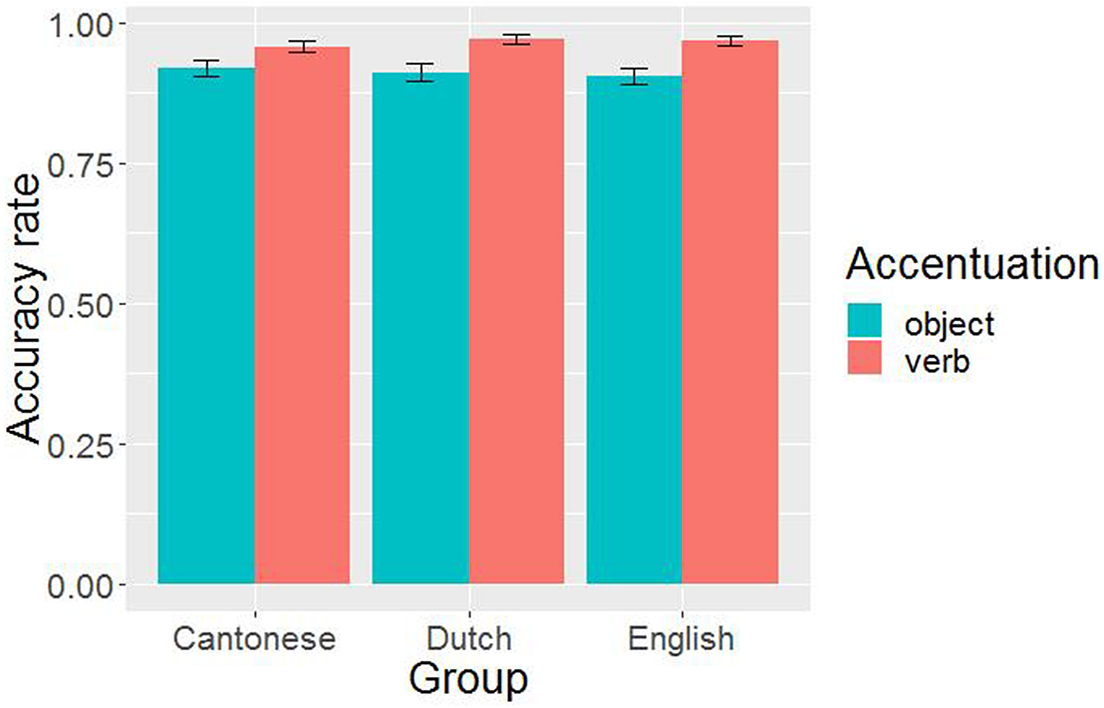
All three groups demonstrated a high accuracy rate, as shown in Figure 4.
Mean accuracy rate of L2 learners and English controls in Experiment 2. Error bars indicate ± 1SE.

The best-fit model only included Accentuation (object-accented, verb-accented), indicating that there was no significant effect of Group or interaction between Group and Accentuation, as summarized in Table 6. The results suggest that L2 learners and native controls were significantly more accurate in perceiving accentuation on the verb than on the object, with no difference among groups.
Best-fit model for accuracy rate of L2 learners and English controls in Experiment 2

Note: Intercept in Table 6 represents object-accented; ***p < 0.001.
Reaction Times
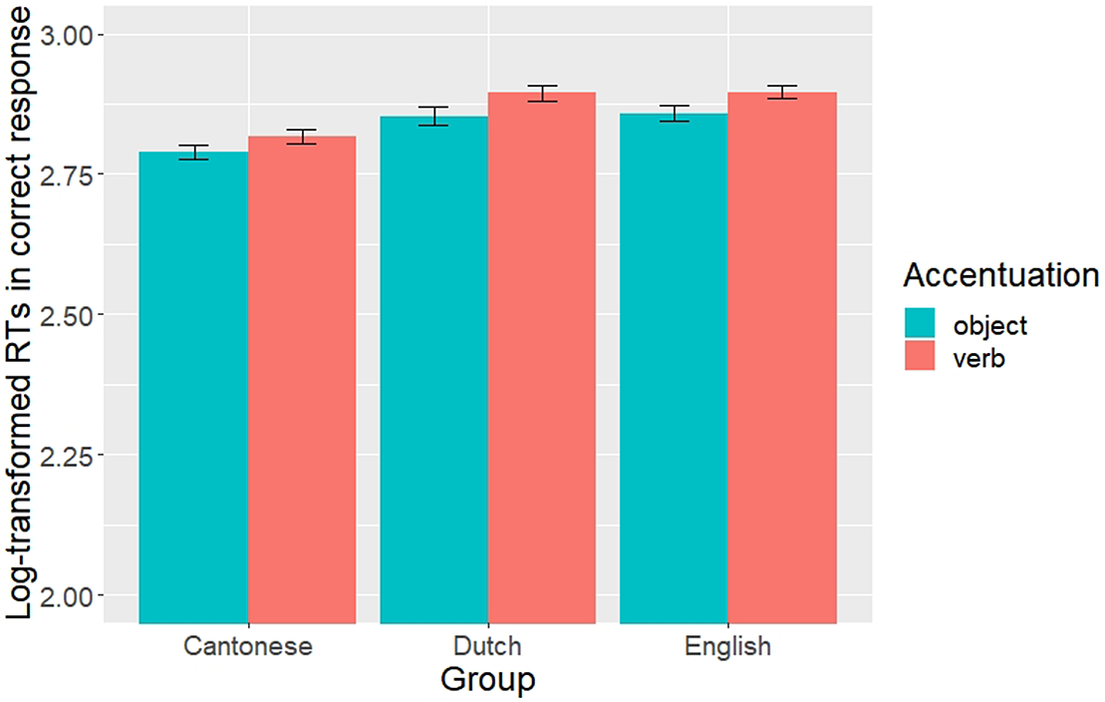
The mean RTs and log-transformed RTs for perceiving object-accentuation and verb-accentuation in L2 learners and English controls are given in Table 7 and Figure 5, respectively.
Mean RTs (ms) (SD in parentheses) of L2 learners and English controls in object-accented and verb-accented conditions of Experiment 2

Mean log-transformed RTs of L2 learners and English controls in Experiment 2. Error bars indicate ± 1SE.

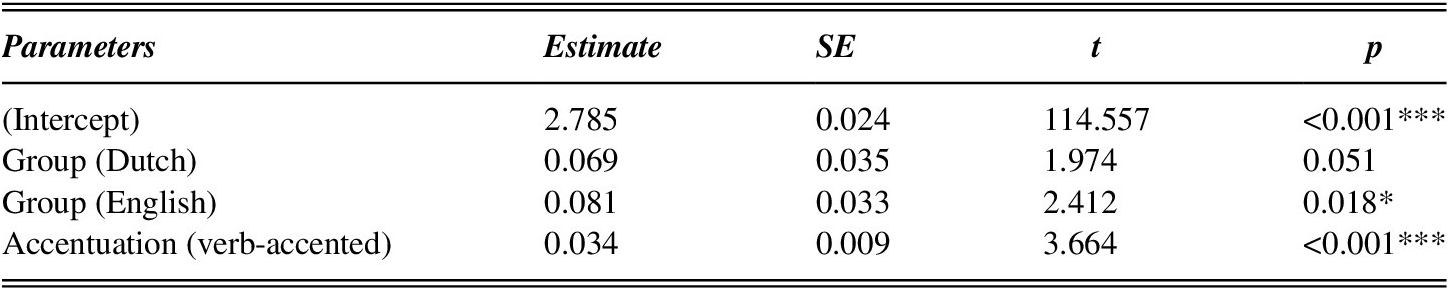
The model with the best fit (Table 8) indicates a main effect of Group (Cantonese learners, Dutch learners, English controls) and a main effect of Accentuation (object-accented, verb-accented). There was no significant interaction. The model results in Table 8 suggest that all the participants, independent of their language background, responded faster in the object-accented condition than in the verb-accented condition.
Best-fit model for log-transformed RTs of L2 learners and English controls in Experiment 2

Note: Intercept in Table 8 represents Cantonese learners and object-accented; *p < 0.05; ***p < 0.001.
To further investigate the effect of Group, subsequent linear mixed-effect models were performed on the three groups (Cantonese learners vs. English controls, Dutch learners vs. English controls, Cantonese learners vs. Dutch learners). Cantonese learners had significantly shorter RTs than English controls, regardless of Accentuation (Estimate = 0.082, SE = 0.037, t = 2.205, p = 0.030). In terms of Dutch learners and English controls, no main effect of Group was found, indicating no significant difference between the two groups. Cantonese learners responded significantly faster than Dutch learners, both when object was accented (Estimate = 0.069, SE = 0.033, t = 2.128, p = 0.037) and when verb was accented (Estimate = 0.036, SE = 0.012, t = 2.942, p = 0.003). These results suggest that while Dutch learners performed like the English controls, Cantonese learners were even faster in perceiving accentuation than English controls and Dutch learners across the conditions.
Discussion
Experiment 2 showed that the L2 learners of English were sensitive to the placement of accentuation in English only-sentences at a phrasal level. They detected the position of accentuation as accurately as the native speakers. In deciding which word sounded the most prominent, Cantonese learners were even faster than the other two groups, regardless of the position of accentuation. We discuss the possible reasons for faster responses in Cantonese learners in the following section. Altogether, the results of Experiment 2 provide evidence that the L2 learners had no difficulty in correctly and speedily perceiving accentuation at phrasal level in English sentences with only in the first place.
GENERAL DISCUSSION
We have examined how Cantonese learners and Dutch learners comprehended the mapping between focus and accentuation in English sentences with only, compared to native speakers of English. We conducted two experiments on these two groups of L2 learners and native controls.
First, we asked whether the comprehension of focus-to-accentuation mapping in English sentences with only was problematic for advanced L2 learners of English. In Experiment 1, Cantonese learners differed significantly from English controls. They could not comprehend focus-to-accentuation mapping in English sentences with only at all. The effect of accentuation on focus comprehension was absent in Cantonese learners, despite their advanced English proficiency. In contrast, Dutch learners showed the same comprehension patterns as the English controls: they were significantly slower and assigned significantly fewer “YES” responses to inappropriate focus-to-accentuation than appropriate focus-to-accentuation. However, there were gradient differences between Dutch learners and English controls. The difference in the number of “make-sense” judgments between the two accentuation conditions was bigger in Dutch learners than in English controls. Moreover, Dutch learners were faster than native speakers of English in deciding that a response made sense regardless of whether the focus-to-accentuation mapping was appropriate or not. It thus seems that focus-to-accentuation mapping in English sentences with only was problematic to Cantonese learners but not to Dutch learners.
With regard to the second research question, we asked whether L2 learners could perceive accentuation in English sentences. The results from Experiment 2 showed that both Cantonese learners and Dutch learners were able to perceive accentuation in English sentences with only as accurately as the native controls. Crucially, Cantonese learners could detect the position of accentuation even faster than native controls and Dutch learners, despite the fact that pitch is not primarily used in Cantonese to realize focus. Thus, these results suggested that L2 learners could perceive accentuation in English only-sentences. Cantonese learners’ nonnativelike performance in comprehending focus-to-accentuation mapping in Experiment 1 must be attributed to other factors.
We now consider why Cantonese learners were faster than English controls and Dutch learners in perceiving the placement of accentuation in English only sentences. One possibility could be related to the nature of the RT paradigm in which participants were asked to make response as quickly as possible.Footnote 3 However, note that while all the three groups of participants were given the same instruction, only Cantonese learners differed from the native controls and Dutch learners. We thus think it unlikely that the RT paradigm could explain the faster speed observed in Cantonese learners but not in the other two groups. Another possibility could be that Cantonese learners simply perceived accentuation in English sentences without mapping it to focus, whereas the native controls and Dutch learners associated accentuation with focus, which may increase computational demands and thus take longer time for making judgments. Cantonese learners could detect accentuation at the phrasal level in English, but had difficulty in integrating prosodic information to focus comprehension, indicating a lack of mapping between focus and accentuation. We think that this line of explanation is more appealing. Cantonese learners’ faster speed in perceiving the placement of accentuation in Experiment 2 was in fact consistent with their nonnativelike performance in Experiment 1.
A further remark concerns the asymmetry in the perception of accentuation in English only-sentences. Beyond the group differences, the results from Experiment 2 showed a significantly higher accuracy rate in the verb-accented condition than in the object-accented condition. However, all three groups, regardless of their L1 background, were faster in detecting accentuation on the object than on the verb. We interpret this asymmetry in perceiving object-accentuation and verb-accentuation as a trade-off between faster speed and reduced accuracy. According to Zubizarreta (Reference Zubizarreta, Fery and Ishihara2016), the right-most element receives prosodic prominence by default. English is a SVO language and the object position carries accentuation by default. This might explain why the three groups were faster in detecting accentuation on the object than on the verb, as reflected in their RTs. There might be a trade-off between faster speed and reduced accuracy in mapping accentuation and focus: participants spent more time in deciding the position of accentuation when it was placed on the verb, which might also explain why all groups were more accurate in the verb-accented condition than in the object-accented condition. The speed-accuracy relationship and how the Nuclear Stress rule affects the perception of accentuation in L1 and L2 speakers might be tested in further studies.
Finally, we asked how to account for the differences between L2 learners and English controls within the frame of the IH. Previous studies have suggested two possible accounts for explaining the comprehension difficulty in advanced L2 learners. According to the representational account, Dutch learners would pattern with English controls, whereas Cantonese learners would differ from English controls. In contrast, the processing account predicted that both Cantonese learners and Dutch learners would have difficulty in comprehending focus-to-accentuation mapping in English sentences with only. We have observed comprehension difficulty in Cantonese learners but not in Dutch learners. Our results were more in line with the representational account. It seems that Cantonese learners had not mapped accentuation to focus in their L2 English comprehension, although they were sensitive to the placement of accentuation in English only sentences. Dutch learners matched closely with English controls, showing similar within-group comprehension patterns: more “make-sense” judgments and shorter RTs in the appropriate-accentuation condition than in the inappropriate-accentuation condition. Furthermore, the gradient differences between Dutch learners and English controls cannot be interpreted as evidence of “less efficient processing in comprehending multiple interfaces in L2.” Rather, Dutch learners seemed to be more efficient than English controls. They exhibited a sharper response to different accentuation conditions and faster speed in making the make-sense judgments, relative to native speakers of English. This apparently more efficient processing in Dutch learners might be explained by the similarities between Dutch and English in focus-to-accentuation mapping. Such similar representation of focus-to-accentuation mapping may create the possibility for L2 bootstrapping and thus facilitate Dutch learners’ L2 comprehension. The sharper response to different accentuation conditions may also be related to Dutch learners’ oversensitivity to inappropriate focus-to-accentuation mapping as a result of learning. The faster speech in making the “make-sense” judgments may also be explained by a desire to perform well in their L2.
Our findings complement and extend previous work in a number of ways. First, our study contributes to the field of L2 acquisition by exploring how advanced L2 learners comprehend multiple interfaces as well as the underlying mechanism of L1–L2 differences, from the perspective of two typologically divergent and genetically unrelated L1s. So far most studies on interface structures in L2 acquisition have investigated the syntax-pragmatics interface. Our study has taken our understanding of interface acquisition in L2 learners a step forward, by investigating a new domain of investigation. Our study in general suggests that multiple interface structures involving both internal and external interfaces are not always problematic to advanced L2 learners and nativelike performance is possible. Moreover, our findings indicate that L2 learners performance cannot be accounted for on the basis of less efficient processing, but may be attributed to less detailed representation.
Second, we have systematically controlled the level of English proficiency in L2 learners tested in our study. The differences between the two L2 groups tested here could not be attributed to their proficiency in English. As one may recall, the Dutch learners and the Cantonese learners were matched in their English proficiency level. Moreover, the Cantonese learners started learning English at an earlier age and had been exposed to English for longer than the Dutch learners. Nevertheless, it was the Dutch learners that patterned closely with the native controls. This can be interpreted as further evidence that less detailed representation of focus-to-accentuation mapping is behind the differences between the two L2 groups.
An additional empirical dimension offered by our study involves the nonnativelike performance in advanced Cantonese learners. Our findings suggest that the mapping between focus and accentuation is problematic for L2 learners whose L1 differs from English in this respect, even at a high level of proficiency. English prosody has never been the focus of L2 classroom instruction in Cantonese contexts. We take the L2 processing difficulty found in our study as a strong reason to promote the teaching of prosody for L2 learners at school. Our findings have implications for English curriculum design and classroom practice, especially for how to develop teaching materials to enhance the use of prosody in Cantonese learners of English.
Much work still remains to be done in this line of research. Our online data are based on measurements tapping into the end stage of a L2 comprehension process. L2 learners may reach the same accuracy in comprehension and at a similar speed, but may have undergone a different processing path relative to native speakers. It is unknown how L2 learners process focus-to-accentuation mapping in real time as sentences unfold. Further research is thus needed to investigate the processing of the focus-to-accentuation interface in L2 learners, using methods such as eye-tracking to tap into the underlying processes.
CONCLUSION
Our cross-linguistic study examined L2 comprehension of focus-to-accentuation mapping in English sentences with focus particle only, by comparing two groups of L2 learners of English whose L1 was either Dutch or Cantonese. Our results showed that accentuation affected how accurately and how fast Dutch learners and English controls interpreted focus, whereas it played little role in Cantonese learners’ L2 comprehension of focus. We also showed that Cantonese learners’ difficulty in mapping accentuation to focus was not due to inability to perceive the placement of accentuation in English sentences. Furthermore, Dutch learners appeared to show more efficient processing in comprehending focus-to-accentuation mapping than English controls did. Together, our findings provide new empirical evidence that structures involving both internal and external interfaces are not equally problematic for advanced L2 learners. Our study also contributes to the ongoing discussion on the underlying mechanism of L1–L2 differences, showing that L2 learners’ comprehension difficulty of multiple interface cannot be explained by less efficient processing but may be attributed to a lack of representation of the interface. The challenge for future research will be to identify the underlying processes in L2 comprehension of multiple interfaces in a diversity of language combinations.