I. INTRODUCTION
To increase the capacitance and volume efficiency of BaTiO3-based base metal electrode (BME) multilayer ceramic capacitors (MLCC), the dielectrics having a high-dielectric constant are more and more required. One of the simplest methods to enhance the dielectric constant is to increase the grain size.Reference Arlt, Hennings and Dewith1–Reference Arlt5 However, the increase of grain size causes many side effects in the dielectric properties, such as an inferior dc-bias characteristic, that is, an abrupt decrease of dielectric constant by the application dc-field, and a high-aging rate, that is, a steep decrease of the dielectric constant by the lapse of time. Thus, ideally the dielectric constant should be increased without increasing the grain size.
In spite of the extensive studies for the grain size effect on the dielectric constant,Reference Arlt, Hennings and Dewith1–Reference Arlt5 however, those reports that studied the factors which influence the dielectric constant under the same grain size condition are very limited. Recently, it was reported that the dielectric constant can change significantly even under the same grain size condition in the submicron range depending on the excess Ba concentration in the additives that influences the A/B nonstoichiometry in the ABO3 structure.Reference Yoon, Kim, Kim and Kim6 The dopant incorporated ABO3 structure can change from A-site deficient to stoichiometric and then B-site deficient ABO3 depending on Ba concentration in additives, and the Ba concentration of the maximum dielectric constant corresponds to the stoichiometric ABO3 structure with A/B ratio being 1. This behavior can be correlated with the reported phenomena of BaTiO3 that the tetragonality and the magnitude of the spontaneous polarization under the same particle size condition are maximum when the Ba/Ti ratio is 1 and decrease when the ratio deviates from 1.Reference Lee, Rossetti, Liu and Randall7
It has been reported that donor-doped Pb(ZrxTi1−x)O3 (PZT) ceramics show much higher levels of domain wall motion than acceptor-doped PZT ceramics do, which causes more enhanced dielectric constants and piezoelectric coefficients.Reference Zhu, Fujii, Ren and Mckinstry8,Reference Garcia, Perez, Ochoa, Albareda, Lente and Eiras9 Donor incorporation in PZT reduces not only oxygen vacancy concentration but also the defect dipoles of oxygen vacancies that generate internal bias and reduce domain wall mobility. Thus, the similar effect of donor-dopant in PZT ceramics might also be expected in BaTiO3 ceramics.
The rare earth elements, such as Y, Dy, Ho, and Er, are well known to greatly improve reliability of acceptor-doped BaTiO3 dielectrics,Reference Hennings10–Reference Tsur and Randall14 and thus, widely used in BME MLCC industries. These elements are amphoteric dopants in BaTiO3 of which the role in improving the reliability has been suggested.Reference Tsur and Randall14 The deviation from A/B stoichiometry significantly enhances the flux oxygen vacancies along the grain boundaries resulting in a deterioration of reliability. The amphoteric dopants serve as buffers and maintain the overall A/B ratio close to one. Although there are a number of reports that mentioned the effect of rare earth elements on the reliability issue, those reports that studied their influence on the dielectric properties are very limited. These elements can act as either donor or acceptor depending on their site occupancy. It was experimentally demonstrated through thermally stimulated depolarization current analysis that when they behave as donor-dopants, they reduce the concentration of the defect dipoles associated with oxygen vacancies and thereby the dielectric aging.Reference Yoon, Lim, Kim and Kim13 Thus, the rare earth elements in BaTiO3 are also anticipated to have significant influence on the dielectric nonlinear behavior.
The dielectric constants of ferroelectric materials are generated by both intrinsic and extrinsic contributions.Reference Arlt and Pertsev15–Reference Herbiet, Tenbrock and Arlt17 The intrinsic dielectric constants originate from the lattice deformation, and those of extrinsic from the domain wall motion under the applied electric field. The extrinsic contribution is known to become more and more significant with the increase of domain wall density, which increases the dielectric constant.Reference Arlt and Pertsev15
As the dielectric properties of the high-capacitance MLCC are measured under quite high field condition due to thin dielectric thickness, the dielectric nonlinear behaviors should be considered. The polarization (P)–electric field (E) behavior of ferroelectric materials shows roughly a linear relation in the very low ac field range, but more and more nonlinear and hysteretic behaviors with increasing the driving ac field, and thus, the dielectric constant also changes accordingly. Such nonlinear behaviors are known to be caused by the pinning centers for the domain walls and their resultant irreversible motion.Reference Damjanovic18–Reference Mokry, Wang, Tagantsev, Damjanovic, Stolichnov and Setter20
These dielectric nonlinear responses can be effectively described and quantified by the Preisach model utilizing the first order reversal curve (FORC) distributions.Reference Robert, Damjanovic and Setter21–Reference Fujii, Trolier-Mckinstry and Nies25 The model describes a distribution of hysterons, that is, bistable units with different up- and down-switching fields α and β (α ≥ β), and that a hysteresis loop can be constructed by the sum of the responses from these hysterons. The polarization P can be calculated asReference Mayergoyz26
 $$P = \int {\int_{\alpha > \beta } {q\left( {\alpha ,\beta } \right)p\left( {\alpha ,\beta } \right){\rm{d}}\alpha {\rm{d}}\beta } + \int {k\left( \alpha \right){p_{{\rm{rev}}}}\left( \alpha \right){\rm{d}}\alpha } \quad ,}$$
where q(α,β) and k(α) are either +1 or −1 depending on the field history, and p(α,β) and p rev(α) are the Preisach distribution for irreversible (α > β) and reversible (α = β) hysteron, respectively. The Preisach distribution can be obtained by the FORC method, which is called a FORC distribution.Reference Mayergoyz26,Reference Stancu, Ricinschi, Mitoseriu, Postolache and Okuyama27 FORC are a family of descending curves of PE loops measured using an electric field, which increases from a negative saturation field −E max to a returning field α and decreases to −E max, where α increases from −E max to +E max. The polarization in any FORC curve is a function of both α and the instantaneous electric field β, that is, p(α,β). The irreversible and reversible FORC distributions are then defined asReference Mokry, Wang, Tagantsev, Damjanovic, Stolichnov and Setter20,Reference Robert, Damjanovic and Setter21
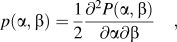 $$p\left( {\alpha ,\beta } \right) = {1 \over 2}{{{\partial ^2}P\left( {\alpha ,\beta } \right)} \over {\partial \alpha \partial \beta }}\quad ,$$
 $${p_{{\rm{rev}}}}\left( \alpha \right) = \mathop {\lim }\limits_{\beta \to \alpha - } {1 \over 2}{{\partial P\left( {\alpha ,\beta } \right)} \over {\partial \beta }}\quad ,$$
where α and β correspond to the up- and down-switching fields of some population of hysterons, respectively. For α > β and α = β, the hysterons are irreversible and reversible, respectively. The reversible FORC distribution describes the reversible dielectric contributions, and the irreversible FORC distribution describes the hysteresis in the polarization response.
In this study, three kinds of BaTiO3-based MLCC specimens were prepared maintaining the same grain size. The first is the low-dielectric constant specimen, the second is the specimen with enhanced dielectric constants by adjusting the Ba concentration in the additive composition, and the third is the specimen with further enhanced dielectric constants by adjusting the Ba concentration and donor-Dy incorporation. Thus, the effect of Dy-doping in BaTiO3 on the dielectric nonlinearity was investigated and contrasted with the effect of excess Ba in additives utilizing the FORC distribution based on the Preisach model.
II. EXPERIMENTAL PROCEDURES
The starting materials used were lab scale-hydrothermally synthesized 200 nm grade BaTiO3 powder, and the dopant additives used were reagent grade BaCO3, SiO2, MnO2, and V2O5 powders. The prototype MLCC specimen of three kinds of compositions were prepared, where 0.3 mol% MnO2 and 0.1 mol% V2O5 for both nonreducibility and reliability, and 1.2 mol% SiO2 for sintering aid were added in common: 0.4 mol% Ba, 1.4 mol% Ba, and 1.4 mol% Ba–0.5 mol% Dy-doped BaTiO3, respectively. Herein, they are referred to as 0.4Ba, 1.4Ba, and 1.4Ba-0.5RE MLCC specimen, where RE represents rare earth element, Dy. The first is the low-dielectric constant specimen, the second is the specimen with enhanced dielectric constants by adjusting the Ba concentration in the additive composition, and the third is the specimen with further enhanced dielectric constants by adjusting the Ba concentration and donor-Dy incorporation.
These powders were mixed by ZrO2 ball milling in an ethanol/toluene (50/50) solution with a dispersant (BYK-103, BYK Chemie, GmbH, Wesel, Germany). After this, an organic binder solution (Polyvinyl Acetal Resin) was added and mixed by ball milling again. These slurries were separated from the zirconia media for tape casting into green sheets.
Prototype Ni-inner electrode-MLCC specimens of 3.2 mm × 1.6 mm in size where the number of dielectric layer is 19 and its thickness after sintering is about 2.2 μm were prepared. Standard multilayer process of casting, screen printing of Ni-electrode on the green sheets, stacking, pressing, and cutting was applied. These green MLCC chips were binder-burn out and sintered for 1 h in a pO2 of ∼10−9.7 atm (H2/N2/H2O atmosphere, 1% H2/99% N2) at 1190 °C, which followed by re-oxidation anneal at 1000 °C for 3 h in N2 atmosphere (pO2 = ∼10−6 atm). Terminal electrodes on both ends of the chips were prepared by dipping into Cu-paste and heat treatment at 800 °C.
The capacitance and dissipation factor (DF) of the MLCC samples were measured using LCR meter (HP 4284A, Agilent Technologies Ltd., Hyogo, Japan) by varying ac field from 0.001 to 4 V/μm. The temperature dependence of the dielectric constant was measured at 1 kHz and ac 0.01, 0.5, and 1.0 V/μm from −55 to 150 °C. The polarization (P)–electric field (E) loops and FORC of the MLCC specimens were measured using the Precision Multiferroic-Precision Materials Analyzer (Radiant Technologies, Inc., CA). The calculation of the FORC distribution followed the FORC method described elsewhere.Reference Zhu, Fujii, Ren and Mckinstry8,Reference Pike, Roberts and Verosub22–Reference Fujii, Ugorek and Trolier-Mckinstry24 40 FORCs were measured as descending curves of minor P–E loops by applying a sinusoidal field that initially decreased to a negative saturation field of −5 V/μm and then cycled between −5 V/μm and −5 + 0.25n V/μm and n increased from 1 to 40 so that the 40th loop was a P–E loop cycled between −5 V/μm and +5 V/μm. The frequency for each minor loop was 2 Hz. The calculations of the FORC distribution were conducted utilizing the home-made software of the Preisach Analysis Program (Center for Dielectric Studies, Penn State Univ.).
The microstructures of the MLCC samples were observed using scanning electron microscopy (FE-SEM, Model ULTRAPLUS, Carl Zeiss SMT GmbH, Oberkochen, Germany). The average intercept length was obtained and then multiplied by 1.776 to estimate the average grain size.Reference Han and Kim28
III. RESULTS AND DISCUSSIONS
A. Microstructures and dielectric properties of the BaTiO3-based prototype MLCC
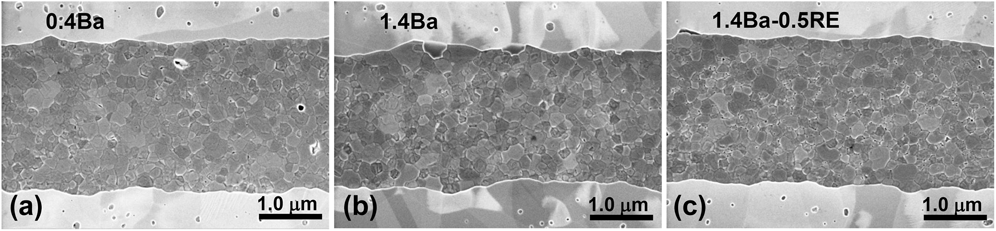
Figures 1(a)–1(c) show microstructures of the dielectric layers and Ni-inner electrodes of 0.4Ba, 1.4Ba, and 1.4Ba-0.5RE MLCC specimen that were sintered at 1190 °C for 1 h in a pO2 of ∼10−9.7 atm (H2/N2/H2O atmosphere, 1% H2/99% N2) followed by re-oxidation anneal at 1000 °C for 3 h in N2 atmosphere (pO2 = ∼10−5 atm). The bright layers are Ni-inner electrodes and the dark layers are dielectrics, where the thickness of dielectric layer is about 2.2 μm. The grain sizes of 0.4Ba, 1.4Ba, and 1.4Ba-0.5RE MLCC specimens are 196 ± 53, 207 ± 56, and 201 ± 55 nm, respectively, which is almost the same each other. Thus, the influence of grain size on the relative difference of the dielectric properties can be ruled out, and they can be compared under the same grain size condition. It was difficult to experimentally identify the distribution of dopants Mn, V, and Dy due to low doping level below 0.5 at.%. But it is supposed that these dopants would be mainly incorporated in the shell regions of the grain, although these regions are also ferroelectric state and thus are not distinguished from core regions in the transmission electron microscopy image.
Microstructures of the dielectric layers and Ni-inner electrodes of (a) 0.4Ba, (b) 1.4Ba, and (c) 1.4Ba-0.5RE MLCC specimen that were sintered at 1190 °C for 1 h in a pO2 of ∼10−9.7 atm (H2/N2/H2O atmosphere, 1% H2/99% N2) followed by re-oxidation anneal at 1000 °C for 3 h in N2 atmosphere (pO2 = ∼10−5 atm).

Figures 2(a)–2(d) show the ac field dependence of (a) the dielectric constant, (b) the magnified part in the low ac field range, (c) the relative change ratio of the dielectric constant with respect to that at zero ac field, and (d) DF for 0.4Ba, 1.4Ba, and 1.4Ba-0.5RE MLCC specimen. The dielectric constants of all specimens show an increasing saturation and then decreasing behavior by the increase of the driving ac field as shown in Fig. 2(a). It is known that there is a threshold field in ferroelectric materials below which the dielectric constants are independent of the ac field level.Reference Kholkin29–Reference Bassiri Gharb and Trolier-Mckinstry31 Such behavior can also be observed in Fig. 2(b), where the dielectric constants are independent of ac field below ∼0.02 V/μm. The dielectric constants in this low ac field range are generated by the intrinsic contribution of the lattice deformation and reversible domain wall motion.Reference Kholkin29–Reference Bassiri Gharb and Trolier-Mckinstry31 The dielectric constants at zero ac fields for the 0.4Ba, 1.4Ba, and 1.4Ba-0.5RE MLCC specimens are around 2000, 2500, and 3000, respectively. The dielectric constant that originates from the intrinsic contribution at room temperature was reported to be roughly ∼1000.Reference Arlt and Peusens16 Thus, the variation of the observed dielectric constants at zero ac field is supposed to be mainly caused by the reversible domain wall contribution.
The ac field dependence of (a) the dielectric constant, (b) the magnified part in the low ac field range, (c) the relative change ratio of the dielectric constant with respect to that at zero ac field, and (d) DF for 0.4Ba, 1.4Ba, and 1.4Ba-0.5RE MLCC specimen, respectively.
When the additive composition was adjusted from 0.4Ba to 1.4Ba maintaining the same grain size, the dielectric constants in both low field and high field region are enhanced, and the change in dielectric constant and the DF with the increase of ac field becomes higher as shown in Fig. 2. It was reported that the excess Ba concentration in the additives has a significant influence on the dielectric constant under the same grain size condition by controlling the A/B nonstoichiometry in the ABO3 structure.Reference Yoon, Kim, Kim and Kim6 As the sintering aids, SiO2 in BaTiO3, consume Ba to form Ba2TiSi2O8 second phase, the dopant-incorporated ABO3 structure changes from A-site deficient to stoichiometric and then B-site deficient ABO3 with the increase of Ba concentration in additives. The 1.4Ba specimen in this study is anticipated to be the stoichiometric ABO3 structure with A/B ratio being 1 generating higher dielectric constants than 0.4Ba specimen. When the nominal additive composition of 1.4Ba specimen is considered, 1.2 at.% Si is supposed to consume 1.2 at.% Ba in the added 1.4 at.% Ba to form Ba2TiSi2O8 second phase. And the remaining 0.2 at.% Ba would incorporate into A-site, and the 0.3 at.% Mn and 0.2 at.% V would incorporate into B-site resulting in a nominally 0.3 at.% B-site excess condition, which is roughly close to stoichiometric state of A/B ≈ 1.
The Dy-doping in 1.4Ba specimen can further increase the dielectric constant. 1.4Ba-0.5RE specimen shows more enhanced dielectric constants than those of 1.4Ba specimen in the entire range of ac field. The change in dielectric constant and the DF with the increase of ac field also becomes slightly higher. This result demonstrates that Dy-incorporation can be another crucial factor that has significant influence on the dielectric nonlinearity of BaTiO3 under the same grain size condition.
Figures 3(a)–3(c) show dielectric constant versus temperature of 0.4Ba, 1.4Ba, and 1.4Ba-0.5RE MLCC specimen, respectively, for the ac field condition of 0.01, 0.5, and 1.0 V/μm. Whereas there are almost no differences in the dielectric constants above Curie temperature (T C) of 125 °C by the increase of the ac field, and also those values are similar each specimen they increase, and the difference becomes bigger with the decrease of temperature, which is known to be caused by domain wall movement.Reference Moulson and Herbert32,Reference Tsurumi, Yamamoto, Kakemoto, Wada, Chazono and Kishi33 The behavior of such difference becomes more and more significant with the order of 0.4Ba, 1.4Ba, and 1.4Ba-0.5RE specimen, respectively. Therefore, the effect of the Dy-doping on the variations of dielectric constants depending on the ac field below T C indicates its influence on the ferroelectric domain wall motion.
The dielectric constant versus temperature of (a) 0.4Ba, (b) 1.4Ba, and (c) 1.4Ba-0.5RE MLCC specimen, respectively, for the ac field condition of 0.01, 0.5, and 1.0 V/μm.
Figure 4 shows dc-bias characteristics, that is, dielectric constants versus dc-field for the 0.4Ba, 1.4Ba, and 1.4Ba-0.5RE MLCC specimens, where they were measured at ac field of 0.5 V/μm. The value of the dielectric constant of all specimens shows a decreasing and then saturating behavior with the increase of dc-field. The degree of the variation of the dielectric constant depending on the dc-field is in order of the magnitude of initial dielectric constant at zero dc-bias. That is, the 1.4Ba-0.5RE specimen corresponding to the highest initial dielectric constant at zero dc-bias shows biggest decrease in the dielectric constant by the increase of dc-bias, whereas the 0.4Ba specimen of the lowest initial dielectric constant at zero dc-bias shows only a slight decrease. The dielectric constants of 1.4Ba and 1.4Ba-0.5RE MLCC specimen roughly converge at high dc-field beyond dc-field of about 5.0 V/μm, and those of 0.4Ba specimen show slightly higher values than the other specimens in this high dc-field range. The variation of the dielectric constant under dc-bias is caused by its nonlinear behavior, and it becomes more significant in the case of high-dielectric constant,Reference Yoon, Kim, Kim and Kim6,Reference Tsurumi, Yamamoto, Kakemoto, Wada, Chazono and Kishi33,Reference Yoon, Park, Kim and Kim34 which would correspond to high magnitude of spontaneous polarizationReference Yoon, Kim, Kim and Kim6,Reference Yoon, Park, Kim and Kim34 or high domain wall contribution.Reference Arlt, Hennings and Dewith1,Reference Hosina, Takizawa, Li, Kasama, Kakemoto and Tsurumi3 Thus, the variation of the dc-bias characteristics with Ba concentration or Dy-incorporation indicates its association with these factors.
The dc-bias characteristics, that is, dielectric constants versus dc-field for 0.4Ba, 1.4Ba, and 1.4Ba-0.5RE MLCC specimen, where they were measured at ac field of 0.5 V/μm and 1 kHz.
Figures 5(a) and 5(b) show polarization (P) versus electric field (E) behavior of 0.4Ba, 1.4Ba, and 1.4Ba-0.5RE MLCC specimen up to electric field of 0.5 and 20 V/μm, respectively. In the low field range up to 0.5 V/μm as shown in Fig. 5(a), the magnitude of polarization and its slope, that is, dielectric constant is in order of 0.4Ba, 1.4Ba, and 1.4Ba-0.5RE MLCC specimen, respectively. On the other hand, when the electric field is increased to up to 20 V/μm as shown in Fig. 5(b), the P–E relations show saturation behaviors, where switching of domains occurs and most of domains are aligned to the electric field direction resulting in a decrease of dielectric constant. The saturation polarization scales to the magnitude of the spontaneous polarization.Reference Damjanovic19 The value of saturation polarization, that is, the polarization at 20 V/μm of 0.4Ba specimen is smaller than those of 1.4Ba and 1.4Ba-0.5RE specimen, and 1.4Ba and 1.4Ba-0.5RE specimen show almost similar values each other. Thus, the smaller dielectric constants of 0.4Ba specimen compared with those of 1.4Ba specimen as shown in Fig. 2(a) are supposed to be associated with smaller magnitude of spontaneous polarization. However, little difference in the value of saturation polarization between 1.4Ba and 1.4Ba-0.5RE specimen demonstrates that the increase of dielectric constants by Dy-doping is not associated with the magnitude of spontaneous polarization, but with other factors such as domain wall contribution.
The polarization (P) versus electric field (E) behavior of 0.4Ba, 1.4Ba, and 1.4Ba-0.5RE MLCC specimen up to electric field of (a) 0.5 V/μm and (b) 20 V/μm, respectively.
B. Preisach analysis for the BaTiO3-based prototype MLCC
To characterize the dielectric nonlinearity as observed in Fig. 2, the FORCs were measured and the FORC distributions were calculated. The details of the measurement and the calculation of the FORC distributions are described elsewhere.Reference Robert, Damjanovic and Setter21–Reference Fujii, Trolier-Mckinstry and Nies25
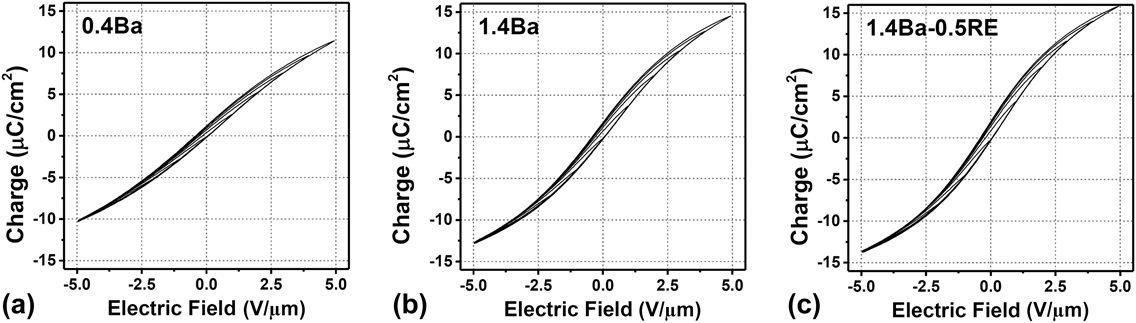
Figures 6(a)–6(c) show FORCs of the 0.4Ba, 1.4Ba, and 1.4Ba-0.5RE MLCC specimens, respectively, where only 12 FORCs are shown for clear image. Preisach analysis interprets these data as the summation of a distribution of switching elements.
The FORCs of the (a) 0.4Ba, (b) 1.4Ba, and (c) 1.4Ba-0.5RE MLCC specimens respectively, where only 12 FORCs are shown for clear image.

Figure 7 shows the calculated reversible FORC distributions, p rev(α), as a function of α for 0.4Ba, 1.4Ba, and 1.4Ba-0.5RE MLCC specimens, where α is the switching field of hysterons. The reversible FORC distribution is the density of reversible hysterons that describes the reversible dielectric contributions. The reversible FORC distribution near zero bias increases by the compositional adjustment from 0.4Ba to 1.4Ba specimen and further increases by the Dy-doping from 1.4Ba to 1.4Ba-0.5RE specimen, respectively, and they converge each other in the high field range of |α| > 4 V/μm where extrinsic contributions are expected to be negligible and only intrinsic contributions are dominant. Thus, the difference of the reversible distribution near zero bias is supposed to be associated with the reversible domain wall contributions.Reference Fujii, Ugorek and Trolier-Mckinstry24
The reversible FORC distribution, p rev(α), as a function of α for the 0.4Ba, 1.4Ba, and 1.4Ba-0.5RE MLCC specimen, where α is the switching field.
It was reported that the Ba concentration of the maximum dielectric constant corresponds to the stoichiometric ABO3 structure with A/B ratio being 1,Reference Yoon, Kim, Kim and Kim6 where the magnitude of spontaneous polarization is the maximum. As explained in Sec. I, the 0.4Ba and 1.4Ba specimen can be associated with A-site deficient and stoichiometric ABO3, respectively. Therefore, the increase of the reversible FORC distribution by the compositional adjustment from 0.4Ba to 1.4Ba specimen can be explained by the increase of magnitude of the spontaneous polarization.
The increase of the reversible FORC distribution by the Dy-doping from 1.4Ba to 1.4Ba-0.5RE specimen suggests that the pinning of domain walls is reduced by Dy-doping, and thereby the portion of reversible domain wall density is increased, which can be correlated with the reduction of the oxygen vacancies and their resultant decrease of defect dipoles that act as pinning sources. Such enhancement in the reversible FORC distribution results in the increase of the low field dielectric constants as shown in Fig. 2(b).
Figures 8(a)–8(c) show irreversible FORC distribution, p irr(α,β), for the 0.4Ba, 1.4Ba, and 1.4Ba-0.5RE MLCC specimen, respectively. The irreversible FORC distribution is the density of irreversible hysterons that describes the irreversible dielectric contributions that are associated with the hysteretic behaviors in the polarization response. The irreversible FORC distribution contributes to the increasing slope in the dielectric constant with the increase of ac field as shown in Fig. 2(a). Whereas almost flat and negligible irreversible FORC distribution is observed in 0.4Ba specimen, the intensities appear near the origin in 1.4Ba and 1.4Ba-0.5RE MLCC specimen. The irreversible FORC distribution also shows similar behavior with those of the reversible FORC distribution, which slightly increase by the compositional adjustment from 0.4Ba to 1.4Ba specimen and further increase by the Dy-doping from 1.4Ba to 1.4Ba-0.5RE specimen, respectively. The increase of not only reversible but also irreversible FORC distribution by the compositional adjustment from 0.4Ba to 1.4Ba specimen can be correlated with the increase of the magnitude of the spontaneous polarization. The further increase of the irreversible FORC distribution by Dy-donor doping indicates that more hysterons can be switched at the same switching field of α and β, and can be associated with the reduction of pinning sources and their interaction with domain walls, which would enhance the domain wall mobility.
The irreversible FORC distribution, p irr(α,β), for the (a) 0.4Ba, (b) 1.4Ba, and (c) 1.4Ba-0.5RE MLCC specimen, respectively.
The increase of both the reversible and irreversible domain wall contribution to the dielectric constant by the Dy-doping from 1.4Ba to 1.4Ba-0.5RE specimen is similar to the typical donor-dopant effect that was reported in PZT system,Reference Zhu, Fujii, Ren and Mckinstry8 which has been explained by the enhancement of the domain wall mobility, that is, the reduction of the oxygen vacancies and their resultant decrease of defect dipoles that act as pinning sources providing internal bias and decreasing domain wall mobility. It has been known that the doping of rare earth elements, such as Dy, Y, and Ho, leads to a donor-doped behavior preferentially occupying A-sites at the low level of doping concentration below ∼0.5 at.% even in A-site excess systemReference Xue, Chen and Brook35–Reference Kim, Yoon and Han37 and amphoteric behaviors that can occupy both A-site donors and B-site acceptors at high doping levels depending on their site occupancy. Thus, when 0.5 at.% Dy was added to 1.4Ba composition corresponding to stoichiometric ABO3, most of the incorporated Dy is supposed to behave as a donor-dopant, which could also be demonstrated by the observed phenomenon of changing to semiconducting behaviors when the acceptors of Mn and V dopants were removed in 1.4Ba-0.5RE specimen in our previous studies.
Based on a different viewpoint, there is another opinion that Dy is quite a special dopant, as when it is on the Ti site, its valence state is always a 3+ acceptor, whereas on the Ba-site, it may be a predominant 2+ neutral defect.Reference Tsur and Randall14 If such situation might have happened in this study, the enhanced dielectric constant by Dy-incorporation then can also be explained by the amphoteric nature of Dy in BaTiO3 that helps reducing local deviations from stoichiometry resulting in the A/B ratio more close to 1, which is the similar effect of the Ba concentration adjustment. Anyway, the result of this study demonstrates that the incorporation of donor-type dopants in BaTiO3 is an important factor that has a significant influence on the dielectric nonlinear behavior under the same grain size condition.
IV. SUMMARY AND CONCLUSIONS
In this study, the Dy-donor doping effect on the dielectric constant and its nonlinear behavior in Mn and V-doped BaTiO3 MLCC were investigated under the condition of the same grain size. The Dy-donor doping in BaTiO3 enhances the dielectric constants in both low and high field region, which can be associated with the increase of both reversible and irreversible FORC distribution near zero bias, whereas there was little variation in the saturation polarization that scales to the magnitude of spontaneous polarization. These results demonstrate that both reversible and irreversible domain wall contributions to the polarization are increased by Dy-incorporation, which can be explained by the enhancement of the domain wall mobility that is caused by the reduction of the oxygen vacancies and their resultant decrease defect dipoles that act as pinning sources providing internal bias and decreasing domain wall mobility. In addition, the amphoteric nature of Dy might also contribute to the enhancement of the dielectric constant by reducing local deviations from stoichiometry. Not only excess Ba concentration in additives that influences nonstoichiomerty of ABO3 structure but also donor incorporation can be crucial factor that controls dielectric constants and their nonlinear behavior under the condition of the same grain size.