1. Introduction
The last three decades have exhibited both fast economic convergence between developed and (some) emerging countries as well as economic divergence between the most and least developed countries. Moving beyond the traditional approach to compare economic welfare across countries and time based on GDP per capita only, Jones and Klenow (Reference Jones and Klenow2016) have challenged existing convergence and divergence facts by including life expectancy (LE), consumption inequality, and leisure into a broader assessment of welfare development. Air quality has been much discussed as an important factor of living standards worldwide. Changes in air quality vary substantially and relate to GDP (growth) differently across countries. This paper extends Jones and Klenow and quantifies welfare levels and developments across countries taking into account international evidence on airborne particulate matter. We show that considering air quality substantially affects welfare within and convergence and divergence in welfare across countries.
There exist many different welfare measures that include aspects over and above GDP, for example, the Human Development Index. Some explicitly address environmental aspects of pollution. Meadows and Club of Rome (Reference Meadows1972) is an early example. In light of the famous Millennium Development Goals, World Bank Group (1997) subtracts the estimated damages of air pollution from a nation’s calculated net national savings to achieve their well-known sustainability measure of “Genuine Saving” to account for the depreciation of physical assets, such as cropland and human capital, due to environmental pollution. The approach of Jones and Klenow (Reference Jones and Klenow2016) has the advantage of being based on a concrete utility specification the parameters of which can be informed by microeconomic data. Moreover, it provides an equivalent variation that can be used in our setting to quantitatively assess how much consumption would an economic agent be willing to forego for better air quality. This is particularly useful for welfare comparisons across countries. Existing approaches based on an equivalent variation such as Jones and Klenow (Reference Jones and Klenow2016) and Fleurbaey and Gaulier (Reference Fleurbaey and Gaulier2009) do not address environmental aspects.
We focus on a particular aspect of environmental quality: The concentration of airborne particulate matter. It has been acknowledged as an important source of health risks which led to the introduction of guidelines and limits with respect to the annual exposure by the WHO and the EU, among others.Footnote 1 Health risks are long term as high levels of particulate matter negatively affect aging, cognitive abilities, and through many channels, LE. Poor air quality may also affect physical and mental health in the short term. Physical and mental health, in turn, affect both productivity [Madsen (Reference Madsen2018)] as well as the accumulation of human capital [Palivos and Varvarigos (Reference Palivos and Varvarigos2017)] and hence even the long-run growth path of an economy. A detailed review of the medical literature on health effects and effects on well-being of particulate matter exposure is given in Mukherjee and Agrawal (Reference Mukherjee and Agrawal2018). Over and above health risks, air quality affects well-being more generally which is particularly important in the short term: Particulate matter concentration affects the value of consumption and leisure, especially when related to outdoor activities. Economic agents may also distaste poor air quality directly.Footnote 2 The studies of Levinson (Reference Levinson2012), Freeman et al. (Reference Freeman, Liang, Song and Timmins2019), and Ito and Zhang (Reference Ito and Zhang2020) provide empirical support for a disutility of air pollution as they all imply a substantial willingness to pay for clean air. In line with this literature, we assume that, ceteris paribus, a person’s utility increases in air quality. Through its effect on health, past air quality already enters the framework of Jones and Klenow (Reference Jones and Klenow2016) indirectly via the LE of a country’s population. In this paper, we therefore evaluate the effects of air pollution on utility that are either short term or affect health today and change LE in the future.
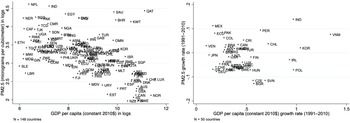
Population-weighted particulate matter concentration is available for a large sample of countries and years. Concentration greatly varies across countries with a minimum value of 7.2 µg/m3 in New Zealand and a maximum value of 100.8 µg/m3 in Nepal in 2010. Figure 1 documents the relationship between particulate matter and GDP both in log levels and growth rates across those countries included in our welfare assessment. The figure exhibits a broadly negative relationship between economic development and air quality in 2010 (left-hand side panel). However, China, India, but also Arab countries are notable exceptions of countries with very high pollution levels relative to countries with a comparable GDP per capita. Worldwide, the population-weighted annual exposure to PM2.5 has increased about 6% from 39.5 µg/m3 in 1990 to 41.8 µg/m3 in 2010. While the PM2.5 concentration in the East Asian and Pacific countries increased by about 14% from 38.1 µg/m3 in 1990 to 43.3 µg/m3 in 2010, the countries of today’s European Union, especially Eastern European countries, experienced a reduction of about 29% from 20.6 to 14.7 µg/m3 in the same period. The relationship between GDP growth and pollution growth is positive, but not generally strong (right-hand side panel). One notable exception is India with high growth rates in both GDP and particulate matter concentration. Similar patterns have been documented in Grossman and Krueger (Reference Grossman and Krueger1995) and Bradford et al. (Reference Bradford, Fender, Shore and Wagner2005).Footnote 3 Taking into account poor air quality in welfare comparisons may therefore intensify or weaken welfare levels and welfare growth in absolute levels, but also relative across countries.
Economic development and particulate matter. Notes: Left-hand side shows log levels of GDP and PM2.5 in 2010. Right-hand side shows growth rates between 1991 and 2010. Data from World Bank (2018).

Factors behind high particulate matter concentration are both natural, due to geographic characteristics, and artificial, due to power generation, heating, transportation, and industrial activity. Our quantification of welfare differences allows us to evaluate concrete environmental policies that aim at reducing particulate matter concentration due to these artificial sources such as general air pollution action plans or bans on certain technologies, for example, diesel cars.
We show that once the concentration of particulate matter is taken into account, the welfare ranking between countries substantially changes for some country groups, both in terms of levels and growth rates and both compared to the corresponding ranking without air quality (Jones and Klenow) and a ranking based on GDP per capita only. Our results show that omitting environmental aspects from welfare accounting might lead to a substantial over- or understatement of actual relative welfare and welfare developments. In particular, many developing countries are even poorer in terms of welfare than suggested by income levels only or welfare measures without air pollution. Not including air pollution overestimates the living standards of most Central and Western European countries, and some of these countries are relatively worse off compared to an assessment based on GDP only. Regarding developments, air pollution declines over time in most countries which accelerates their welfare growth. This is particularly true for the EU-28 member states whose welfare has grown 1% point faster than in the USA between the beginning of the 1990s and the second half of the first decade of the 2000s once the improvement in air quality is taken into account.
Based on our welfare growth assessment, we assess the Chinese “Action Plan on Prevention and Control of Air Pollution” of 2013 and compute an additional annual welfare growth of 0.7% over the time frame of the plan. In terms of consumption, Chinese people would therefore be willing to accept an annual decrease of consumption by 0.7% on average if the goals of the action plan were realized.
This paper is structured as follows. Section 2 defines the utility framework and discusses the data and calibration. Section 3 documents the results on relative welfare levels and growth rates based on our welfare measure and comparing the results to a framework without air pollution (Jones and Klenow) and based on GDP per capita only. Section 3 also contains the back-of-the envelope assessment of the Chinese action plan on air pollution. Section 4 addresses robustness to our baseline utility framework with respect the calibration and the separability of air pollution with consumption and leisure in the utility function. Section 5 concludes.
2. Model, data, and calibration
2.1. Utility framework
To calculate the alternative welfare measure across countries and over time, we define the following Rawlsian expected lifetime utility of a random person in country
 $i$
as
 \begin{equation} V(e,c,l,\sigma,p)=e\left[\bar{u}+\log (c)+v(l)-\frac{1}{2}\sigma ^2 - \kappa \log (p)\right], \end{equation}
where
 $e$
is LE at birth which multiplies the expected flow utility per year. LE hence discounts flow utility. This formulation is derived from an expected lifetime utility formulation with an annual discount factor of one and is identical to Jones and Klenow (Reference Jones and Klenow2016) apart from the last term. The formulation assumes that consumption among a country’s population is log-normally distributed. Here,
 $\log (c)$
is the flow utility from consumption and
 $\bar{u}$
is a utility constant. Consumption is the stock of private and public consumption, which takes into account that people not only derive utility from their private consumption but also from the consumption of goods provided by the government.
 $v(l)$
is the flow utility from leisure which is defined as
 $v(l)=-\frac{\theta \epsilon }{1+\epsilon }(1-l)^{\left(\frac{1+ \epsilon }{\epsilon }\right)}$
, where
 $\epsilon$
is the Frisch elasticity,
 $\theta$
is the utility weight assigned to leisure, and
 $l$
is leisure time.
 $\log (c)-\frac{1}{2}\sigma ^2$
is the expected value of consumption given a log-normal distribution, with
 $\sigma ^2$
as the variance of the distribution.
Air quality enters equation (1) implicitly through LE. The term
 $-\kappa \log (p)$
captures the additional flow disutility from air pollution that arises from the contemporaneous effect of air quality on health and happiness and well-being more generally. Here,
 $\kappa$
is a parameter and
 $p$
is the level of pollution measured in µg/m3. As for leisure, our formulation assumes that pollution is certain, and hence, the corresponding expected utility equals the utility of its expected value.
We assume linear separability between consumption, leisure, and air pollution. This makes the model both tractable and comparable to the original formulation by Jones and Klenow (Reference Jones and Klenow2016). A similar assumption is made by Michel and Rotillon (Reference Michel and Rotillon1995) and Gradus and Smulders (Reference Gradus and Smulders1993) who address the role of pollution for economic growth. Suffering from low air quality does not only exert disutility in itself but might also influence the marginal utility of leisure and consumption and potentially even the substitutability of the two. If air pollution has a negative effect on the marginal utility of leisure time, this indirectly influences a person’s labor supply, since it lowers the opportunity costs of working. Taking this into account, we consider non-separable preferences in Section 4.
As in Jones and Klenow (Reference Jones and Klenow2016), we compare the expected lifetime utility of a random person “Rawls” living in country
 $i$
to the USA as a benchmark country. The equivalent variation
 $\lambda _i$
measures the factor by which a person’s consumption living in the USA must be adjusted to make her indifferent to living in country
 $i$
:
 \begin{equation} V(e_{us},\lambda _ic_{us},l_{us},\sigma _{us},p_{us})=V(e_i,c_i,l_i,\sigma _i,p_i). \end{equation}
This condition assumes equal preferences across countries. Using (2), we compute
 $\log (\lambda _i)$
and
 $\log \left(\frac{\lambda _i}{\tilde{y_i}}\right)$
for each country, where
 $\tilde{y_i}=\frac{y_i}{y_{us}}$
is a country
 $i$
’s GDP per capita relative to that of the USA.Footnote
4
2.2. Data
Because of comparability, we use the same data sources as Jones and Klenow (Reference Jones and Klenow2016) and the same base year 2007.Footnote 5 Real GDP per capita, expenditures, the share of both private and public consumption in GDP, and average hours worked per worker and year stem from the Penn World Table version 8.0.Footnote 6 LE at birth for both sexes, absolute population, and the employment share in total population are taken from the World Development Indicators published by the World Bank. Consumption inequality as measured by the Gini coefficient stems from the UNU-WIDER World Income Inequality Database version 3.0 (WIID3a).Footnote 7 Under the assumption of log-normal distributed consumption, the standard deviation of consumption is calculated according to:
 \begin{equation} \sigma =\sqrt{2}\cdot \Phi ^{-1} \left (\frac{1+G}{2} \right ), \end{equation}
where
 $G$
is the Gini coefficient. The WIID database contains data on both consumption and income inequality, and consumption inequality is used whenever it is available. In the case that there is no information on consumption inequality, we follow Jones and Klenow and use data on disposable income.
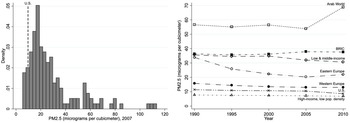
We use publicly available data from the World Bank and measure air pollution as the mean annual exposure of suspended particles measuring less than 2.5 microns in aerodynamic diameter. The concentration of air pollution is measured in µg/m3 and weighted by the population in both urban and rural areas, which takes into account that people in rural areas typically suffer less air pollution than people living in urban ones. All measures are annual averages in a country. The data are published yearly starting in 2010 and every 5 years between 1990 and 2005. Values for 2007 are obtained using a linear interpolation. As Figure 2 shows, particulate matter concentration varies substantially across countries (left panel) and time (right panel). Including all available data, we obtain a welfare measure for 148 countries from all income classes for the year 2007. We consider countries in six distinct groups: First, the Arab countries which exhibit high levels of air pollution which further increases over time. Second, the BRIC countries with a high and moderately increasing level of air pollution. Third, low- and middle-income countries which only slightly improve from a medium level of air pollution. Fourth, Eastern European countries which start from a comparable medium level but improve their air quality over time. Fifth, Western European countries which stagnate at a comparably low level of air pollution. And sixth, high-income countries with low population densities which exhibit the lowest levels of air pollution throughout. The USA is shown in comparison. Its level lies between Western Europe and the Northern high-income countries, and its pollution levels are mildly decreasing between 2005 and 2010.Footnote 8
Particulate matter across countries and over time. Notes: Data from World Bank (2018).

We also consider welfare growth. Due to availability of the data on air pollution, we limit our sample to the period 1991 until 2010 when calculating growth rates of our welfare measure. Jones and Klenow (Reference Jones and Klenow2016) consider the period 1980−2007, however. To obtain growth rates for our sample, we use updated versions of the Penn World Table (version 9.0) and the UNU-WIDER World Income Inequality Database (version 3.3, WIID3c). Growth rates for welfare are only available for a subset of the countries for which we can measure welfare levels. The reason is that some countries provide levels of leisure (working hours) and inequality in 2007, but not before, in particular for the range 1990−1995. The country sample for which we are able to calculate welfare growth rates covers 50 countries. Unfortunately, this excludes interesting countries such as China and the Arab countries from our welfare growth analysis.
2.3. Calibration
Following Jones and Klenow (Reference Jones and Klenow2016), we use
 $\theta =14.2$
and
 $\epsilon =1$
to describe the sub-utility of leisure. The parameter
 $\bar{u}$
measures the value of a statistical life which is difficult to calibrate and differs substantially across studies [see Viscusi and Aldy (Reference Viscusi and Aldy2003)]. We set
 $\bar{u}$
to 8.28, to make sure that the lowest flow utility in our sample (Bangladesh) is just equal to zero as a benchmark.Footnote
9
We follow the same procedure for growth rates and derive the critical
 $\bar{u}$
as 7.36. We do not interpret
 $\bar{u}$
here and consider robustness to changing its value in Section 4.
The important parameter in our framework is
 $\kappa$
, the disutility parameter of air pollution. To assign a monetary value to clean air, we use the estimates on the willingness to pay for clean air in USA data from Levinson (Reference Levinson2012). Levinson regresses self-reported happiness from survey respondents on independent real-time local data on air quality controlling for weather conditions, demographic characteristics, and the respondent’s income. By including both location and time fixed effects as well as their interactions and by using daily fluctuating data on air quality, the author accounts for the fact that people with a relatively higher willingness to pay for clean air self-select into areas with less air pollution, a fact that cannot be accounted for in studies that calculate the willingness to pay based on data on house prices, for example. From the regression results, he derives the average marginal rate of substitution between income and current local air quality. Levinson’s study concludes that people are willing to forgo about 37 US dollar for an improvement in air quality of one standard deviation for one day.
We set
 $\kappa$
equal to the ratio of the estimated coefficient of air quality, measured in logs of µg PM10 per m3, to the estimated coefficient of income, measured in logs of thousand dollars. Since the estimated coefficients are based on a concentration of PM10 in µg per m3, we convert the original PM2.5 data into PM10 data. According to the WHO (2006), the common PM2.5/PM10 ratio is
 $0.5$
, and we multiply the raw data on air pollution by the factor two accordingly. Note that while Levinson (Reference Levinson2012) uses data on income, we refer a direct correspondence to consumption. This seems reasonable, since the share of private and public consumption in GDP is usually relatively high.Footnote
10
This results in
 $\kappa =0.67$
as our baseline measure of the short-term effect of air pollution on subjective well-being.
Levinson’s results are larger than those from other hedonic studies [see, e.g. Bayer et al. (Reference Bayer, Keohane and Timmins2009)]. They are qualitatively in line with the findings of Welsch (Reference Welsch2006) who uses a similar approach to estimate the effect of air pollution on stated well-being. Different to Levinson, he considers country-wide effects in ten European countries over the period 1990−1997. Besides data on nitrogen dioxide and lead, he also uses data on particulate matter concentration and finds a statistically significant negative effect on stated well-being. The approach for non-market environmental valuation used in the two mentioned studies needs to be distinguished from methods of revealed preferences and stated preferences that are well-established in the literature. Frey et al. (Reference Frey, Luechinger and Stutzer2004) refer to this method as the life satisfaction approach and argue that methods of revealed preferences and stated preferences both have shortcomings. They state that in the case of the revealed preferences approach, failures in the market for the goods that are used as complements or substitutes to the non-market good that is to be valuated might bias the results, whereas the stated preferences approach might suffer from strategic behavior or limited awareness of the respondents.Footnote 11
Two recent studies for China provide comparable estimates of
 $\kappa$
based on discrete-choice information. Ito and Zhang (Reference Ito and Zhang2020) use a policy-induced natural experiment which generated variation in air quality in different regions in China in order to measure the willingness to pay for clean air based on air purifier investments. This study implies that
 $\kappa =0.95$
which is above, but not too far from our baseline value.Footnote
12
Freeman et al. (Reference Freeman, Liang, Song and Timmins2019) use census information and satellite data to infer the willingness to pay for clean air from residential location choices of Chinese households. This study implies that
 $\kappa =1.5$
and hence infers a disutility from air pollution higher than our baseline estimate.Footnote
13
We will investigate the robustness of our results to this high value of
 $\kappa$
in Section 4 below.
3. Results
3.1. Welfare levels
We first compute welfare levels in 2007 based on our specification and calibration outlined above. All calculations are relative to the USA as the benchmark, so in the following we always refer to welfare relative to the USA. Jones and Klenow (Reference Jones and Klenow2016) have already documented how taking into account LE, leisure, and inequality affects the relative welfare positions of countries compared to an assessment that is based on GDP per capita only. Specifically, they find that assessing welfare based on GDP per capita only overstates relative welfare of many countries with low-income levels. They also find that European countries perform better on average compared to the USA when taking into account leisure and inequality. Hence, living standards of European countries are, on average, much closer to those in the USA than suggested by income levels.
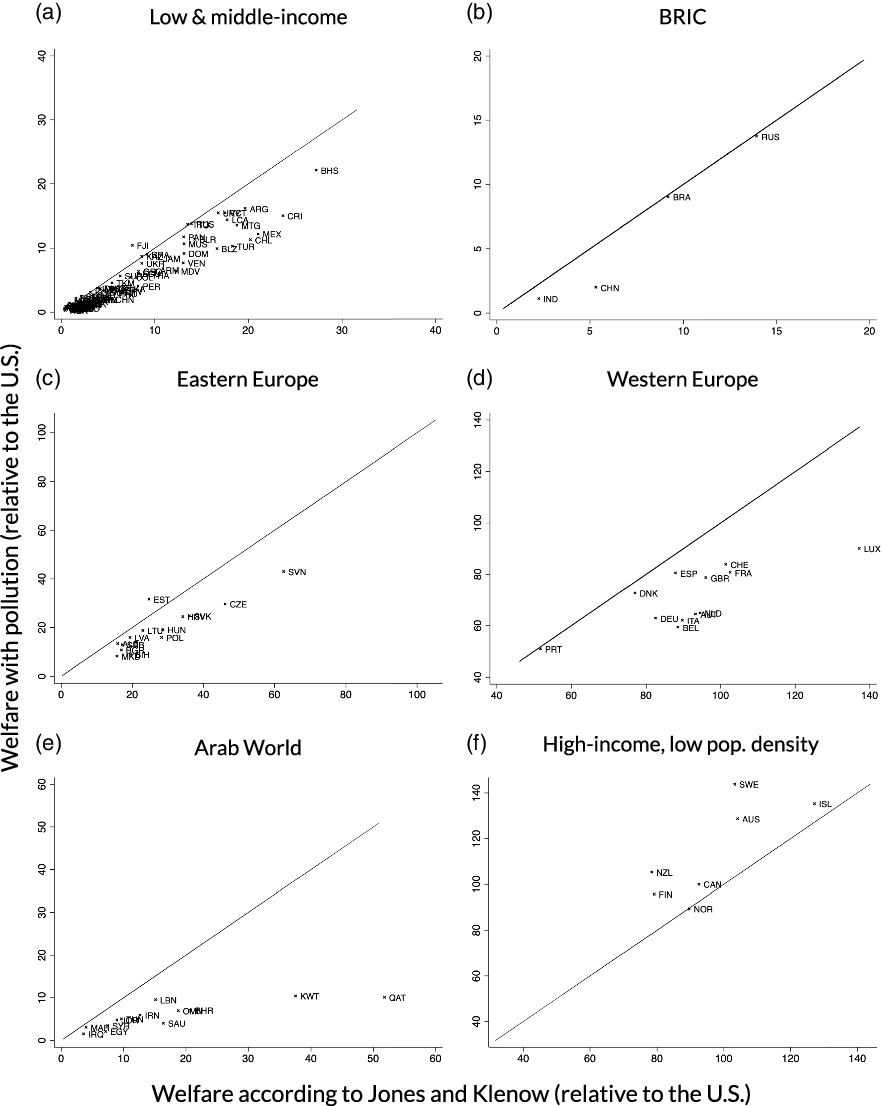
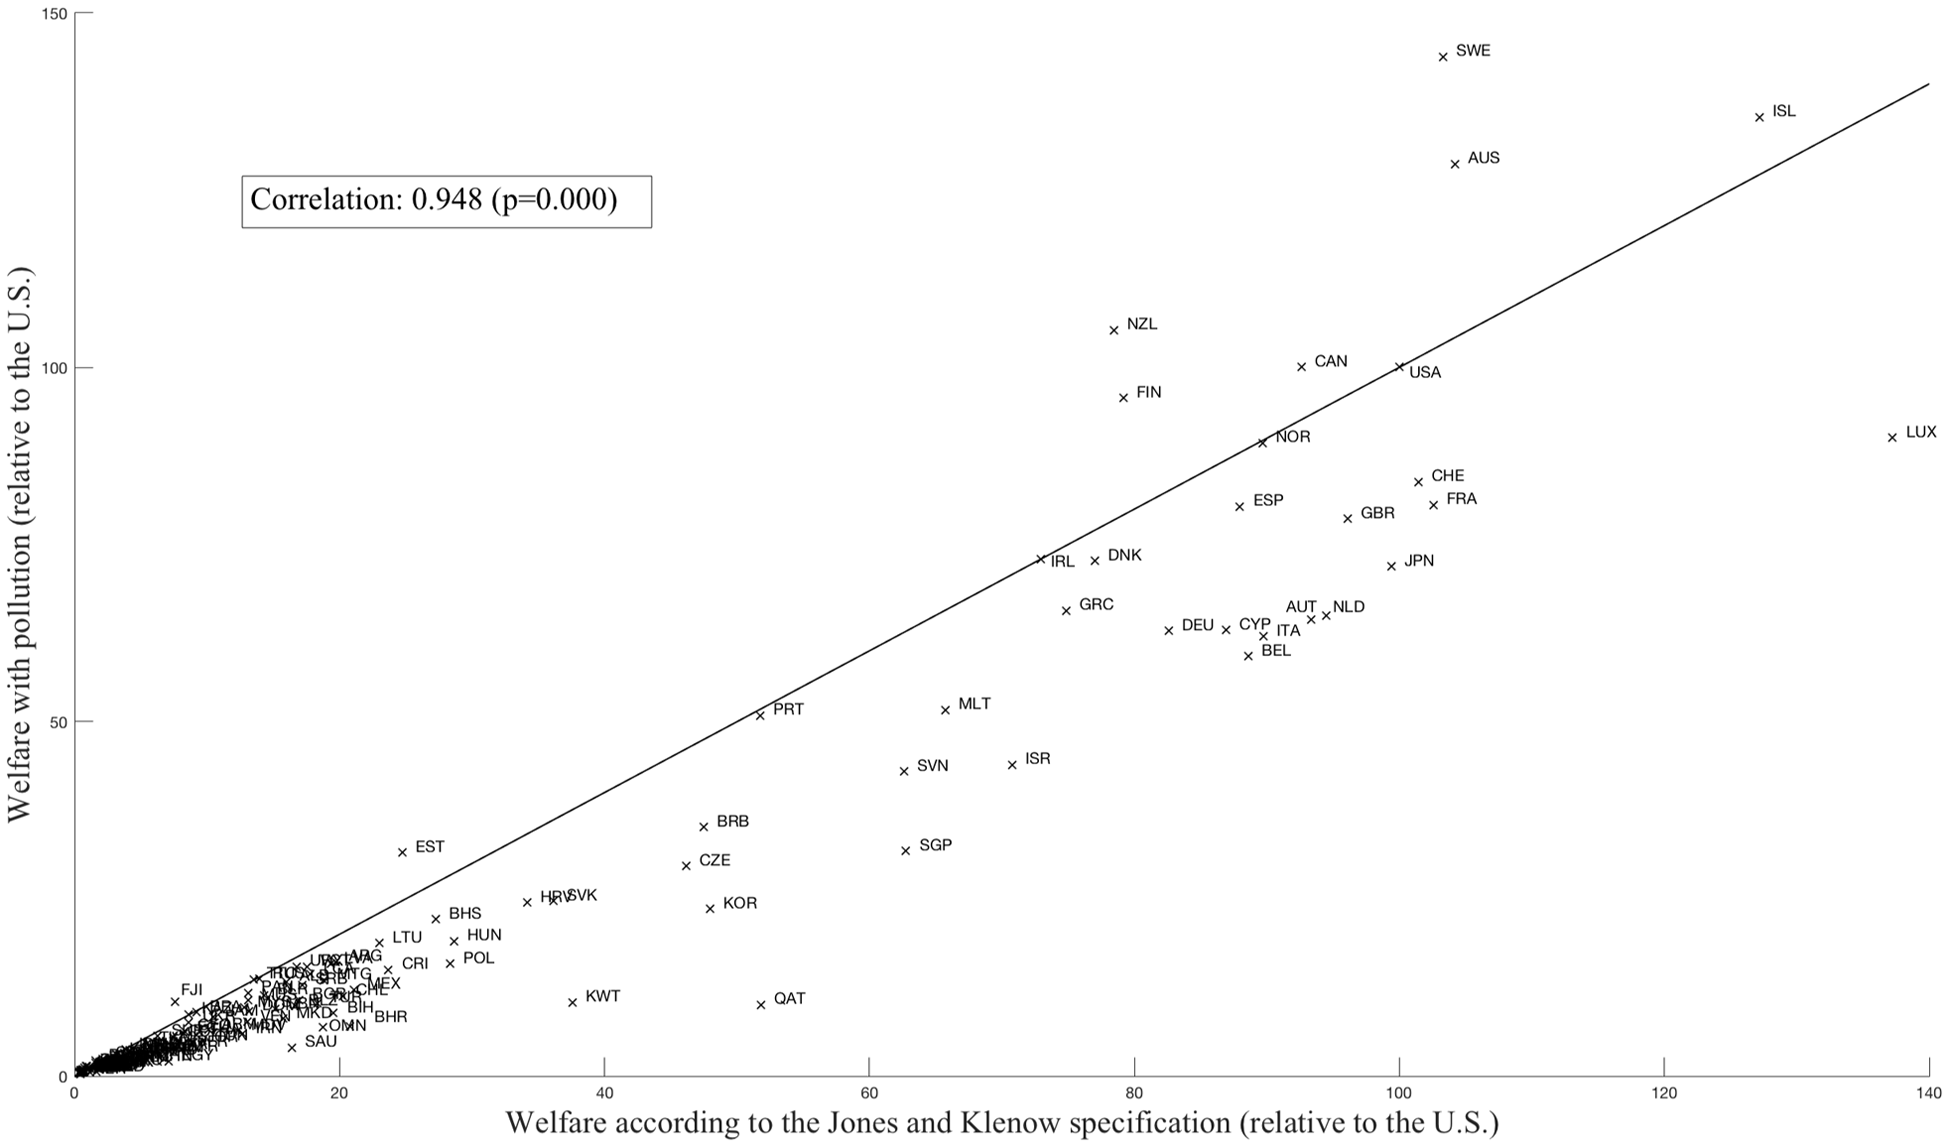
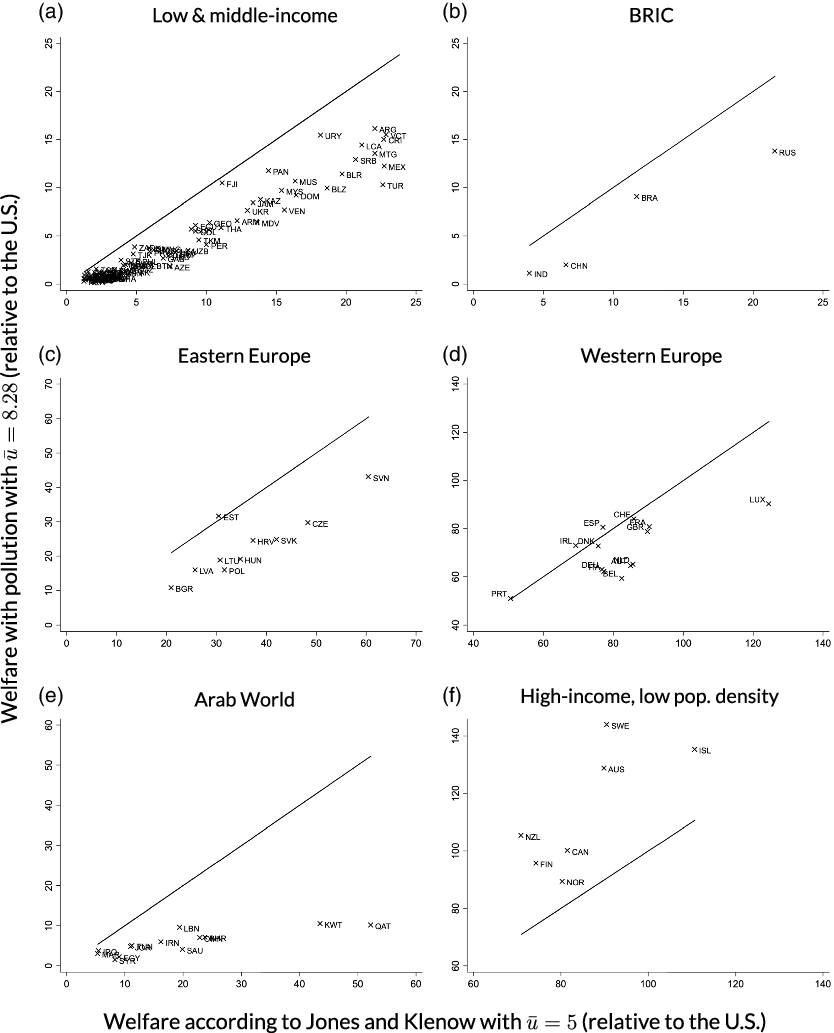
We now assess how taking into account air pollution changes the welfare levels and ranking of countries. Figure 3 compares the welfare measure without air pollution on the x-axis to welfare with air pollution on the y-axis. The figure contains six panels for the six different country groups. The corresponding graph containing all countries can be found in Figure A1 in the Appendix. Countries below the 45° line are worse off, and countries above this line are better off taking air pollution into account relative to the USA which refers to the entry 100 on both axes. The ordering of countries on both axes shows the ranking according to the respective welfare measure both relative to the USA and to each other. For example, if two countries exhibit similar levels of welfare without pollution (x-axis), but different levels of welfare with pollution (y-axis), the country higher up on the axis improves relative to the other country when pollution is taken into account (see e.g. Australia and Sweden in the lower right panel). Likewise, if a country lies to the right of another country on the x-axis, but both show similar y-axis entries, the first country worsens with respect to welfare relative to the other country when pollution is taken into account (see e.g. Kuwait and Qatar in the lower left panel).
Welfare with and without pollution by country groups. Notes: Year 2007. The underlying data are depicted in columns (4) and (6) of Table A.1.

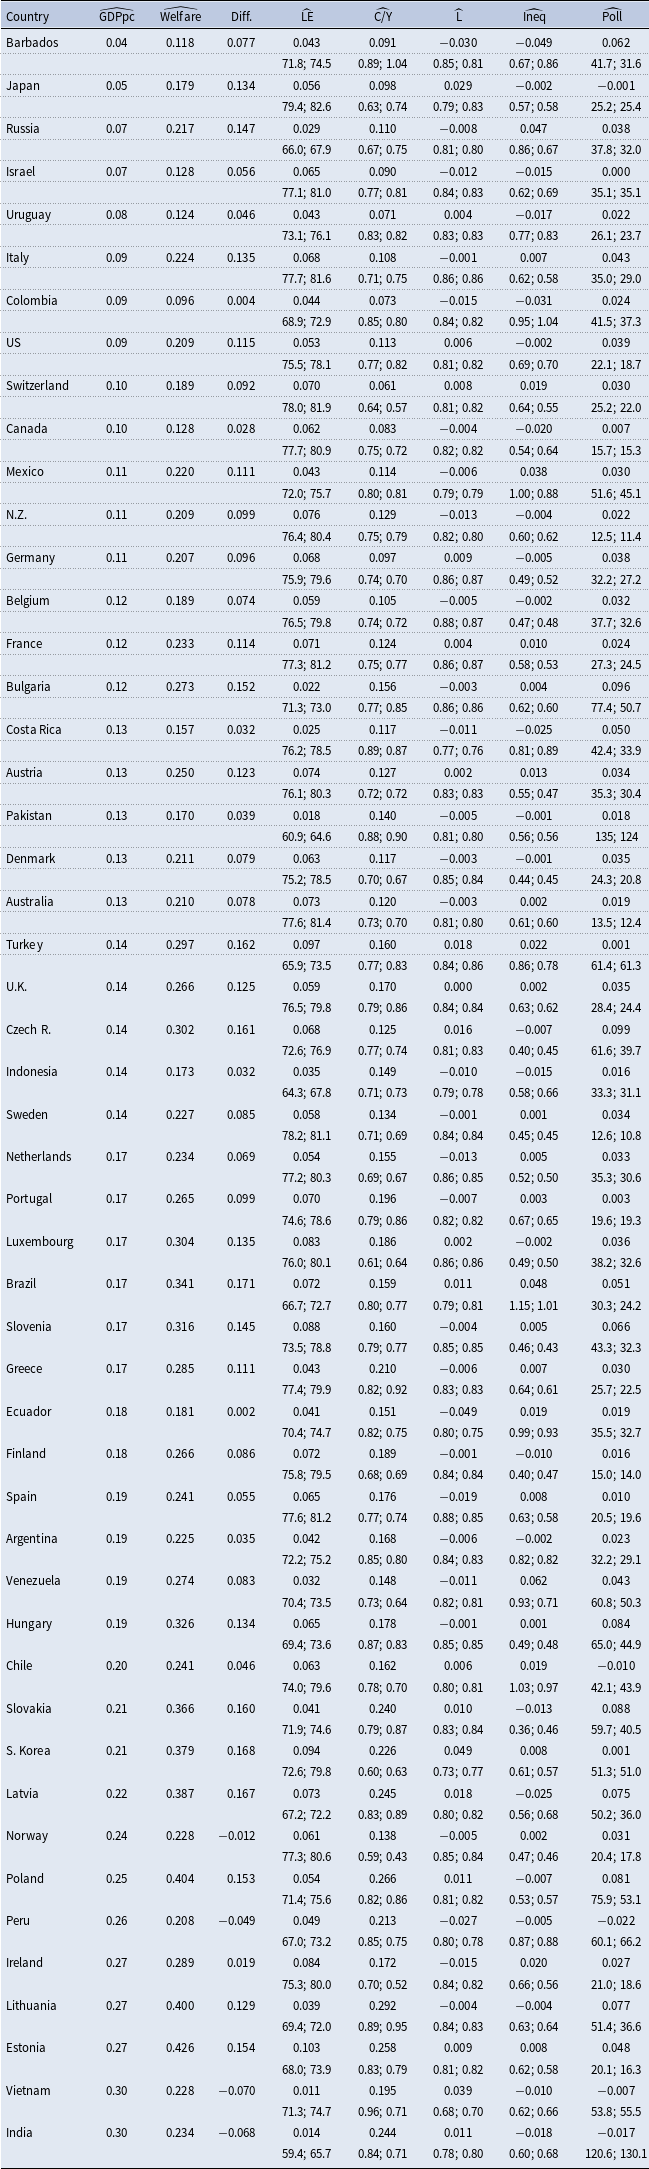
The corresponding measures are also listed in Table A1 in the Appendix including also the Jones and Klenow welfare measure as well as real GDP per capita only. Table A2 in the Appendix further decomposes our welfare measure into the particular components, that is, LE, consumption as a share of GDP (C/Y), leisure (L), inequality (Ineq), and pollution (Poll) for 2007. The second line for each country shows the values of the raw data, namely, LE, the consumption to income ratio, average annual working hours, the standard deviation of consumption, and the PM10 concentration.
Figure 3 shows that most countries reveal welfare losses relative to the USA when pollution is taken into account compared to the Jones and Klenow measure. The upper left graph shows that among the 50 poorest countries in the sample, 70% diverge further from the USA in terms of welfare. Extremely high levels of air pollution of about 227 µg/m3 in Niger, nearly 12 times the reference value of the USA, and about 99 µg/m3 in the Central African Republic, reduce the welfare of these two already poor countries by nearly 167 and 110 log points, respectively. Emerging countries such as India and China also lose out (see upper right graph) as do Eastern European countries (shown in the middle left graph). For Western European countries such as Austria, Germany, France, or Belgium whose welfare ranked higher than GDP per capita compared the USA according to Jones and Klenow, the welfare loss from pollution even outperforms the welfare gains from more leisure and less inequality (compare also Tables A1 and A2). This leads to relatively lower welfare levels compared to just using GDP per capita levels. Germany, for example, with a per capita GDP of about 74% of the USA level in 2007, has a welfare of 83% in terms of the Jones and Klenow specification, but just of about 63% once air pollution is included in our calculation.
The lower left graph exhibits that Arab countries are substantially worse off due to their high air pollution levels. Qatar and Kuwait, both among the top five income countries in 2007, downgrade particularly strongly both relative to the USA and to the other Arab countries. In contrast, Northern high-income countries with a low population density such as Sweden, Iceland, Norway, Finland, Australia, New Zealand, and Canada are countries which improve their relative welfare position when taking air pollution into account (see lower right graph). New Zealand and Finland overtake Norway in the welfare ranking in this case. The sample minimum value of 10.8 µg/m3 increases the Swedish welfare by nearly 40 log points.
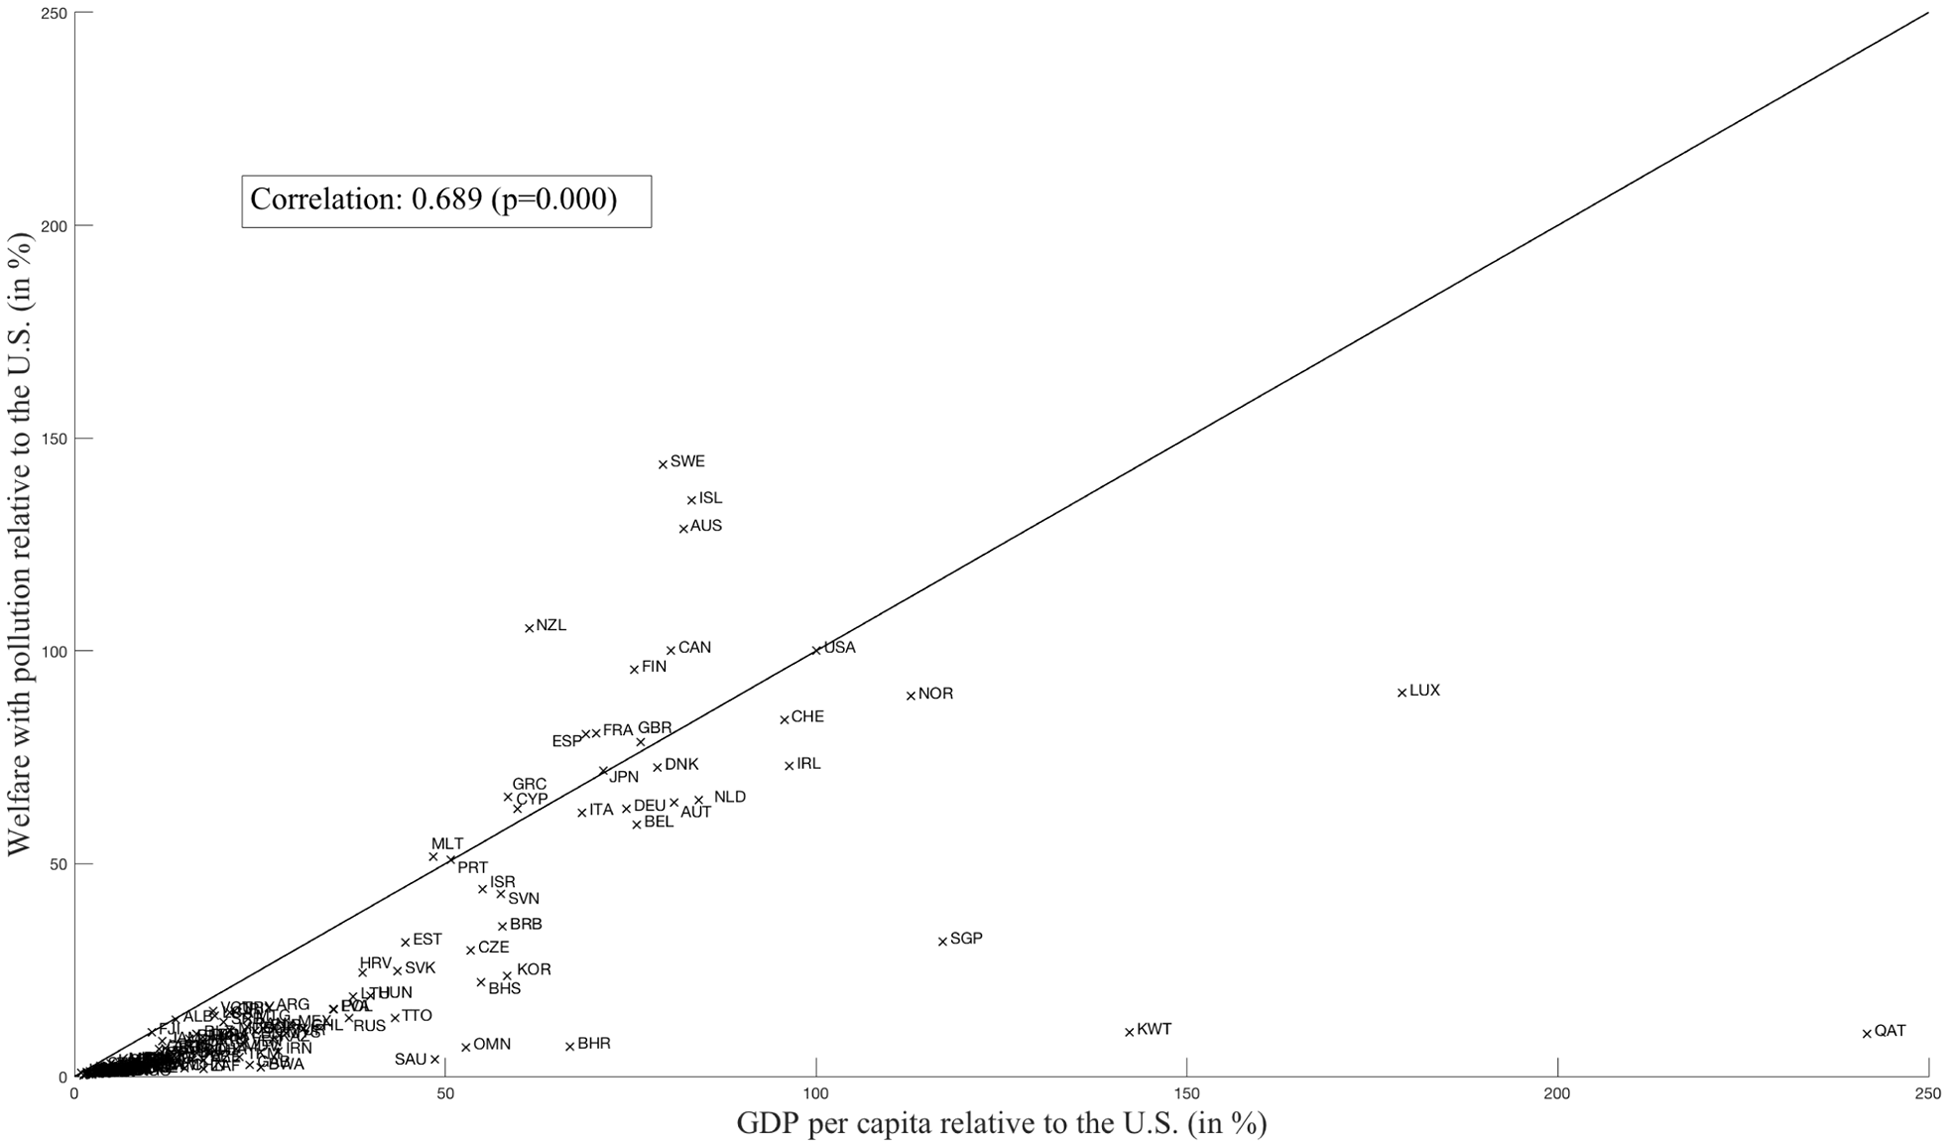
Our welfare measure exhibits a statistically significant correlation of 0.69 with GDP per capita (relative to the USA), which is much lower than the correlation of 0.81 between income and welfare calculated according to the Jones and Klenow framework.Footnote 14 Moreover, the mean absolute deviation between our measure and GDP per capita is 55.3% and the median absolute deviation is 59.8% for the year 2007.Footnote 15 As Figure A2 in the Appendix shows, the majority of countries in our sample lie below the 45° line, meaning that for many countries, assessing welfare simply according to GDP per capita might overestimate their living standards.
3.2. Welfare growth
Next, we consider growth in welfare between 1991 and 2010. Again, all calculations are relative to the USA as the benchmark. We compute 5-year averages of all variables between 1991 and 2010 due to data availability for some variables, but also in order to mitigate short-term fluctuations and measurement error in the original data. We then compute the growth rate between the resulting four time intervals according to
 $g_i=\frac{1}{T}\log (\lambda _i)$
with
 $T=3$
periods [following Jones and Klenow (Reference Jones and Klenow2016)].
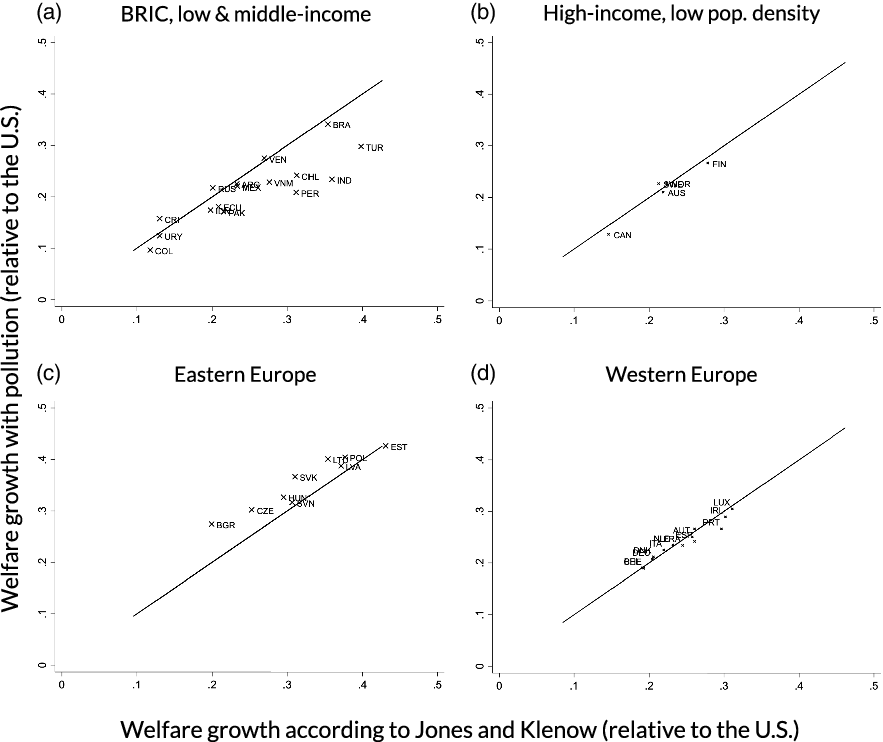
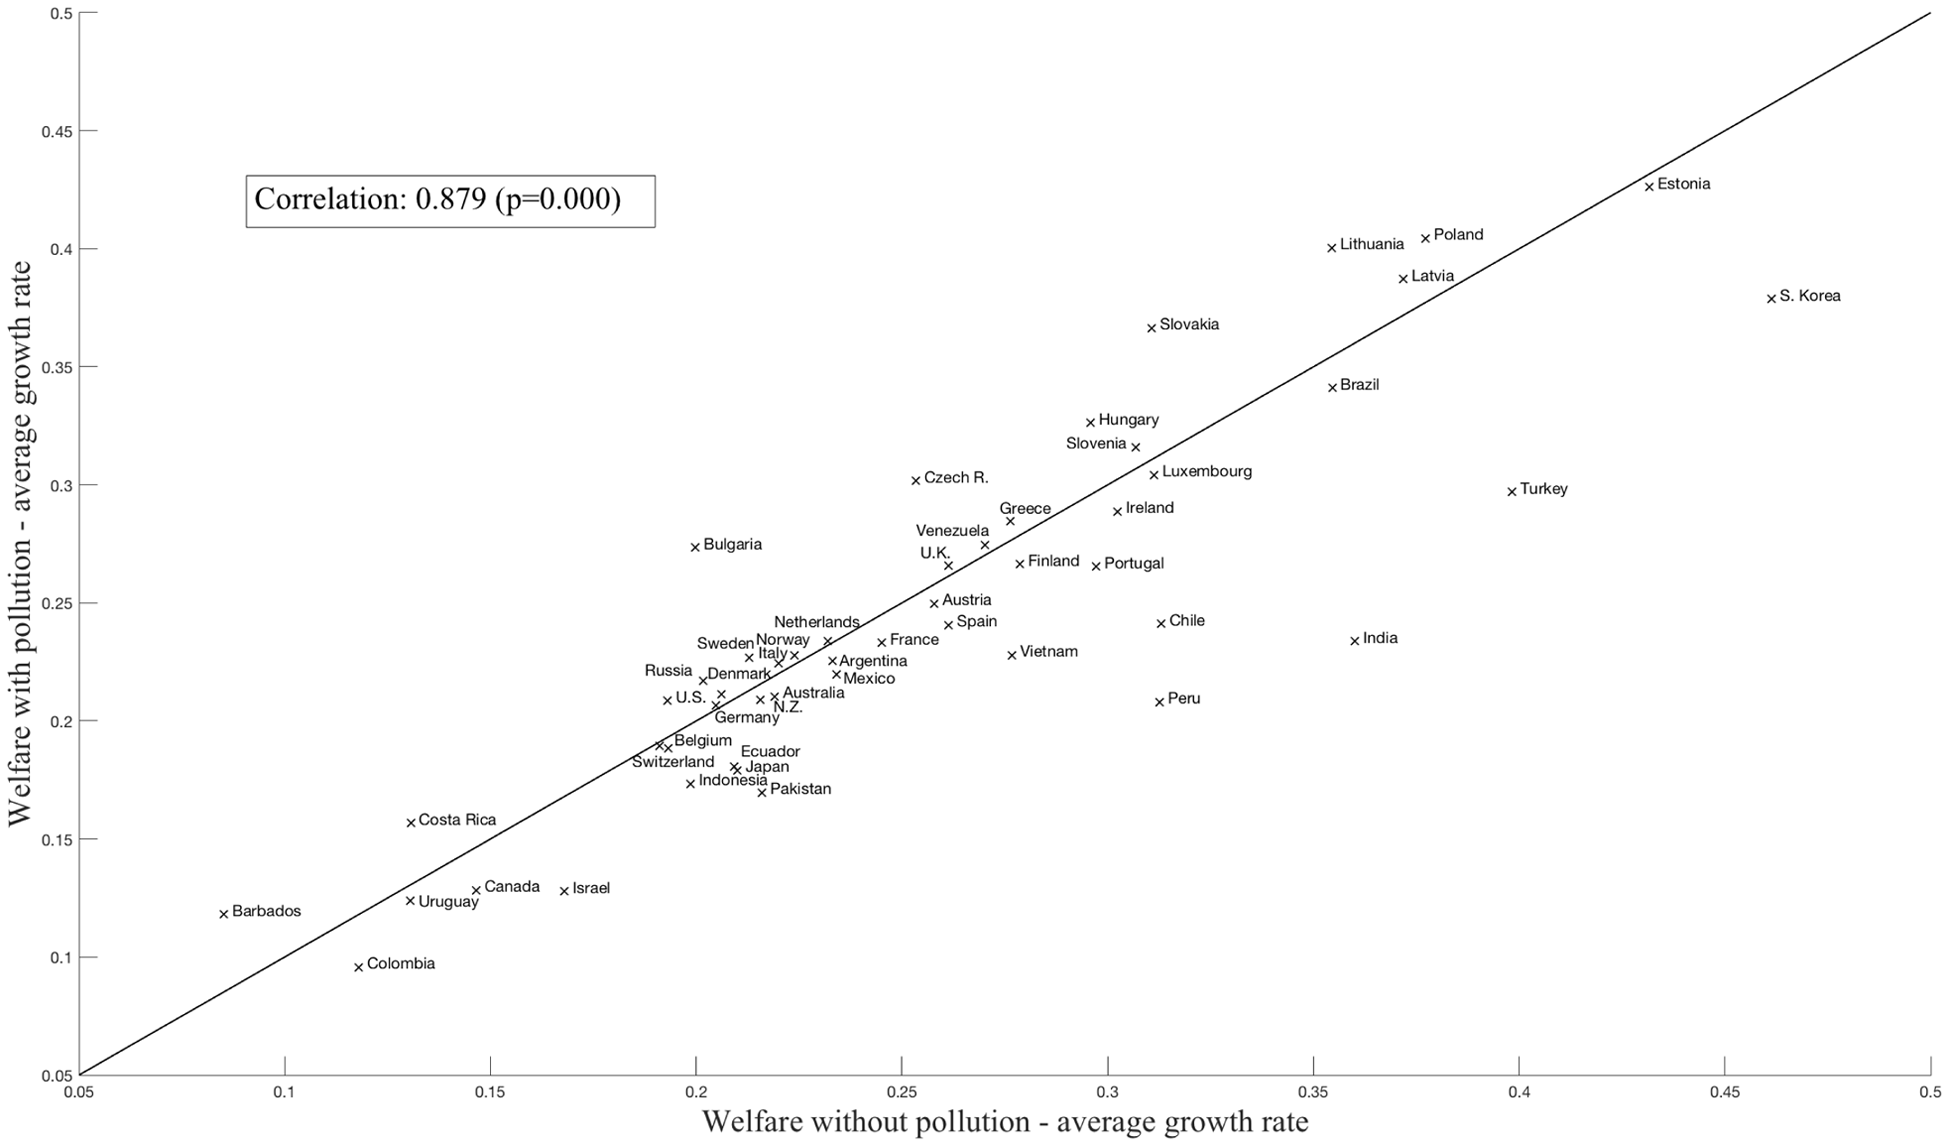
Figure 4 compares the growth rate of our welfare measure to that without air pollution according to the specification of Jones and Klenow. The figure is comparable to Figure 3 for the subset of countries for which we can measure growth developments (see Section 2). Figure A3 in the Appendix shows all countries, Table A3 in the Appendix exhibits the corresponding numbers and shows several components of welfare growth. The two statistics reveal a high and statistically significant correlation of 0.88. Nevertheless, it can be seen that some countries in our sample lie clearly below the 45° line, indicating that welfare growth in these countries has been slower once air quality is taken into account. This is the case especially for the low- and middle-income countries including India and Brazil, the BRIC countries for which we can compute welfare growth. In fact, Central and Eastern Asian countries have suffered from increasing air pollution over the last decades, which is reflected in these results.
Welfare growth with and without pollution by country groups. Notes: Average growth rates for the years 1991−2010. The underlying data are depicted in Table A.3.

India and Vietnam are the two countries with the highest growth rates of GDP per capita in our sample. Our results show that their fast economic growth overstates their actual welfare improvements.Footnote 16 In absolute terms, the particulate matter concentration increased from 120.6 to 130.1 µg/m3 in India and from 53.8 to 55.5 µg/m3 in Vietnam between the first half of the 1990s and the second half of the first decade of the 2000s. The increase in air pollution lowers the growth of our welfare measure by 1.7% per period in India and 0.7% per period in Vietnam, respectively.
Nearly all European countries in our sample were able to decrease their PM10 concentration between the beginning of the 1990s and the end of the first decade of the 2000s. On average, welfare of the EU-28 member states has grown about 1% point faster between the beginning of the 1990s and the second half of the first decade of the 2000s, once the improvement in air quality is taken into account.Footnote 17 As a result, Western European countries mildly improve relative to the USA. The Northern, high-income and low population density countries move parallel to the USA and mildly degrade relative to the USA reflecting not much further improvement at a low level of air pollution.
The group of countries from Eastern Europe was able to achieve high-income growth and even higher welfare growth, and most of these countries clearly lie above the 45° line. This can be explained by the strong reductions of air pollution in many of the former Soviet states after the collapse of the Soviet Union and the approximation of many of these countries to the European Union and its environmental standards. The Czech Republic, as an outstanding example, was able to reduce average air pollution from 61.6 µg/m3 to less than 40 µg/m3 during the given period. Moreover, the integration into the European market enabled these countries to adopt more modern technologies, which helped to reduce air pollution.
3.3. Assessing welfare effects of environmental policy
Calculating growth rates of our welfare measure can also be used to evaluate specific environmental policy measures regarding their welfare effects. As an example, take the “Action Plan on Prevention and Control of Air Pollution Introducing Ten Measures to Improve Air Quality” that was enacted by the Chinese Ministry of Ecology and Environment in 2013Footnote
18
. It aims to improve overall air quality in China over a period of 5 years. In particular, the concentration of particulate matter was planned to be reduced by 25% in the Beijing-Tianjin-Hebei Province, 20% in the Yangtze River Delta, and 15% in the Pearl River Delta. Weighting this by the relative population shares of these three regions translates into a reduction of about 5% for the overall Chinese stateFootnote
19
. Taking the data for 2013 for ChinaFootnote
20
and assuming that there are no changes besides the reduction in the particulate matter concentration delivers an annual welfare growth of 0.7% (growth rate of
 $\lambda$
) over the period of 5 years, which is the time frame of the action plan. Since
 $\lambda$
is the consumption equivalent, this means that in terms of consumption, Chinese people, on average, would be willing to accept an annual decrease of consumption by 0.7% if the goals of the action plan were realized. With a real GDP per capita of 11.673 USD (PPP) of which 51% were being consumed by either private households or the government, this translates into forgone consumption of about 30 USD (PPP) a year per capita over 5 years.
4. Robustness of results
We address four robustness tests to check whether our results hold qualitatively if we deviate from our basic assumptions. First, we address the role of the value of a statistical life
 $\bar{u}$
. Second, we vary
 $\kappa$
which critically defines the disutility of pollution. Third, we deviate from the assumption of separability of air pollution with consumption and leisure in our utility specification. Fourth, we compute the compensating rather than the equivalent variation.
4.1. Value of
 $\bar{u}$

Compared to the calibration in Jones and Klenow (Reference Jones and Klenow2016), we have increased the value of a statistical life
 $\bar{u}$
in our assessment in order to avoid negative flow utilities in some countries.
 $\bar{u}$
shifts the flow utility by the same constant for all countries, but the flow utility is weighted with LE which affects different countries differently. If we compute the welfare measure without pollution with
 $\bar{u}=5$
as in Jones and Klenow, it is highly correlated (correlation of 0.98) with the same welfare measure without pollution with
 $\bar{u}=8.28$
which we have used in our baseline results. Figure A8 in the Appendix compares our baseline to welfare without pollution with
 $\bar{u}=5$
. It is visible that a higher value of
 $\bar{u}$
makes countries with high LE better off relative to countries with low LE. The results are still very similar to those in Figure 3.
4.2. Varying
$\kappa$

Our baseline calibration of
 $\kappa^{\textrm{base}} = 0.67$
is based on the regression coefficients of Levinson (Reference Levinson2012) in his specification with log-income and log-pollution. We compare this to
 $\kappa ^{\textrm{FLST}}=1.5$
as implied by Freeman et al. (Reference Freeman, Liang, Song and Timmins2019) (see Section 2.3). Note that this value lies within a range of
 $\kappa ^{\textrm{min}}=0.03$
and
 $\kappa ^{\textrm{max}}=1.87$
which are values implied by the 95% confidence intervals of the estimated coefficients in Levinson. If we calculate the willingness to pay for a 1 µg/m3 reduction in PM10 at the average income and average pollution level based on
 $\kappa ^{\textrm{max}}=1.5$
, we obtain a value of 2098 US dollars compared to 974 US dollars for the baseline. This would correspond to a willingness to pay of 82.7 US dollars for a one standard deviation reduction in PM10 for one day.Footnote
21
We recalculate our welfare measures keeping everything else equal except for
 $\bar{u}$
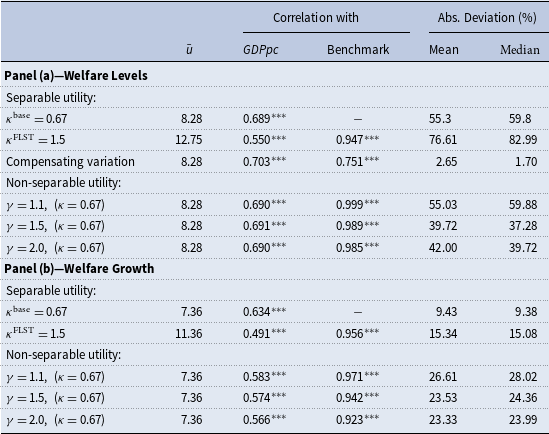
which we need to recalibrate following the strategy outlined in Section 2.3 in order to avoid negative flow utilities in several countries. Table 1 shows that a higher
 $\kappa$
implies a lower correlation of welfare in levels with GDP per capita and a higher absolute deviation relative to this measure (see Panel a). Similar patterns arise for growth rates (see Panel b). Hence, increasing
 $\kappa$
lets welfare measures deviate even more from GDP per capita (growth rates). Increasing
 $\kappa$
results in a measure very highly correlated to the benchmark calibration. For most countries, the relative welfare levels and growth rates do not change substantially. Unsurprisingly, a few countries with very high pollution levels lose out substantially. India moves down 38 ranks in the welfare comparison across countries. Equally worse off are the Arab countries (between a loss of 32 ranks for Qatar to 16 ranks for Bahrain), some African countries (Chad, Zimbabwe, South Africa, Egypt, Mali, and Benin), and also Poland (down 11 ranks), Pakistan and China which lose 10 ranks each in the welfare ranking. While Poland retains 43% of its baseline welfare, India finds itself at a level as low as 6% of the baseline welfare measurement.Footnote
22
Robustness checks—Summary results

Benchmark case refers to the baseline calculations in this paper. Absolute deviation is measured relative to GDP per capita.
 $^{*}\!p\lt 0.1,\ ^{**} \ p\lt 0.05,\ ^{***} \ p\lt 0.01$
.
4.3. Non-separable utility function
Extending a comparable non-separable utility function in Jones and Klenow (Reference Jones and Klenow2016), we consider the following general flow utility
 \begin{equation} U(c,l,p)=\bar{u}+\frac{c^{1-\gamma }(p^{-\kappa })^{1-\gamma }[1+(\gamma -1)v(l)]^{\gamma }-1}{1-\gamma }, \end{equation}
with
 $\gamma \ge 1$
, which leads to consumption and leisure being substitutes.Footnote
23
Equation (4) converges to our benchmark specification for
 $\gamma \rightarrow 1$
. According to equation (4), the marginal utility of pollution is negative, for example,
 $U_p\lt 0$
, which is straightforward. Moreover, the marginal utility of consumption increases in the level of air pollution (
 $U_{cp}\gt 0)$
, while the marginal utility of leisure decreases in it (
 $U_{lp}\lt 0)$
. The economic interpretation is the following: The higher the level of air pollution, the more the individual prefers consumption over leisure, all else equal. This is in line with one of the theoretical arguments in Hanna and Oliva (Reference Hanna and Oliva2015).Footnote
24
Multiplying equation (4) by LE, applying condition (2), and rearranging yields the values of
 $\lambda _i$
for the case of a non-separable utility function (see Appendix A.1.2 for the derivation). Table 1 shows the results for different values of
 $\gamma$
keeping all other parameters the same. Even when
 $\gamma$
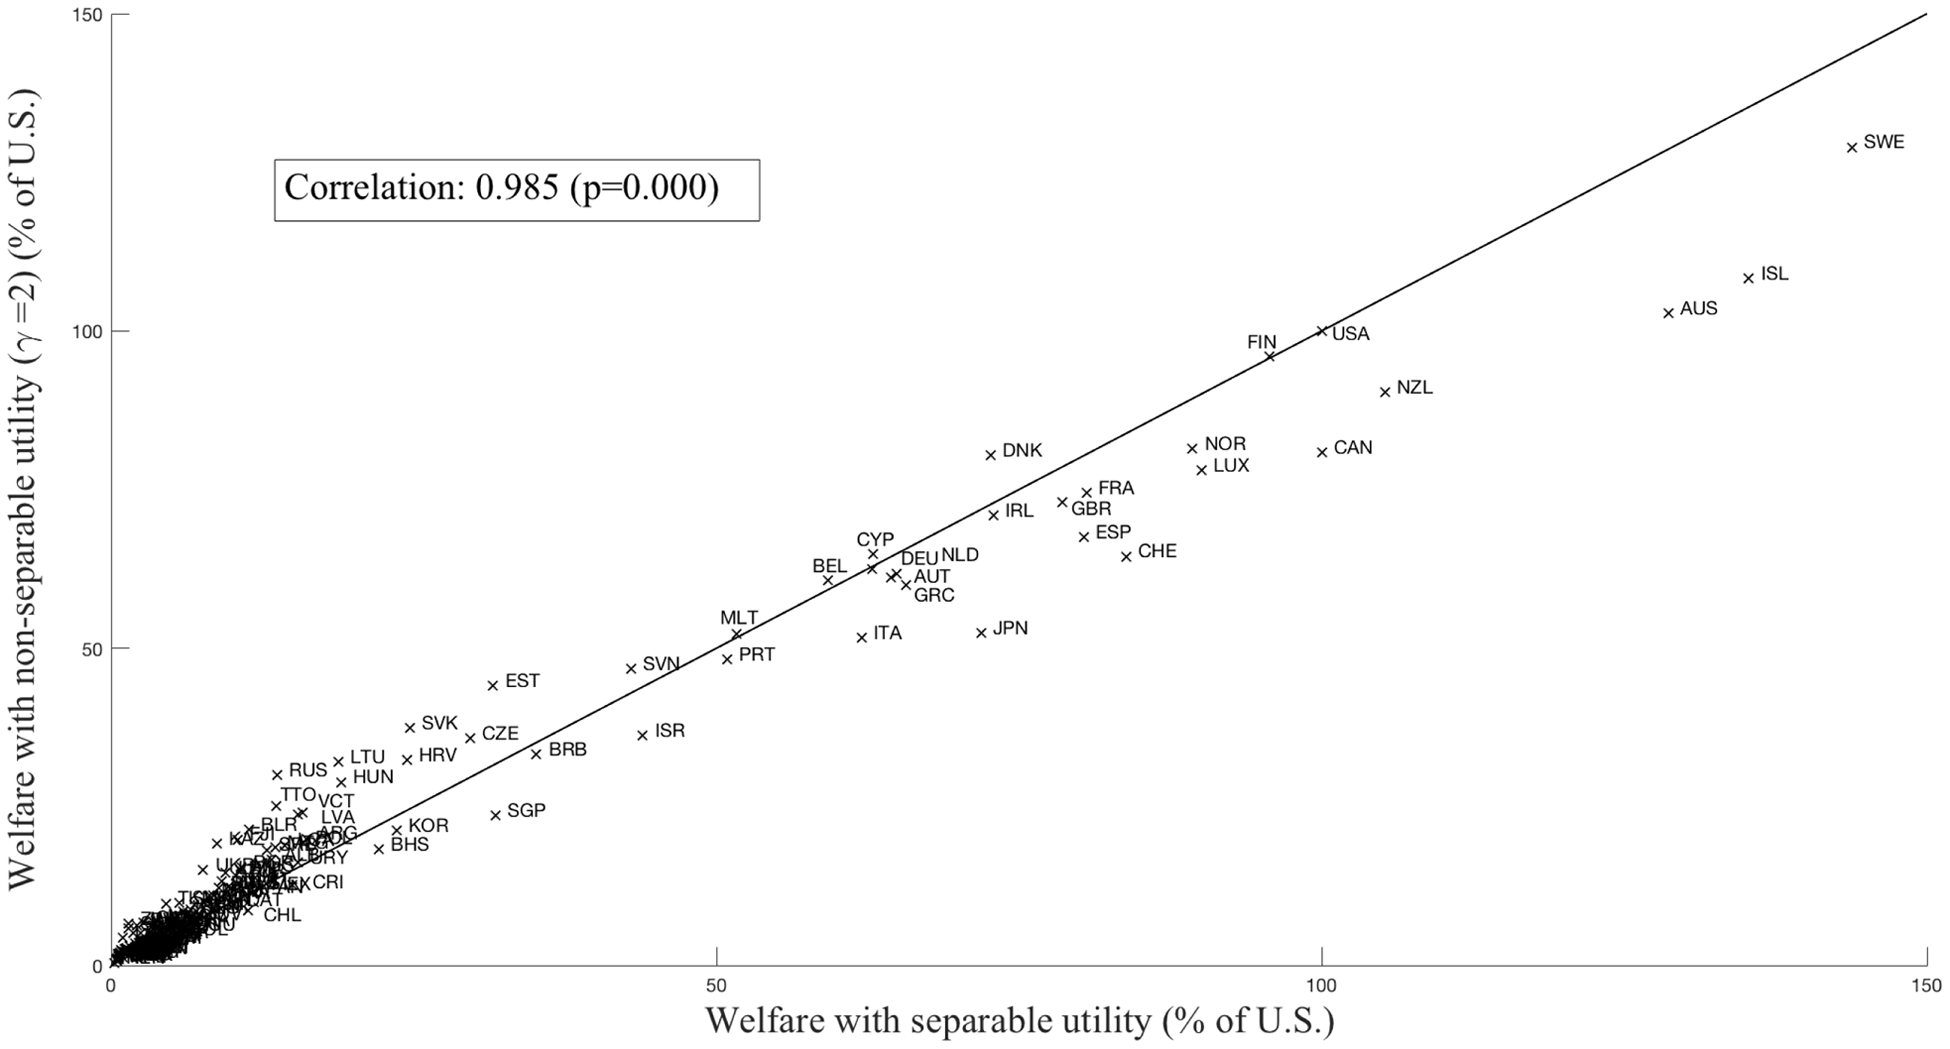
is considerably larger than one, the correlation between welfare with non-separable utility and our baseline specification is close to one and highly statistically significant. The correlation with GDP per capita changes only very little. Hence, our results about the relative welfare position of countries in terms of levels are robust to relaxing the separability assumption.Footnote
25
Regarding the results for welfare growth, switching from the separable to the non-separable case alters the results slightly more than in the case of welfare levels. Even for
 $\gamma =2$
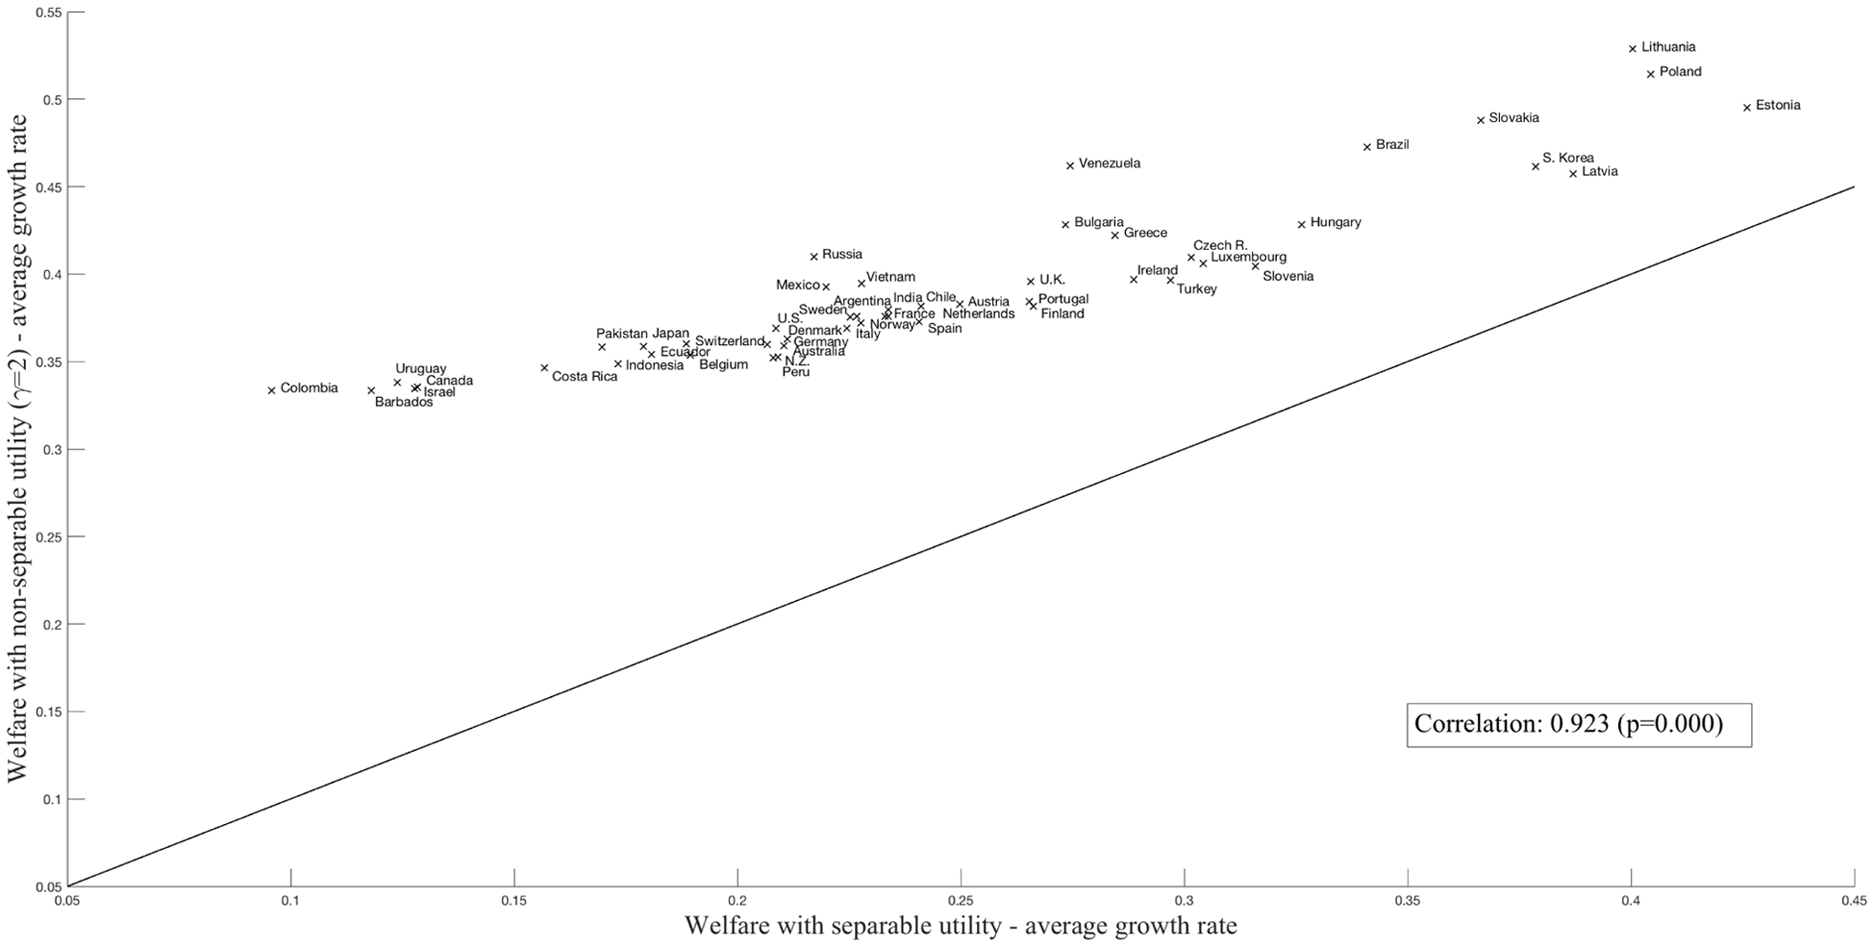
, the correlation between the results of both specifications is close to one and highly statistically significant even if the mean and median absolute deviation to GDP per capita growth both increase by about 14% points compared to the separable case. Figure A7 in the Appendix visualizes that all of the countries for which we are able to calculate welfare growth rates are better off in the case with non-separable utility than in the separable case.
The robustness checks show that relaxing the assumption of linear separable utility does not alter the results qualitatively on average. However, as explained above, the non-separable utility specification changes the trade-off between the subcomponents by allowing pollution to influence their marginal utilities. This is especially relevant for countries with high levels of air pollution with respect to their welfare rank. China and India, as examples, that rank 81 and 110, respectively, out of 148 countries with regard to their GDP per capita in 2007 (relative to the USA), drop to rank 104 and 122 with separable utility and even further to rank 113 and 128 with non-separable utility.Footnote 26 The same is true for Qatar, the country with the highest per capita income in 2007, whose rank drops from 59 in the separable case to 65 in the non-separable case, showing that not only medium-income and low-income countries are affected by a change in the specification. This shows that although our results are robust to relaxing the assumption about separable utility on average, for some countries their welfare ranking depends substantially on the form of the underlying utility function.
4.4. Compensating variation
Our welfare assessment is based on the equivalent variation described in equation (2) and specifically in equation (A2). The equivalent variation tells us by how much a person living in the USA has to be compensated in terms of consumption to be indifferent to living in a particular country. Following Jones and Klenow (Reference Jones and Klenow2016), one can also compute a compensating variation. The compensating variation tells us by how much a person living in a particular country has to be compensated in terms of consumption to be indifferent to living in the USA. Equations (A13) and (A14) in the Appendix describe this formally. Table 1 compares the compensating variation to both GDP per capita and our benchmark for welfare levels. Welfare assessment based on compensating variation is a bit more closely related to GDP and correlates positively with our benchmark, but not perfectly. This is due to the fact that the compensating variation weighs flow utilities with different relative live expectancy in both measures. Hence, countries that have a low flow utility compared to the USA (e.g. due to low consumption or high pollution) and a low relative LE will be worse off in the compensating variation compared to the equivalent variation. On average, equivalent and compensating variation deliver close measures, however, as the absolute mean and median deviation documents.
5. Conclusion
We measure relative welfare in levels and growth rates across countries based on the equivalent variation approach by Jones and Klenow (Reference Jones and Klenow2016) taking into account the role of air pollution. In particular, we model the disutility from air pollution in the form of particulate matter concentration and calibrate the disutility parameter with recent estimates on the revealed willingness to pay for clean air. We compute consumption equivalents for 148 countries for the year 2007 and welfare growth over the period 1991 until 2010 for 50 countries.
We show that accounting for air quality remarkably influences many countries worldwide with respect to both their relative welfare levels and their welfare development over time. In particular, our results further strengthen one of the main findings from Jones and Klenow (Reference Jones and Klenow2016) that many low- and middle-income countries seem to be even poorer in terms of welfare than suggested by their income levels. Moreover, we can show that they have caught up less with the group of highly developed countries than has been suggested by their relatively high-income growth over the last two decades. These findings shed a different light on the well-known discussion of economic convergence and highlight the importance of air quality to be considered by policy-makers especially in developing and emerging countries. With respect to many Western European countries, leaving out air quality seems to overestimate their welfare levels, since most of these densely populated countries exhibit relatively high levels of air pollution, although most of them have been able to reduce them significantly over the last two decades. This partly counteracts the findings from Jones and Klenow, who state that many Western European countries are actually better off in terms of welfare than in terms of simple income.
Our results are, on average, robust to different values of the air pollution disutility parameter and to relaxing the assumption of linear separable utility. Nevertheless, a nested utility function that allows air pollution to influence the marginal utility of consumption and leisure alters the results for countries with very high levels of air pollution, which seems both plausible and in line with the literature.
High concentration of particulate matter is not only a concern in developing and emerging countries, as the recent measures of the Chinese government show, but also of huge interest in many highly developed countries, as the current debate about diesel cars in Germany underlines. Our approach can be used for ceteris paribus welfare assessments of concrete policy measures as we have shown exemplary for a recent Chinese action plan for cleaner air. Moreover, future research should focus on considering and quantifying different preferences across countries and over time regarding the trade-off between economic development and environmental degradation, a fact that is mostly ignored in the literature but yet important to derive practical policy implications. Additionally, while this paper focuses on air pollution with particulate matter, it is widely known that several other air pollutants negatively affect people’s well-being. In light of the current heated debate about banning diesel vehicles from the centers of several German cities, future research should in particular expand to evaluate the welfare effects of oxides of nitrogen in order to shed light on the actual costs and benefits from such interventions.
Our framework could be extended to account for environmental aspects other than air quality as well. These may affect utility through basic needs such as water access and quality which is particularly relevant in developing countries or for particular population groups in emerging countries. Other environmental aspects may also more strongly relate to consumption inequality as they are related to the risk of natural disasters. This risk may be relevant for all countries, but also different across countries depending on geographic characteristics. We leave the assessment of the equivalent variation in welfare with respect to other environmental aspects to future work.
A. Appendix
A.1. Derivation of
$\lambda$

A.1.1 A.1.1 Separable utility
From equation (2) follows:
 \begin{equation} \begin{array}{ll@{\quad}l} \log (\lambda _i)=\frac{e_i-e_{us}}{e_{us}}[\bar{u}+ \log (c_i) & +\;v(l_i)-\frac{1}{2}\sigma _i^2-\kappa \log\!(p_i)] & \textrm{Flow Utility}\\[5pt] & +\;\log\!(c_i)-\log\!(c_{us}) & \textrm{Consumption}\\[5pt] & +\; v(l_i)-v(l_{us}) & \textrm{Leisure}\\[5pt] & -\;\frac{1}{2}(\sigma _i^2-\sigma _{us}^2) & \textrm{Inequality}\\[5pt] & -\; \kappa [\log\!(p_i)-\log\!(p_{us})] & \textrm{Air Pollution} \end{array} \end{equation}
In terms of consumption shares,
 $\frac{c_i}{y_i}$
, where
 $y_i$
is country
 $i$
’s GDP per capita, rather than its absolute value, this can be written as:
 \begin{equation} \begin{array}{ll@{\quad}l} \log\!\left(\frac{\lambda _i}{\tilde{y_i}}\right)=\frac{e_i-e_{us}}{e_{us}}[\bar{u}+ \log\!\left(\frac{c_i}{y_i}\right) & +v(l_i)-\frac{1}{2}\sigma _i^2-\kappa \log (p_i)] & \textrm{Flow Utility}\\[5pt] & +\;\log\!\left(\frac{c_i}{y_i}\right)-\log\!\left(\frac{c_{us}}{y_{us}}\right) & \textrm{Consumption}\\[5pt] & +\; v(l_i)-v(l_{us}) & \textrm{Leisure}\\[5pt] & -\;\frac{1}{2}\left(\sigma _i^2-\sigma _{us}^2\right) & \textrm{Inequality}\\[5pt] & -\; \kappa [\!\log (p_i)-\log (p_{us})] &\textrm{Air Pollution} \end{array} \end{equation}
with
 $\tilde{y_i}=\frac{y_i}{y_{us}}$
as country
 $i$
’s GDP per capita relative to that of the USA.
A.1.2 A.1.2 Non-separable utility
Expected utility: Rewrite equation (4) as
 \begin{align} E\left [U(c,l,p)\right ] &= \bar{u} + E\left [\frac{c^{1-\gamma }(p^{-\kappa })^{1-\gamma }\left (1-(\gamma - 1) v(l)\right )^{\gamma }-1}{1-\gamma }\right ] \nonumber \\[5pt] &= \bar{u} \frac{E\left [c^{1-\gamma }\right ](p^{-\kappa })^{1-\gamma }\left (1-(\gamma - 1) v(l)\right )^{\gamma }-1}{1-\gamma } \end{align}
As
 $c$
is assumed to be log-normally distributed, that is,
 $\log (c)\sim \mathcal{N}(\mu,\sigma ^2)$
. From that it follows that
 \begin{align} \mu = E\left [\log (c)\right ] = \log (c) - \frac{1}{2}\sigma ^2 \end{align}
with
 $c$
as the arithmetic mean and
 $\sigma ^2$
as the variance of
 $\log (c)$
. We then use that
 \begin{align} E\left [c^{1-\gamma }\right ] &= e^{(1-\gamma )\mu + \frac{1}{2}(1-\gamma )^2 \sigma ^2}= e^{(1-\gamma )\left (\log (c) - \frac{1}{2}\sigma ^2 \right ) + \frac{1}{2}(1-\gamma )^2 \sigma ^2} \end{align}
to express the expected utility as:
 \begin{align} E\left [U(c,l,p)\right ] = \left [\bar{u}+\frac{\left [e^{(1-\gamma )\left (\log (c) - \frac{1}{2}\sigma _i^2 \right ) + \frac{1}{2}(1-\gamma )^2 \sigma ^2}\right ](p^{-\kappa })^{1-\gamma } \left (1-(\gamma - 1) v(l)\right )^{\gamma }-1}{1-\gamma } \right ] \end{align}
Limiting case
 $\gamma \rightarrow 1$
: For
 $\gamma \rightarrow 1$
, the non-separable utility converges to the separable utility. The same is the case for the expected values. This can be shown by applying l’Hôpital’s rule to the utility function. First, consider the following expression
 \begin{align} &\lim _{\gamma \rightarrow 1}\frac{c^{1-\gamma }(p^{-\kappa })^{1-\gamma }\left (1-(\gamma - 1)v(l)\right )^{\gamma }-1}{1-\gamma }= \lim _{\gamma \rightarrow 1}\frac{e^{(1-\gamma )(\log (c) -\kappa \log (p))\gamma \log (1-(\gamma - 1) v(l))}-1}{1-\gamma } \end{align}
Then, take the derivative of the nominator and the denominator
 \begin{align} &= \lim _{\gamma \rightarrow 1}\frac{e^{(1-\gamma )(\log (c) -\kappa \log (p))}(\!-\!\log\!(c)+\kappa \log\!(p))e^{\gamma \log\!(1-(\gamma - 1) v(l))}}{-1}+ \nonumber \\ & \hspace{1.2cm} \frac{e^{(1-\gamma )(\log (c) -\kappa \log (p))}e^{\gamma \log (1-(\gamma - 1) v(l))}\left (\log (1-(\gamma - 1) v(l)) - \frac{\gamma }{1-(\gamma - 1) v(l)} v(l)\right )}{-1}\nonumber \\ &= \log (c) - \kappa \log (p) + v(l) \end{align}
Applying the same rule to the expected utility yields:
 \begin{align} E\left [U(c,l,p)\right ]= \log (c) - \frac{1}{2}\sigma ^2 - \kappa \log (p) + v(l) \end{align}
Calculating the Equivalent Variation: Based on the above, we write expected utility for each country
 $i$
and the USA as
 \begin{align} & U_{i}(e_i,c_i,l_i,\sigma _i,p_i) = e_i\left [\bar{u}+\frac{\left [e^{(1-\gamma )\left (\log (c_i) - \frac{1}{2}\sigma _i^2 \right ) + \frac{1}{2}(1-\gamma )^2 \sigma _i^2}\right ] (p_i^{-\kappa })^{1-\gamma } \left (1-(\gamma - 1) v(l_i)\right )^{\gamma }-1}{1-\gamma } \right ]\nonumber \\[5pt] & U_{us}(e_{us},c_{us},l_{us},\sigma _{us},p_{us}) \nonumber \\[5pt] & = e_{us}\left [\bar{u}+\frac{\left [e^{(1-\gamma )\left (\log (c_{us}) - \frac{1}{2}\sigma _{us}^2 \right ) + \frac{1}{2}(1-\gamma )^2 \sigma _{us}^2}\right ] (p_{us}^{-\kappa })^{1-\gamma } \left (1-(\gamma - 1) v(l_{us})\right )^{\gamma }-1}{1-\gamma } \right ] \end{align}
We then set
 \begin{align} U_{i}(e_i,c_i,l_i,\sigma _i,p_i) = U_{us}(e_{us},\lambda _i c_{us},l_{us},\sigma _{us},p_{us}) \end{align}
and solve for
 $\lambda$
:
 \begin{align} & e_i\left [\bar{u}+\frac{\left [e^{(1-\gamma )\left (\log (c_i) - \frac{1}{2}\sigma _i^2 \right ) + \frac{1}{2}(1-\gamma )^2 \sigma _i^2}\right ] (p_i^{-\kappa })^{1-\gamma } \left (1-(\gamma - 1) v(l_i)\right )^{\gamma }-1}{1-\gamma } \right ]\nonumber \\ &\Leftrightarrow \lambda _i = \nonumber \\ & \!\!\left [\!\frac{(e_i-e_{us})\left (\bar{u}(1-\gamma )-1\right ) + e_i\left [e^{(1-\gamma )\left (\log (c_i) - \frac{1}{2}\sigma _i^2 \right ) + \frac{1}{2}(1-\gamma )^2 \sigma _i^2}\right ] (p_{i}^{-\kappa })^{1-\gamma } \left (1-(\gamma - 1) v(l_i)\right )^{\gamma }}{e_{us}\left [e^{(1-\gamma )\left (\log (c_{us}) - \frac{1}{2}\sigma _{us}^2 \right ) + \frac{1}{2}(1-\gamma )^2 \sigma _{us}^2}\right ] (p_{us}^{-\kappa })^{1-\gamma } \left (1-(\gamma - 1) v(l_{us})\right )^{\gamma } } \!\right ]^{\frac{1}{1-\gamma }} \end{align}
A.1.3 A.1.3 Compensating variation
The compensating variation is derived by solving
 \begin{align} U_{i}(e_i,\lambda ^{cv}_i c_i,l_i,\sigma _i,p_i) = U_{us}(e_{us},c_{us},l_{us},\sigma _{us},p_{us}) \end{align}
for
 $\lambda _i$
.
Applying the compensating variation to our separable utility case then delivers
 \begin{equation} \begin{array}{ll@{\quad}l} \log\!\left(\frac{\lambda ^{cv}_i}{\tilde{y_i}}\right) = \frac{e_i-e_{us}}{e_{i}}[\bar{u} +\log\!\left(\frac{c_{us}}{y_{us}}\right) &+\;v(l_{us})-\frac{1}{2}\sigma _{us}^2-\kappa \log (p_{us})] & \text{Flow Utility} \\ & +\;\log\!\left(\frac{c_i}{y_i}\right)-\log \left(\frac{c_{us}}{y_{us}}\right) & \textrm{Consumption}\\ & +\;v(l_i)-v(l_{us}) & \textrm{Leisure}\\ & -\;\frac{1}{2}(\sigma _i^2-\sigma _{us}^2) & \textrm{Inequality}\\ & -\;\kappa [\log (p_i)-\log (p_{us})] &\textrm{Air Pollution} \end{array} \end{equation}
A.2. Additional figures and tables
Different welfare measures relative to the USA (2007)

Notes: The countries are ordered according to their GDP per capita relative to the USA Welfare JK is the welfare measure according to Jones and Klenow (Reference Jones and Klenow2016).
Decomposition of welfare measure with pollution (2007) (Second lines show the raw data of the subcomponents)

Notes: The countries are ordered according to their GDP per capita relative to the USA. C/Y: Consumption share in GDP; Ineq: Inequality; L: Leisure; LE: Life expectancy; Poll: Pollution.
Welfare growth 1991−2010

Notes: The countries are ordered according to their GDP per capita growth. Growth rates are computed based on the averages of the periods 1991−1995 and 2006−2010 (second lines). C/Y: Consumption share in GDP; Ineq: Inequality; L: Leisure; LE: Life expectancy; Poll: Pollution.
Different welfare measures relative to the USA (2007)

The countries are ordered according to their GDP per capita relative to the USA.
Welfare with and without pollution (2007).

GDP per capita and welfare with pollution (2007).

Welfare growth with and without pollution (1991−2010), all countries.

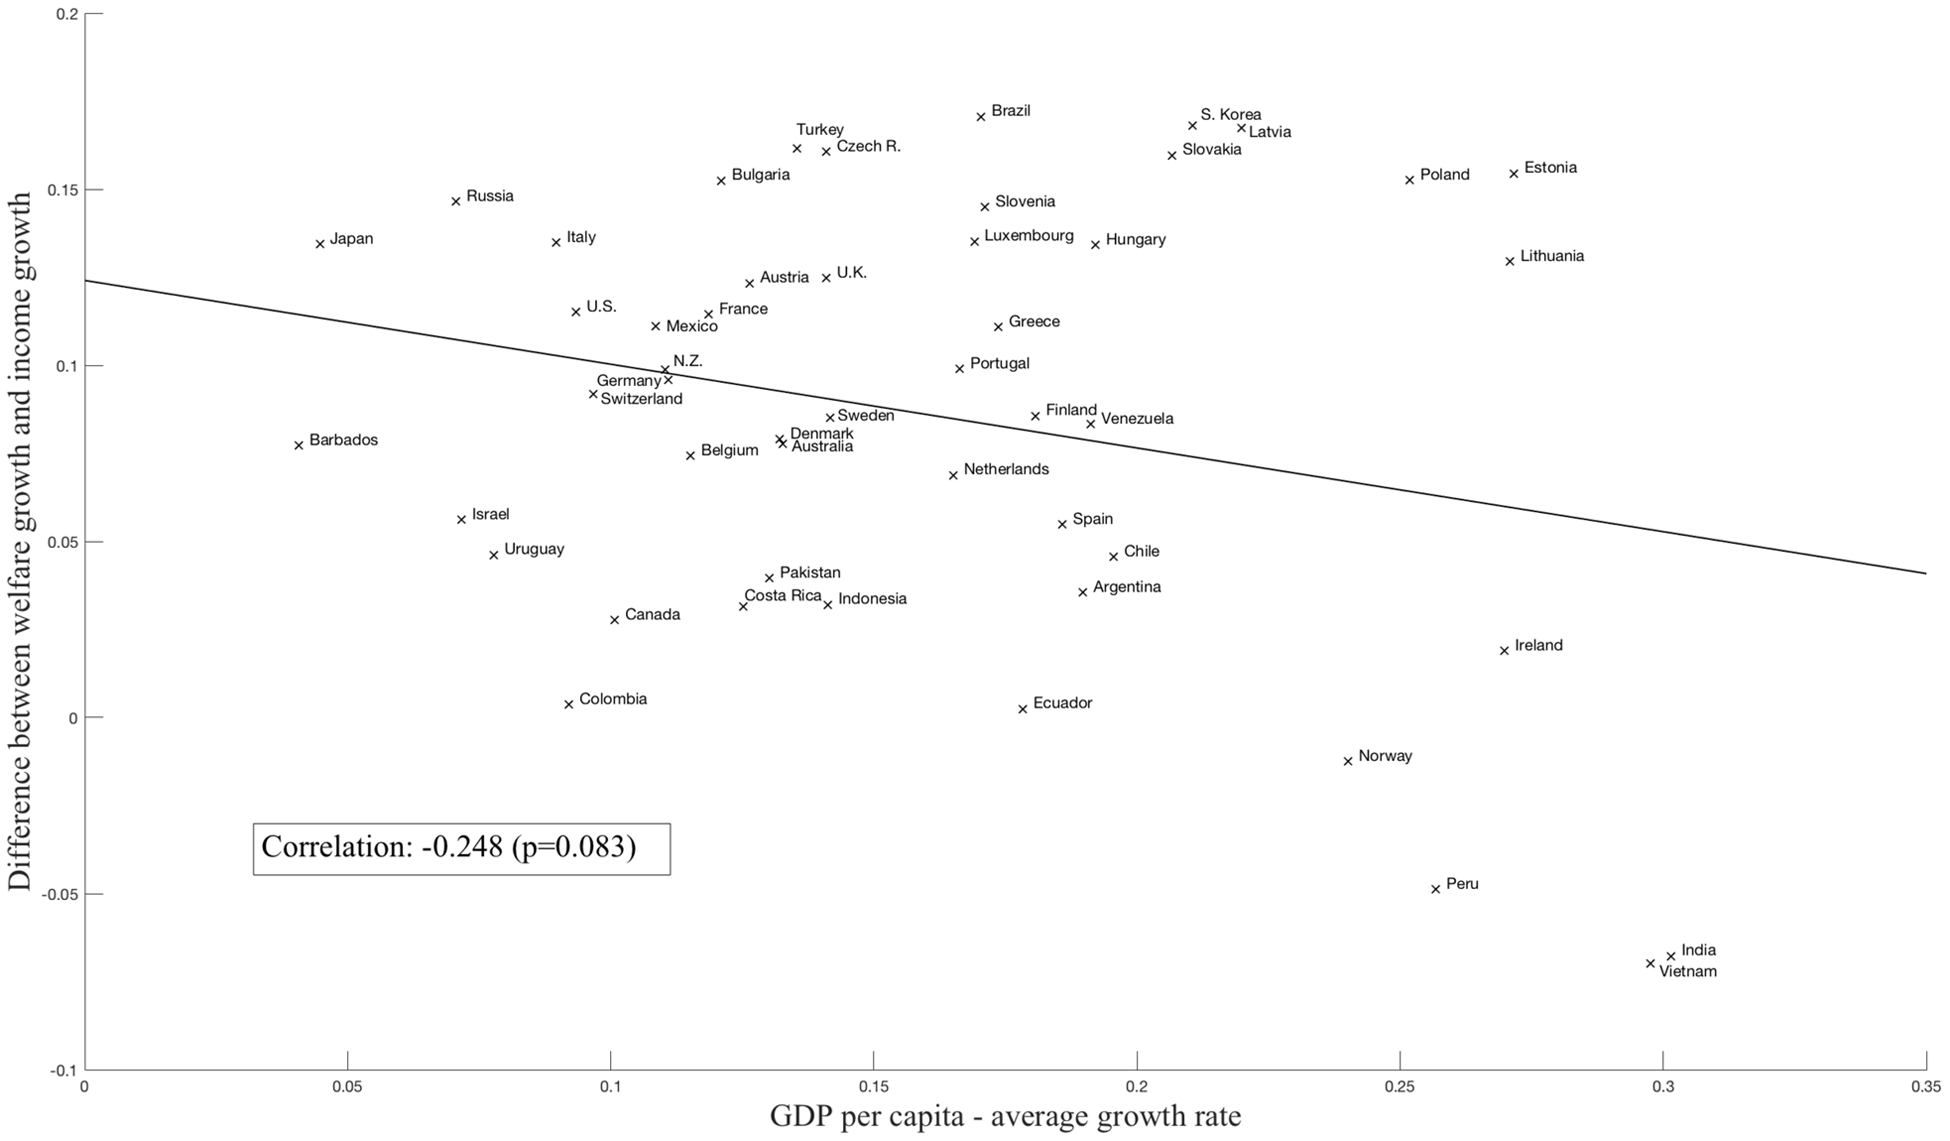
GDP per capita growth and deviation from welfare measure (1991−2010).

Welfare with separable vs. non-separable utility.

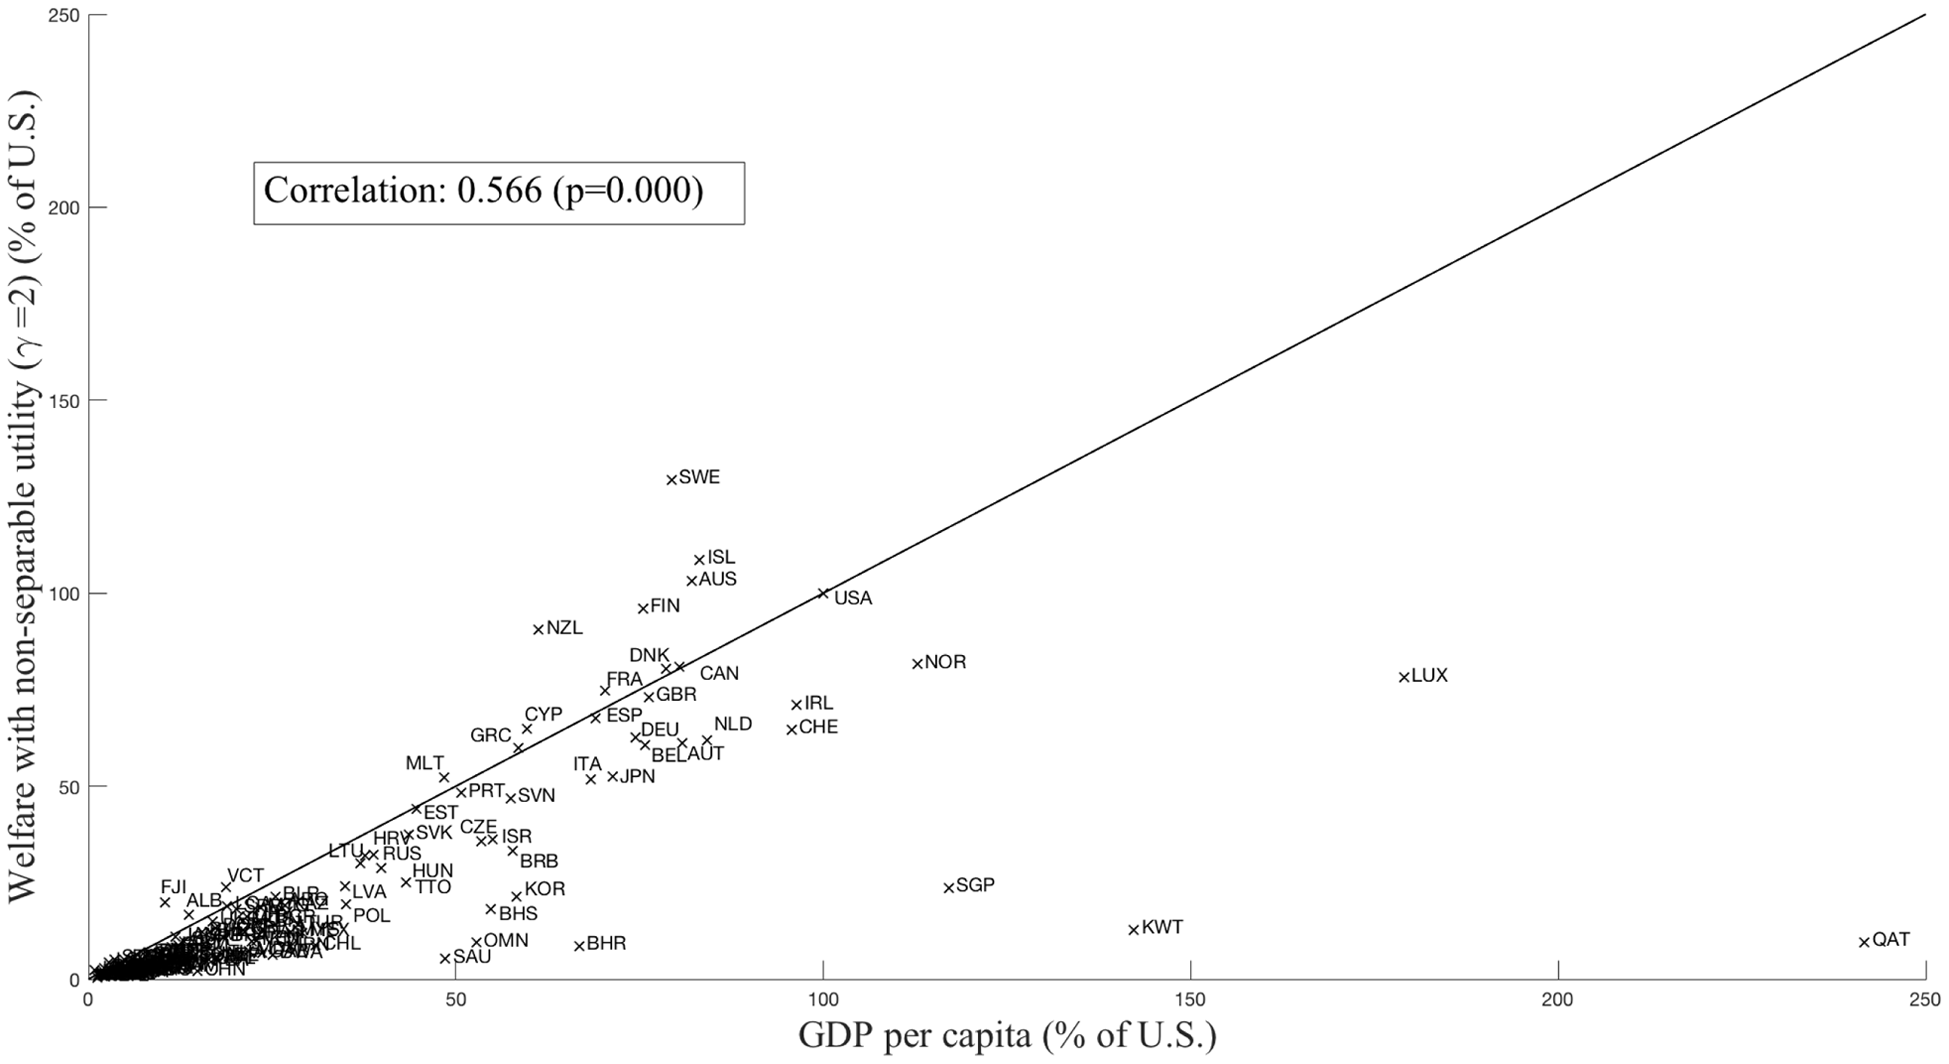
GDP per capita vs. welfare with non-separable utility.

Welfare growth separable vs. non-separable utility.

Welfare with and without pollution and
 $\bar{u}=5$
by country groups. Notes: Year 2007.