Introduction
The revolution in nanomaterials over the past two decades is expected to have an impact on all economic sectors, as materials science is fundamental to technology development in most application domains. Space exploration is no exception, with miniaturization of the payload, electronics, and other components being critical to reduce the cost of space missions. It costs nearly USD$25,000 to lift 1 kg to near-Earth orbit and about an order of magnitude more for distant planetary missions. The impetus to reduce the volume and mass of every conceivable item associated with a space mission is thus clear. The most recent robotic mission to Mars featured a small car-sized rover called Curiosity with a variety of instruments and cameras. It is natural to expect rovers with progressively smaller sizes—about the size of a golf cart next to a shopping cart and even smaller in the future—but without any loss of functionality. Thus, increased functionality per unit weight is the goal to reduce the cost of future exploration missions.
Compared to their bulk counterparts, nanomaterials offer unique and improved properties, and the anticipated benefits have been well-documented. Nanomaterials, nanosensors and instrumentation, microcraft, micro/nanorobotics, nano–micro–macro integration, nanomanufacturing, and astronaut health management are six areas recently identified to benefit from nanotechnology research.1 Since most of these areas are of interest to various other US agencies and have societal applications as well, there is significant literature in all of these fields without explicitly connecting to aerospace applications. The present article reviews nanoelectronics and nanosensors in the context of space exploration needs.
Nanoelectronics
All types of electronic components used in space missions, especially memory and logic devices, are typically a few generations behind the state of the art because of the need to assess their radiation tolerance and package the system appropriately prior to deployment in mission payloads. Three major categoriesReference Iniewski2 of radiation-induced damage to semiconductor devices have been identified in space: single-event effect (SEE), total ionizing dose (TID), and displacement damage (DD). An SEE due to a collision with a single energetic particle can take on many forms, such as single-event upsets (transient pulses or bitflips), which are soft errors and nondestructive and single-event latchups (damagingly high operating current). Both SEEs and TID result from ionizing radiation. Whereas an SEE can cause instantaneous failure, TID is a long-term effect that can lead to a shift in the threshold voltage of the device and increase the leakage current as well as cause failure of devices. DD is related to the displacement of atoms or the generation of defects in the lattice of an irradiated material by energetic particles. If the energy transferred to the atom is high enough, the atom can be knocked free from its lattice site to an interstitial site.
All conventional solid-state devices, regardless of the semiconductor employed, are susceptible to radiation effects to varying degrees. Whereas miniaturization of silicon complementary metal oxide semiconductor devices still continues according to Moore’s Law, forecasts of its demise have prompted research on carbon nanotube- and graphene-based transistors, single-electron devices, and many others. All of these technologies still reside within academic laboratories, and wafer-level fabrication with these newer materials is rare. The technical feasibility and economic viability of any of these alternative technologies are unclear at present.
Nevertheless, a few studiesReference Chavan and Reddy3–Reference Cress, Memarrow, Robinson, Friedman and Landi10 have focused on the effects of various types of radiation on the performance of carbon nanotube (CNT) field-effect transistors (CNTFETs). Analysis of CNTFET logic-gate designs showed a 45% improved resistance to single-event transients (SETs; SEE which propagates through the circuit) compared to silicon metal oxide semiconductor field-effect transistor- (MOSFET-) based designs.Reference Chavan and Reddy3 Proton radiation of CNTFETsReference Kemp4 increased the negative threshold voltage shifts in the current–voltage characteristics by 1.3–1.9 V between fluences of 1 × 10¹² protons/cm2 and 2 × 10¹³ protons/cm2. The drain current was shown to decrease by 33–58% within the same fluence range. The nominal fluence range in low Earth orbit is (0.64–6.4) × 1010 protons/cm2 for 1.8 MeV protons. Exposure of up to 2 Mrad of γ radiation at a rate of nearly 103 rad/s resulted in a reduction in the transconductance of CNTFETs due to mobility degradation as a function of TID.Reference Esqueda, Cress, Che, Cao and Zhou9 In contrast, another studyReference Vitusevich, Sydoruk, Petrychuk, Danilchenko, Klein, Offenhäusser, Ural and Bosman6 showed that the transconductance of CNTFETs and the level of noise did not change strongly after exposure to 1–2 Mrad of γ radiation at a rate of 102 rad/s. Exposure to 4.2 MeV α particles at a fluence of 3 × 1012 cm–2 reduced the conductivity of CNT papers, thin sheets of aggregated CNTs, by 25%.Reference Cress, Schauerman, Landi, Messenger, Raffaelle and Walters5
Memory devices that do not involve any charge transport are ideal for space applications as they are immune to radiation.Reference Bernacki, Hunt, Tyson, Hudgens, Pashmakov and Czubatyj11 An example is phase-change random-access memory (PCRAM), which relies on the thermally stimulated reversible phase change of chalcogenide materials, such as Ge2Sb2Te5, between stable amorphous and crystalline phases to represent 0 and 1, respectively.Reference Rauox12–Reference Chung, Deen, Lee and Meyyappan15 PCRAM features faster read/write performance, much improved endurance, and simpler fabrication than conventional transistor-based memories. Because data are stored in the form of the material phase, PCRAM is immune to soft errors and radiation.
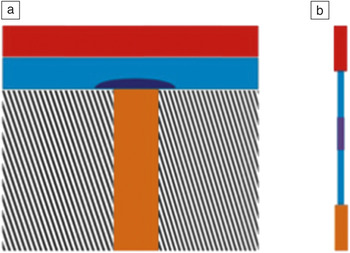
Although most advances in PCRAM have been made using thin films of appropriate materials, their nanowire counterparts have been shown to provide improved performance in terms of programming current and input power.Reference Chung, Deen, Lee and Meyyappan15–Reference Jin, Lim, Ju, Latypov, Kim, Meyyappan and Lee21 The ongoing issue with conventional thin film-based PCRAM is the high level of programming current needed to induce the thermal energy responsible for a phase change. In thin film-based devices, only a small mushroom-like volume of the phase-change material (see Figure 1) undergoes the reversible phase change. When the device is constructed using nanowires instead of a thin film, the programmable volume is smaller, thus resulting in a lower thermal budget. In addition, the thermal properties of the nanowires are more favorable than bulk properties, for example, lowering of the melting point. A lower melting point implies that the memory-reset action due to the crystalline-to-amorphous phase transition can be accomplished with a lower thermal energy. For example, controlled measurementsReference Sun, Yu, Ng and Meyyappan18 showed that a 40-nm GeTe nanowire melts at 390°C, compared to the 725°C bulk melting point, and a 70-nm In2Se3 nanowire melts at 680°C compared to the 890°C bulk melting point. These changes represent 25–40% reductions, but can be even larger for smaller nanowires because the melting point difference has an inverse dependence on nanowire radius. Therefore, the inherently smaller size and favorable thermal properties of phase-change nanowires lead to lower programming currents.
Phase-change random-access memory. (a) Conventional thin-film-based memory cell and (b) nanowire-based memory device. The top electrode is in red, and the bottom electrode is in orange. The light blue region represents the phase-change material, and the dark blue region denotes the portion undergoing the phase change. The bottom electrode in (a) is surrounded by oxide (striped).

Lee et al.Reference Lee, Ko, Jung and Agarwal16 systematically studied the dependence of memory-switching behavior on nanowire size and showed that the programming current for GeTe nanowire memory cells decreased to 0.42 mA for 28 nm wires from 4.0 mA for 200 nm diameter wires. A similar one-order-of-magnitude reduction in writing current was reported for nanowires of 30 nm and 200 nm diameters in the more popular Ge2Sb2Te5 system.Reference Lee, Jung, Chung, Jennings and Agarwal17 Phase-change memory using In2Se3 nanowires was fabricated and shown to switch at a much reduced input power compared to the corresponding thin film devices. For example, a 50 nm nanowire PCRAM switched at a reset power of 80 μW compared to a power of 20 mW for the thin film-based device.Reference Yu, Ju, Sun, Ng, Nguyen, Meyyappan and Janes19,Reference Yu, Sun, Ju, Janes and Meyyappan20 The corresponding programming currents were 11 μA and 4.0 mA, respectively. Gallium doping (∼2–10%) has been shownReference Jin, Lim, Ju, Latypov, Kim, Meyyappan and Lee21 to lead to phase-change behavior in indium oxide nanowires with excellent set/reset rates of 80 ns/20 ns, which are faster than the values reported for other nanowires. In2O3 is easier to prepare than tellurium-based compounds, which is another advantage. In general, achieving progress in nanowire-based PCRAM would require tight control of the nanowire diameter, and thus, the bandgap and other properties, to minimize device-to-device variations. Also, all reported efforts to date are based on “pick-and-place” strategies for handling nanowires in device fabrication, and wafer-level fabrication strategies need to be developed to enable technology implementation.
Vacuum electronics also has potential for space applications because transport in a vacuum is immune to radiation, unlike that in semiconductors. The shortcomings of vacuum devices include high operating voltages, fragility, and large sizes relative to solid-state devices, and as a result, they have disappeared except for niche applications, for example, in satellites. Research on vacuum electronics has largely focused on microfabrication efforts,Reference Park, Park, Hahm, Lee, Choi and Lee22 although nanoscale fabrication has been attempted recently.Reference Pescini, Tilke, Blick, Lorenz, Kotthaus, Eberhardt and Kern23–Reference Han, Oh and Meyyappan25
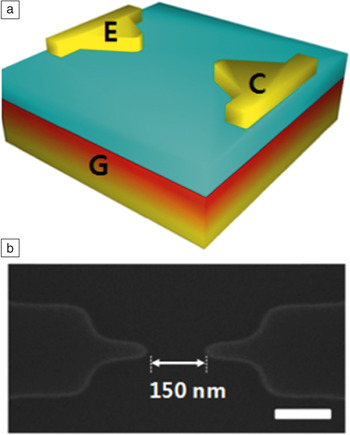
In addition to radiation immunity, the absence of scattering makes vacuum transport faster than that in semiconductors. Efforts to combine the best of vacuum transport and silicon technology have yielded nanoscale vacuum devices with electrode gaps of 50–150 nm.Reference Han, Oh and Meyyappan24,Reference Han, Oh and Meyyappan25 Figure 2 shows a schematic of a nanoscale vacuum device with sharp silicon electrodes (denoted as emitter [E] and collector [C]) with a gate (G) located at the bottom of the bulk silicon wafer. The electrode gap is created by plasma ashing (removing the photoresist from an etched wafer), resulting in heavily doped silicon electrodes with a 5–10 nm radius of curvature. The drive voltage has been reduced to values below 10 V for back-gated devices such as the one shown in Figure 2, with an on/off current ratio of 106 and cutoff frequency of 450 GHz.Reference Han, Oh and Meyyappan24 The nanoscale vacuum transistor was also co-fabricated with a conventional MOSFET on the same chip, demonstrating the monolithic integration potential of this technology.Reference Han, Oh and Meyyappan25
(a) Silicon-based nanoscale vacuum transistor with a bottom gate. (b) The highly doped source and drain electrodes (E and C) with a specified gap are created by plasma ashing, as shown in the scanning electron microscope image.

Biosensors
Biosensors in space exploration can be envisioned first in the form of a lab-on-a-chip for routine crew health monitoring. The analyses of interest would include complete blood count, white blood cell count, basic metabolic panel (Na+, K+, Cl–, Ca2+, total CO2, creatinine, glucose), paO2, paCO2, HCO3–, pH, troponin I, creatine kinase-myocardial band (CK-MB), bilirubin, and urinalysis (pH, leukocytes, nitrites, proteins, glucose, ketones, urobilirubin, blood, urate). Other applications include monitoring the water and food quality in the crew habitats and looking for signs of life on other planets. An ideal biosensor system should be small in size and require minimal resources, including labor and reagents, with a long shelf-life for probes. The analysis should be reasonably rapid with negligible false alarms. Multiplexing capability to detect multiple targets simultaneously is also desirable. As biosensors have numerous societal applications, there is a vast literature on the use of carbon nanotubes, graphene, and various inorganic nanowires in sensor development. The signal transduction approachesReference Daniels and Pourmand26,Reference Gooding27 include Amperometric (quantitative analysis based on electric current), impedimetric (quantitative analysis based on resistance measurements), other electrochemical and also optical techniques; biosensing field-effect transistor (BioFETs) wherein the threshold voltage systematically shifts upon probe attachment to the gate surface and later upon probe–target hybridization.
Nanomaterials such as CNTs, graphene, and silicon nanowires have been used to construct BioFETs.Reference Star, Gabriel, Bradley and Gruner28–Reference Kim, Rim, Park, Kim, Meyyappan and Lee34 Transistors using semiconducting single-walled carbon nanotubes (SWCNTs) with immobilized glucose oxidase as conducting channels were shown to provide an electronic response to glucose.Reference Allen, Kichambare and Star29 Graphene FETs with single or multilayer graphene can be used to detect adsorbed proteins in liquid. Aptamer-based immunosensing (single-stranded DNA or RNA) using graphene FETs has been shownReference Ohno, Maehashi and Matsumoto30 to be sensitive with suppression of nonspecific binding of nontarget proteins.
Huang et al.Reference Huang, Dong, Liu, Li and Chen32 constructed graphene FETs using large-sized graphene films grown by chemical vapor deposition and functionalized with anti-E. coli O and K antibodies. Exposure to E. coli K12 ER2925 resulted in a significant increase in FET conductance for concentrations down to 10 colony-forming units per milliliter (cfu/mL). Li et al.Reference Li, Lei, Zhang, Liu, Hang, Tang, Rouhanizadeh, Hsiai and Zhou31 constructed FETs using In2O3 nanowire channels and showed that the gate threshold voltage exhibited a consistent negative shift upon exposure to low-density lipoprotein (or “bad”) cholesterol. The amino groups in the proteins donate electrons to the nanowires and also carry positive charges, which function as a positive gate bias for the nanowires; both factors contribute to an enhancement of the electron concentration and a change in the threshold voltage.Reference Li, Lei, Zhang, Liu, Hang, Tang, Rouhanizadeh, Hsiai and Zhou31 In the case of nanowires, bottom-up processes to synthesize nanowires are currently not amenable to wafer-scale fabrication of devices, and therefore, top-down approaches using lithography have been used to create nanowires of desired length and diameter.Reference Rim, Kim, Baek, Jeong, Lee and Meyyappan33,Reference Kim, Rim, Park, Kim, Meyyappan and Lee34
Nanomaterials are also suitable for constructing nanoelectrodes for biosensors utilizing electrochemical methods.Reference Lin, Lu and Ren35–Reference Pal, Alocilja and Downes42 In fact, this is a more common and somewhat easier approach compared to the fabrication of FETs. Lin et al.Reference Lin, Lu and Ren35 used an aligned CNT array as a nanoelectrode to detect glucose in the presence of interfering chemicals such as acetaminophen, uric acid, and ascorbic acid. The amperometric response did not have any overlapping signals from the interfering chemicals, and the detection limit for glucose was shown to be 0.08 mM. The biocatalytic reduction of O2 can be used as the basis for glucose detection. Wu et al.Reference Wu, Shao, Hu, Jin, Yin, Zhang and Cai39 developed a biosensor using graphene sheets integrated with glucose oxidase serving as the electrocatalyst and demonstrated a detection limit of 10 μM. Chen et al.Reference Chen, Yao, Tzang, Zhu, Yang and Lee40 immobilized glucose oxidase on COOH-functionalized silicon nanowires, and their amperometric results showed a linear response to glucose in the range of 0.1–15 mM with a detection limit of 0.01 mM.
The background noise in the voltammetry techniques often used in sensing is proportional to the electrode area; the size difference between a low concentration of target molecules and the micro- or macroelectrodes is so large that noise becomes an issue. In contrast, if the same overall surface area is divided into numerous smaller nanoelectrodes (around 50 nm in diameter), the size difference becomes small enough to significantly reduce the background noise and allow detection of the weak signal from the low concentration of target molecules. Nanowires of silicon or zinc oxide can be grown vertically on a patterned substrate to create a nanoelectrode array (NEA). Alternatively, plasma-enhanced chemical vapor deposition (PECVD) enables the growth of individual, freestanding, vertically aligned carbon nanofibers (CNFs) to construct NEAs.Reference Koehne, Chen, Li, Cassell, Ye, Ng, Han and Meyyappan43–Reference Gupta, Periyakaruppan, Koehne and Meyyappan47 The CNFs are multiwalled CNTs with a core resembling bamboo with periodic closures, ideal for developing an NEA. The fabrication process for the CNF NEAs is described briefly below.
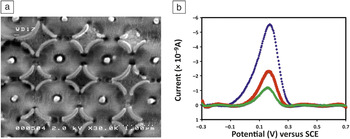
A 6 in. (15 cm) silicon wafer substrate is sputtered with a thin layer of titanium or chromium prior to nickel catalyst deposition. A thin nickel film (2–20 nm) typically yields a forest of CNFs with a random distribution of fiber diameters and heights. Individual nanoelectrodes need to be spaced by a certain distance to avoid overlap of the radial diffusion layers of neighboring electrodes; otherwise, the electrode will behave like a micro- or macroelectrode. For a 50-nm CNF diameter, it is ideal to have a distance of ∼1.2 μm between neighboring electrodes, which can be achieved by patterning the nickel catalyst dots. PECVD using a mixture of methane and ammonia grows vertical CNFs on the catalyst dots whose height is controlled to about 3–4 μm. SiO2 is deposited in the space between the individual CNFs using thermal CVD and tetraethoxysilane. This is followed by chemical-mechanical polishing to provide a smooth top surface of the electrode, with CNF tips poking out of the oxide layer (Figure 3a). These tips can be functionalized with DNA, antibody, aptamer, or other probes using appropriate protocols for various targets of interest. Figure 3b shows differential pulse voltammetry results for the detection of myoglobin, a cardiac biomarker; a systematic shift in current from the bare electrode is seen, first when the antibody is attached to the tips of the CNF electrodes and then after the target myoglobin is introduced onto the sensor surface.Reference Gupta, Periyakaruppan, Koehne and Meyyappan47
(a) Nanoelectrode array using vertical carbon nanofibers. The exposed tips of the carbon nanofibers are seen as white dots. (b) Differential pulse voltammetry results for the detection of target myoglobin. Blue, bare electrode; red, after antibody immobilization; green, after introduction of myoglobin target protein. Note: SCE, saturated calomel electrode.

Chemical sensors
Sensors to detect and/or monitor concentrations of gases and vapors are needed for monitoring of crew-cabin air qualityReference Ryan, Zhou, Buehler, Manatt, Mowrey, Jackson, Kisor, Shevade and Homer48 (CO, formaldehyde), detection of fuel and oxidant leaks prior to and during launch, mapping of planetary atmosphere, pollutant determination in Earth observation, etc. An ideal sensor or measurement system for sensing gas/vapors should meet the following requirements: high selectivity; sensitivity as required by the application; small size and mass; low power consumption; technology suitable for different terrains and environments encountered in the chosen application; rugged and reliable, as conditions vary severely in terms of humidity, temperature, pressure, corrosive environment, dust, and so on; and amenability for networking.
Sensors currently available in the market fall into two categories. The first is a tin oxide thin film-based sensor with a long history; the greatest constraint on this approach, aside from its high power needs, is that it works only at elevated temperatures (>200°C). Deposition of ceramic oxides also requires high temperatures, which precludes the use of inexpensive flexible substrates from both processing and operational aspects. The second type of sensor uses a polymer that swells upon adsorption of gases and vapors. This sensor is not very sensitive and is limited in its range of analytes.
To surpass these commercial products, numerous micro- and nanosensor concepts have appeared in the literature. Nanosensors, in particular, appear promising in terms of sensitivity, small size, low power consumption, and other metrics. Nanomaterials such as CNTs and nanoparticles exhibit very high surface areas. For example, single-walled carbon nanotubes (SWCNTs) have been shownReference Cinke, Li, Chen, Cassell, Delzeit, Han and Meyyappan49 to have surface areas of ∼1600 m2/g. Such high surface areas enable high adsorption rates for gases and vapors. When the adsorbed vapor or gas changes the properties of the nanomaterial (e.g., conductance, capacitance, or dielectric constant), then measuring and monitoring one of these properties forms the basis for sensing. Because of the significant potential for chemical sensors in industrial, security, environmental monitoring, biomedical, and other applications, there have been numerous reportsReference Kauffman and Star50–Reference Meyyappan and Sunkara63 on the use of CNTs, graphene, and metal oxide nanowires in sensor construction, and some of the reported detection techniques for gases and vapors might be of interest in aerospace applications.
Star et al.Reference Star, Joshi, Skarupo, Thomas and Gabriel51 constructed a gas sensor array using SWCNTs decorated with palladium, platinum, and gold to increase the sensitivity and selectivity. The FET-like sensors were exposed to NH3, NO2, H2, H2S, and CO, and the sensor data was analyzed using partial least-squares regression for gas identification. Bekyarova et al.Reference Bekyarova, Davis, Burch, Itkis, Zhao, Sunshine and Haddon52 made a simple interdigitated electrode to host SWCNTs with covalently attached poly(m-aminobenzene sulfonic acid) and demonstrated 5 ppm-level detection of NH3. The functionalized nanotubes showed responses twice as large as those of unmodified SWCNTs; more importantly, the recovery time was shown to decrease significantly for the former. Formaldehyde (HCHO) is a pollutant, and its spacecraft maximum allowable concentration for 1 h is 0.4 ppm.Reference Ryan, Zhou, Buehler, Manatt, Mowrey, Jackson, Kisor, Shevade and Homer48 SWCNTs and other nanomaterials might not respond significantly with any property change upon exposure to formaldehyde. Density functional theory calculationsReference Wang, Zhang, Zhang and Liu53 have shown boron doping of SWCNTs to be an effective approach for HCHO detection. Loading with rhodium or functionalizing with polyethylenimine allowed SWCNTs to respond to even 10 ppb of formaldehyde.Reference Lu, Meyyappan and Li57
Ueda et al.Reference Ueda, Bhuiyan, Norimatsu, Katsuki, Ikegami and Mitsugi54 demonstrated the detection of other pollutants such as NOx in the range of 2–50 ppm with the aid of SWCNTs, as well as faster sensor recovery when the nanotubes were exposed to UV light. Penza et al.Reference Penza, Rossi, Alvisi and Serra56 analyzed a simulated landfill gas consisting of a mixture of CO2, CH4, H2, NH3, CO, and NO2, all of which are also of importance in space applications. They modified SWCNTs with metals such as platinum, ruthenium, and silver and analyzed the data from a sensor array using principal component analysis to obtain selective identification of the mixture components. Graphene has also been successfully used in chemical sensors for the identification of similar gases and vapors.Reference Fowler, Allen, Tung, Yang, Kaner and Weiller58–Reference Lu, Ocala and Chen62 Whereas graphene and CNTs allow room-temperature operation of chemiresistors, FETs, or other sensor variations, metal oxide materials, even in the form of nanowires, mostly require operation at elevated temperatures (∼200°C) to obtain comparable sensitivities and response times.Reference Meyyappan and Sunkara63
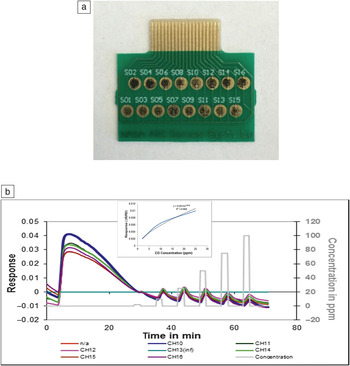
Our group has been developing SWCNT-based chemical sensors for nearly a decade.Reference Li, Lu, Ye, Delzeit and Meyyappan64–Reference Hannon, Lu, Li and Meyyappan69Figure 4a shows a 16-sensor chip fabricated on a printed circuit board. The sensors have interdigitated electrodes, each with a gap size of 120 µm. The sensing materials (0.3 µl of solution) are deposited on the interdigitated electrode area currently with the aid of a pipette on the chip; future work will consider inkjet-printing-type technology to automate this process. In addition to purified SWCNTs, variations in sensor material may include doping, metal loading, coating or functionalization of the nanotubes and the use of metal oxide nanowires or nanoparticles, to elicit a signal from the analyte of interest, as pure SWCNTs might not respond to every gas or vapor. The resistance of each sensor in the array is measured before and after exposure to the environment under monitoring. The sensor chip is trained in the laboratory for detection of each analyte of interest. Because an array of sensor elements with material variation is employed, a pattern of resistance changes (normalized to the baseline resistance) emerges when the chip is exposed to an analyte of a given concentration in air. This training exercise is repeated for various analyte concentrations and also for different temperatures and relative humidity levels. The entire data set is stored and used later in interrogation mode using a pattern recognition algorithm. Thus, the nanochemical sensor operates as an electronic nose. Figure 4b shows the sensor response upon exposure to CO under 65% relative humidity.Reference Hannon, Lu, Li and Meyyappan69 After the chip had been purged in dry air for 5 min, 65% humidity was introduced for 25 min. The sensor resistance increased significantly in the presence of humidity, but returned to the baseline after about 20 min. Then, successive introductions of CO from 2 ppm to 100 ppm brought about clear and proportional changes in resistance for seven of the sensors whose data are shown here.
(a) Image of a gas sensor array (1.7 cm × 2.0 cm) fabricated on a printed circuit board. S01–S16 indicates the individual sensors. (b) Responses of various sensors in the array to successive exposures to 2, 10, 25, 50, 75, and 100 ppm of CO. The inset shows the response versus concentration calibration curve. Images courtesy of Yijiang Lu and Ami Hannon, NASA Ames Research Center, Mountain View, Calif.

Future perspectives
Nanomaterials show significant potential for developing radiation-immune electronics and high-performance sensors with small footprints and low power consumption for space applications. Most developments to date have reached a technology readiness level of perhaps 3 on a 1–9 scale, where levels of 8 and 9 represent fully deployable systems. In addition to the PCRAM discussed here, resistive random-access memory and CNT-based mechanical crossbar arrays are other radiation-immune memory technologies.
In the case of chemical sensors, fully functional electronic noses using nanomaterials are likely to become available in the near future. They are needed for the selective identification of an analyte of interest from a complex background. System development in biosensors is somewhat more complicated because of the need to integrate microfluidics to deliver a drop of blood, urine, or water to the sensor element. Demonstration using human samples, multiplexing of sensor chips for multiple targets, elimination of cross-reactivity, and reduction of sample processing time are some of the issues yet to be addressed in the case of nanomaterial-based lab-on-a-chip. Other sensor needs in space missions include chip-based radiation detectors and physical sensors to detect cracks and failures in structures. These activities can also benefit from nanomaterials, and because of many terrestrial applications, a significant amount of research is in progress in these areas.
Acknowledgments
The authors acknowledge their current colleagues at the Center for Nanotechnology Jing Li, Yijiang Lu, Ami Hannon, Beomseok Kim, Ramprasad Ghandhiraman, and Michael Oye, and past colleagues Rakesh Kumar, Adaikappan Periyakaruppan, Jun Li, Vivek Jain, Bin Yu, and Xuhui Sun for their contributions to the technologies discussed here.