


Introduction
In times of high demand and limited resources, there is a need for more efficient allocation of existing resources in healthcare (Reference Goeree, He and O’Reilly1). The importance of health technology assessment (HTA) has risen since it provides a systematic approach to determining health conditions and interventions (Reference Mitton, Seixas, Peacock, Burgess and Bryan2) and thereby may aid decision makers in efficient resource allocation (Reference Drost, van der Putten, Ruwaard, Evers and Paulus3). This is preferably performed utilizing a societal perspective, which entails considering all costs regardless of who incurred them (Reference Kim, Silver and Kunst4;Reference Avşar, Yang and Lorgelly5). An example of a methodology applied in HTA is the cost-of-illness study (Reference Wiethoff, Evers, Michels and Hiligsmann6), which aims to determine the economic burden associated with the disease or condition (Reference Larg and Moss7) and provides essential information that helps prioritize healthcare policies and interventions as well as aids in allocation of resources (Reference Jo8).
Being able to utilize economic evidence such as that from cost-of-illness studies in multiple contexts and healthcare settings further aids efficiency. However, there is great variation in the methodology and pricing structures described in country-specific EE guidelines. (Reference Goeree, Burke and O’Reilly9;Reference Mayer, Fischer, Zechmeister-Koss, Ostermann and Simon10). More specifically, there is a lack of uniformity in reference prices, which are standardized average cost prices of cost units (Reference Hakkaart - van Roijen, Peeters and Kanters11). This presents a challenge when comparing the economic burden between countries, making transferability more difficult. Additionally, updates of country-specific EE guidelines can further hamper the generalizability of study findings within countries over time. A prior study evaluated the impact of reference costs on valuation methods for unit cost calculation of general practitioner consultations (Reference Mayer, Fischer, Zechmeister-Koss, Ostermann and Simon10). Mayer et al. concluded that the different approaches used to determine costs resulted in cross-study and cross-country cost variation that in turn reduced the reliability of EE data (Reference Mayer, Fischer, Zechmeister-Koss, Ostermann and Simon10). Similarly, Essers et al. investigated the transferability of model-based EEs and found that overall structures of EEs may be transferable, although adaptations in the model inputs may be necessary (Reference Essers, Seferina and Tjan-Heijnen12).
However, the impact of guideline reference price updates on cost analyses in health EEs has not been empirically quantified. To illustrate this gap, the economic burden associated with adolescent idiopathic scoliosis (AIS) was selected as an example. AIS refers to a complex spinal deformity that negatively impacts quality of life, results in productivity losses, and leads to recurring healthcare utilization, making it a relevant example for evaluating reference price influences on cost analyses. Assessing this empirical impact provides insight into how much reference prices depend on methodological choices and the reference year, as well as the limitations for comparability in findings over time and across multiple healthcare contexts. Furthermore, this can lead to collaborative optimization in the standardization of reference price derivation and prioritization of decisions on the management of diseases or conditions. Therefore, this study empirically illustrates how changes in reference prices affect cost analysis in EEs over time and across countries, using the economic burden associated with adolescent idiopathic scoliosis (AIS) in the Netherlands and the United Kingdom.
Methods
To empirically illustrate the impact of reference prices over time within and across countries, a cross-sectional study on the economic burden of AIS was used as an example. A quantitative research design was adopted, and the economic burden of AIS was considered from a societal perspective. The population prevalence of AIS is similar in both countries (2–3 percent) (Reference Negrini, Donzelli and Aulisa13).
Context
The Netherlands and UK guidelines were selected as examples in this study since both countries have extensive expertise within HTA research and comprehensive national health EE guidelines. Additionally, recent updates of both guidelines make them relevant for demonstrating the impact of differences in reference prices over time. The Netherlands utilizes a costing manual incorporated within the Dutch health EE guideline for conducting EEs in healthcare (Reference Hakkaart - van Roijen, Peeters and Kanters11). In the United Kingdom, the Personal Social Services Research Unit (PSSRU) developed a unit cost program providing annual cost estimates for health and social care services (Reference Jones, Weatherly and Birch14;Reference Jones, Weatherly and Birch15). Reference prices as reported in economic evaluation guidelines from the Netherlands (versions: 2014 (Reference Hakkaart-van Roijen, Van der Linden, Bouwmans, Kanters and Tan16) and 2024 (Reference Hakkaart - van Roijen, Peeters and Kanters11)) and the United Kingdom (versions: 2021–2022 (Reference Jones, Weatherly and Birch14) and 2022–2023 (Reference Jones, Weatherly and Birch15)) were considered.
Economic burden of AIS
In 2022, a national, cross-sectional economic burden of AIS study was conducted using a bottom-up approach and societal perspective (Reference Hoelen, Evers, Arts, Willems and van Mastrigt17;Reference Hoelen, Willems, Arts, van Mastrigt and Evers18). The study was performed according to the Dutch guideline for EE (version: 2014) (Reference Hakkaart-van Roijen, Van der Linden, Bouwmans, Kanters and Tan16). Costs were assessed using the Institute for Medical Technology Assessment – Medical Consumption (Reference Bouwmans, Hakkaart-van Roijen and Koopmanschap19) (iMTA-MCQ) and Productivity Cost (Reference Bouwmans, Krol and Severens20) (iMTA-PCQ) questionnaires. All costs were indexed for the year 2022 and presented in euros. In total, 229 participants with AIS completed the survey. The study used previously collected and anonymized data on resource usage during a period of 3 months as the basis for the current study on the impact of reference prices.
Data collection
The unit cost estimations were determined using a three-step approach: (i) identification, (ii) measurement, and (iii) valuation.
Identification
The cost items identified in the previously published societal burden of AIS study in 2022 (Reference Hoelen, Evers, Arts, Willems and van Mastrigt17) were considered in the current study. The identification of cost items was based on a societal perspective and included healthcare sector costs (e.g., visits to the general practitioner or medical specialist), patient and family costs (e.g., transport costs to the hospital), other sector costs (e.g., school days), and productivity losses consisting of costs associated with absenteeism, presenteeism, and unpaid voluntary work (Reference Drummond, Sculpher, Claxton, Stoddart and Torrance21).
Measurement
Resource usage was fixed regardless of the guideline used for the analysis and was also based on resource usage (volumetric data) from the societal burden of AIS study previously conducted (Reference Hoelen, Evers, Arts, Willems and van Mastrigt17). The resource usage corresponded to a period of 3 months (quarterly).
Valuation
The valuation of costs was dependent on the country and guideline used. The unit costs per item were based on the calculation of multiplying the resource usage by the reference price. All reference prices for unit costs were indexed for the year 2022 and presented in euros. Adjustments for price conversion were considered based on the OANDA Currency Converter adjusted to May 2022 (OANDA, 2024). Furthermore, adjustments for Purchasing Power Parities (PPPs) were considered based on national PPPs provided by the OECD (22). PPPs are currency conversion rates based on gross domestic product that balance the purchasing power of different currencies by removing price level discrepancies between countries (22). The validity of PPP is influenced by factors such as the exchange rate and economic structures of countries and global openness (Reference Nagayasu23). In line with the Dutch costing guidelines, PPP conversion took place after indexation (Reference Hakkaart - van Roijen, Peeters and Kanters11).
In accordance with the Dutch guideline, the cost of informal care was estimated using the replacement cost method (Reference Hakkaart-van Roijen, Van der Linden, Bouwmans, Kanters and Tan16). According to the Dutch costing guideline, the preferred Friction Cost Method (FCM) was used to calculate productivity losses by multiplying total absenteeism time by the regular employee cost. The FCM assumes replacement after a friction period (± 19 weeks) (Reference Hakkaart - van Roijen, Peeters and Kanters11). The cost of the medication was valued using the lowest cost price available in the data (24).
The cost estimation of the UK unit prices was carried out in accordance with the PSSRU unit cost program in 2022 (Reference Jones, Weatherly and Birch14) and was compared with the new guideline in 2023 (Reference Jones, Weatherly and Birch15). In addition, the National Health Service (NHS) reference cost schedule was used, which contains various service codes and specific cost information (25). Unit costs for each item that were most comparable to those in the Dutch guideline were selected. The estimated average friction period between 2010 and 2021 was 72.7 days (~10 weeks) for the United Kingdom (Reference Hanly, Ortega and Pearce26). The national CPI was used (2.72 percent) (27), prices were converted by the currency rate of ~1.18 (28), and adjustments for PPPs were calculated using the factor 0.65 (22). In case no UK reference price could be found, the Dutch unit price was used as a proxy and subsequently converted into UK-equivalent values using currency conversion rates and PPP adjustments.
Reference price comparison
The difference in total societal costs per individual with AIS for a period of 3 months between guidelines and countries was considered. Subsequently, the cost share attributions for the various sectors, for example, healthcare, patient and family, other sector costs, and productivity, were compared. Finally, the unit costs per item were compared between the Netherlands and the United Kingdom, in order to determine the transferability of cost analyses. In addition, to investigate generalizability, the same calculations were performed for both guidelines per country. Differences were calculated using the formula:
$ \frac{New\; guideline- Old\; guideline}{Old\; guideline}\ast 100\% $
 .
Data analysis
The nonparametric bootstrapping method (1,000 replications) was performed for the cost calculations for each cost category (Reference Hoelen, Evers, Arts, Willems and van Mastrigt17;Reference van den Boom, van den Hurk, Kalmet, Poeze and Evers29). The continuous data were presented as mean and the categorical data as count. The significance level was set at p-value ≤0.05, and the data processing, calculations, and statistical analysis were conducted using R-software version 4.1.0 (package: summarytools, forcats, dplyr, tableone).
Ethics
Non-WMO approval was obtained for the original study from the Medical Ethical Testing Committee (METC) of the University Maastricht/academic hospital Maastricht (UM/MUMC+), as well as consent from the advisory board of the MUMC+ (METC 2022-3166). Informed consent was obtained from all participants before the start of the original study.
Results
Societal costs
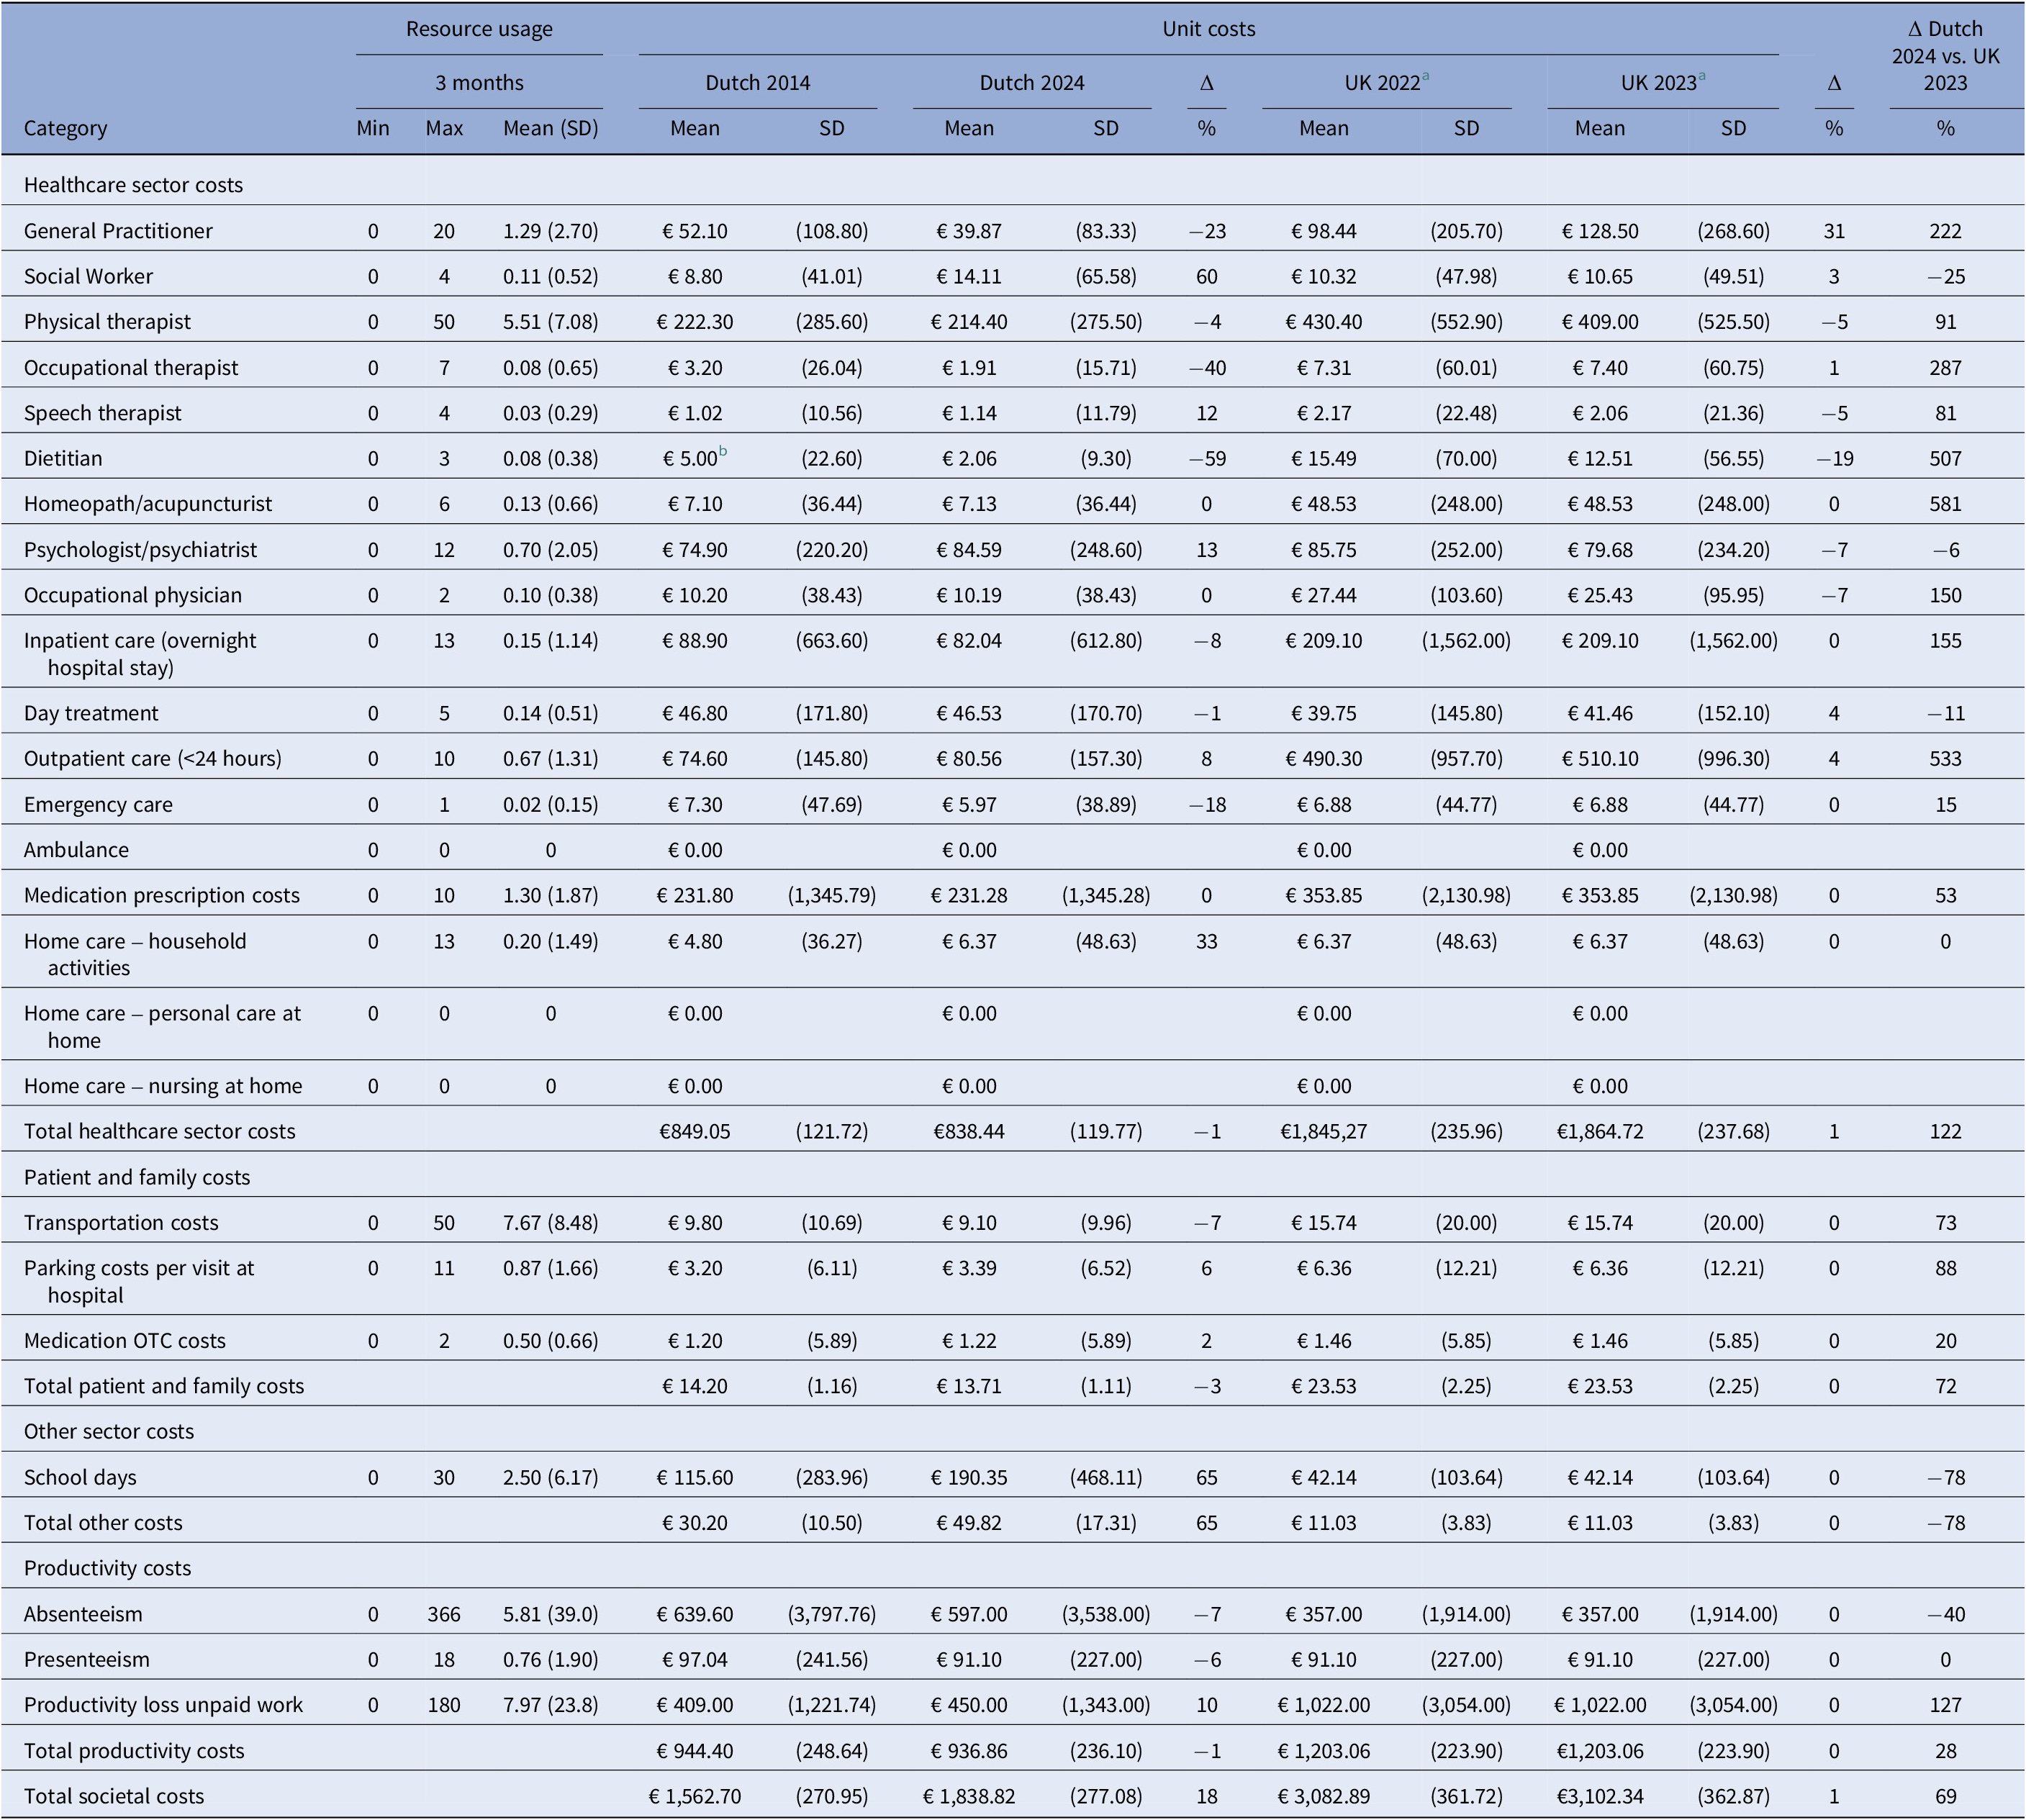
To illustrate the practical implications of reference price differences, the total bootstrapped societal costs and individual sector costs associated with AIS over a 3-month period were calculated per country-specific guideline (Table 1). Differences between countries of more than 10 percent are presented in blue in Table 1. When using the Dutch 2014 guideline, the total bootstrapped societal costs per patient with AIS amounted to €1,562.70 (SD €270.95) per quarter, indexed for 2022. Updating the Dutch guideline (2014–2024), increased the bootstrapped quarterly societal costs by ~18 percent to €1,838.82 (SD €277.08), whereas updating the UK guidelines (2021/2022–2022/2023), increased costs by <1 percent from €3,082.89 (SD €361.72) to €3,102.34 (SD €362.87). Based on the most recent guidelines (NL: 2024 vs UK: 2022/2023), UK total societal cost estimates were ~69 percent higher than those for the Netherlands.
Quarterly societal costs per individual with adolescent idiopathic scoliosis indexed for 2022

Table 1. Long description
The table is structured into four main cost categories: Healthcare sector costs, Patient and family costs, Other sector costs, and Productivity costs.
Columns are organized into three primary sections:
1. Resource usage over 3 months: Includes Min, Max, and Mean with S D in parentheses.
2. Unit costs for Dutch 2014 and Dutch 2024: Includes Mean, S D, and the percentage change Delta.
3. Unit costs for U K 2022 and U K 2023: Includes Mean, S D, and the percentage change Delta.
4. A final column shows the percentage difference between Dutch 2024 and U K 2023.
Key data points include:
* Healthcare sector costs: General Practitioner mean resource use is 1.29. Total healthcare sector costs for Dutch 2024 are 838.44 Euro compared to 1,864.72 Euro for U K 2023, a 122 percent difference.
* Patient and family costs: Includes transportation, parking, and O T C medication. Total costs are 13.71 Euro for Dutch 2024 and 23.53 Euro for U K 2023.
* Other sector costs: Primarily school days, which show a 65 percent increase in Dutch costs from 2014 to 2024.
* Productivity costs: Includes absenteeism, presenteeism, and unpaid work. Total productivity costs for Dutch 2024 are 936.86 Euro versus 1,203.06 Euro for U K 2023.
* Total societal costs: The final row shows a total of 1,838.82 Euro for Dutch 2024 and 3,102.34 Euro for U K 2023, representing a 69 percent higher cost in the U K dataset.
SD, standard deviation; OTC, over the counter drug.
a Currency rate of 1.17776 (15 May 2022), PPP calculated using the factor 0.651.
b Unit cost not reported in guideline (estimate used).
Cost share attribution
In both Dutch guidelines, productivity losses accounted for the largest share of total costs at 54 percent (guideline 2014) and 52 percent (guideline 2024), followed by healthcare sector costs at 40 percent (guideline 2014) and 38 percent (guideline 2024) (Supplementary Material, Table S1). The productivity losses and healthcare sector costs decreased slightly when adopting the updated guideline (2024). This was compensated by the 4 percent increase in other sector costs.
For the United Kingdom, this was reversed, with the healthcare sector costs accounting for the majority of the quarterly societal costs at 54 percent and 55 percent, respectively. This was followed by productivity losses at 44 percent (2021/2022 guideline) and 43 percent (2022/2023 guideline).
Unit costs
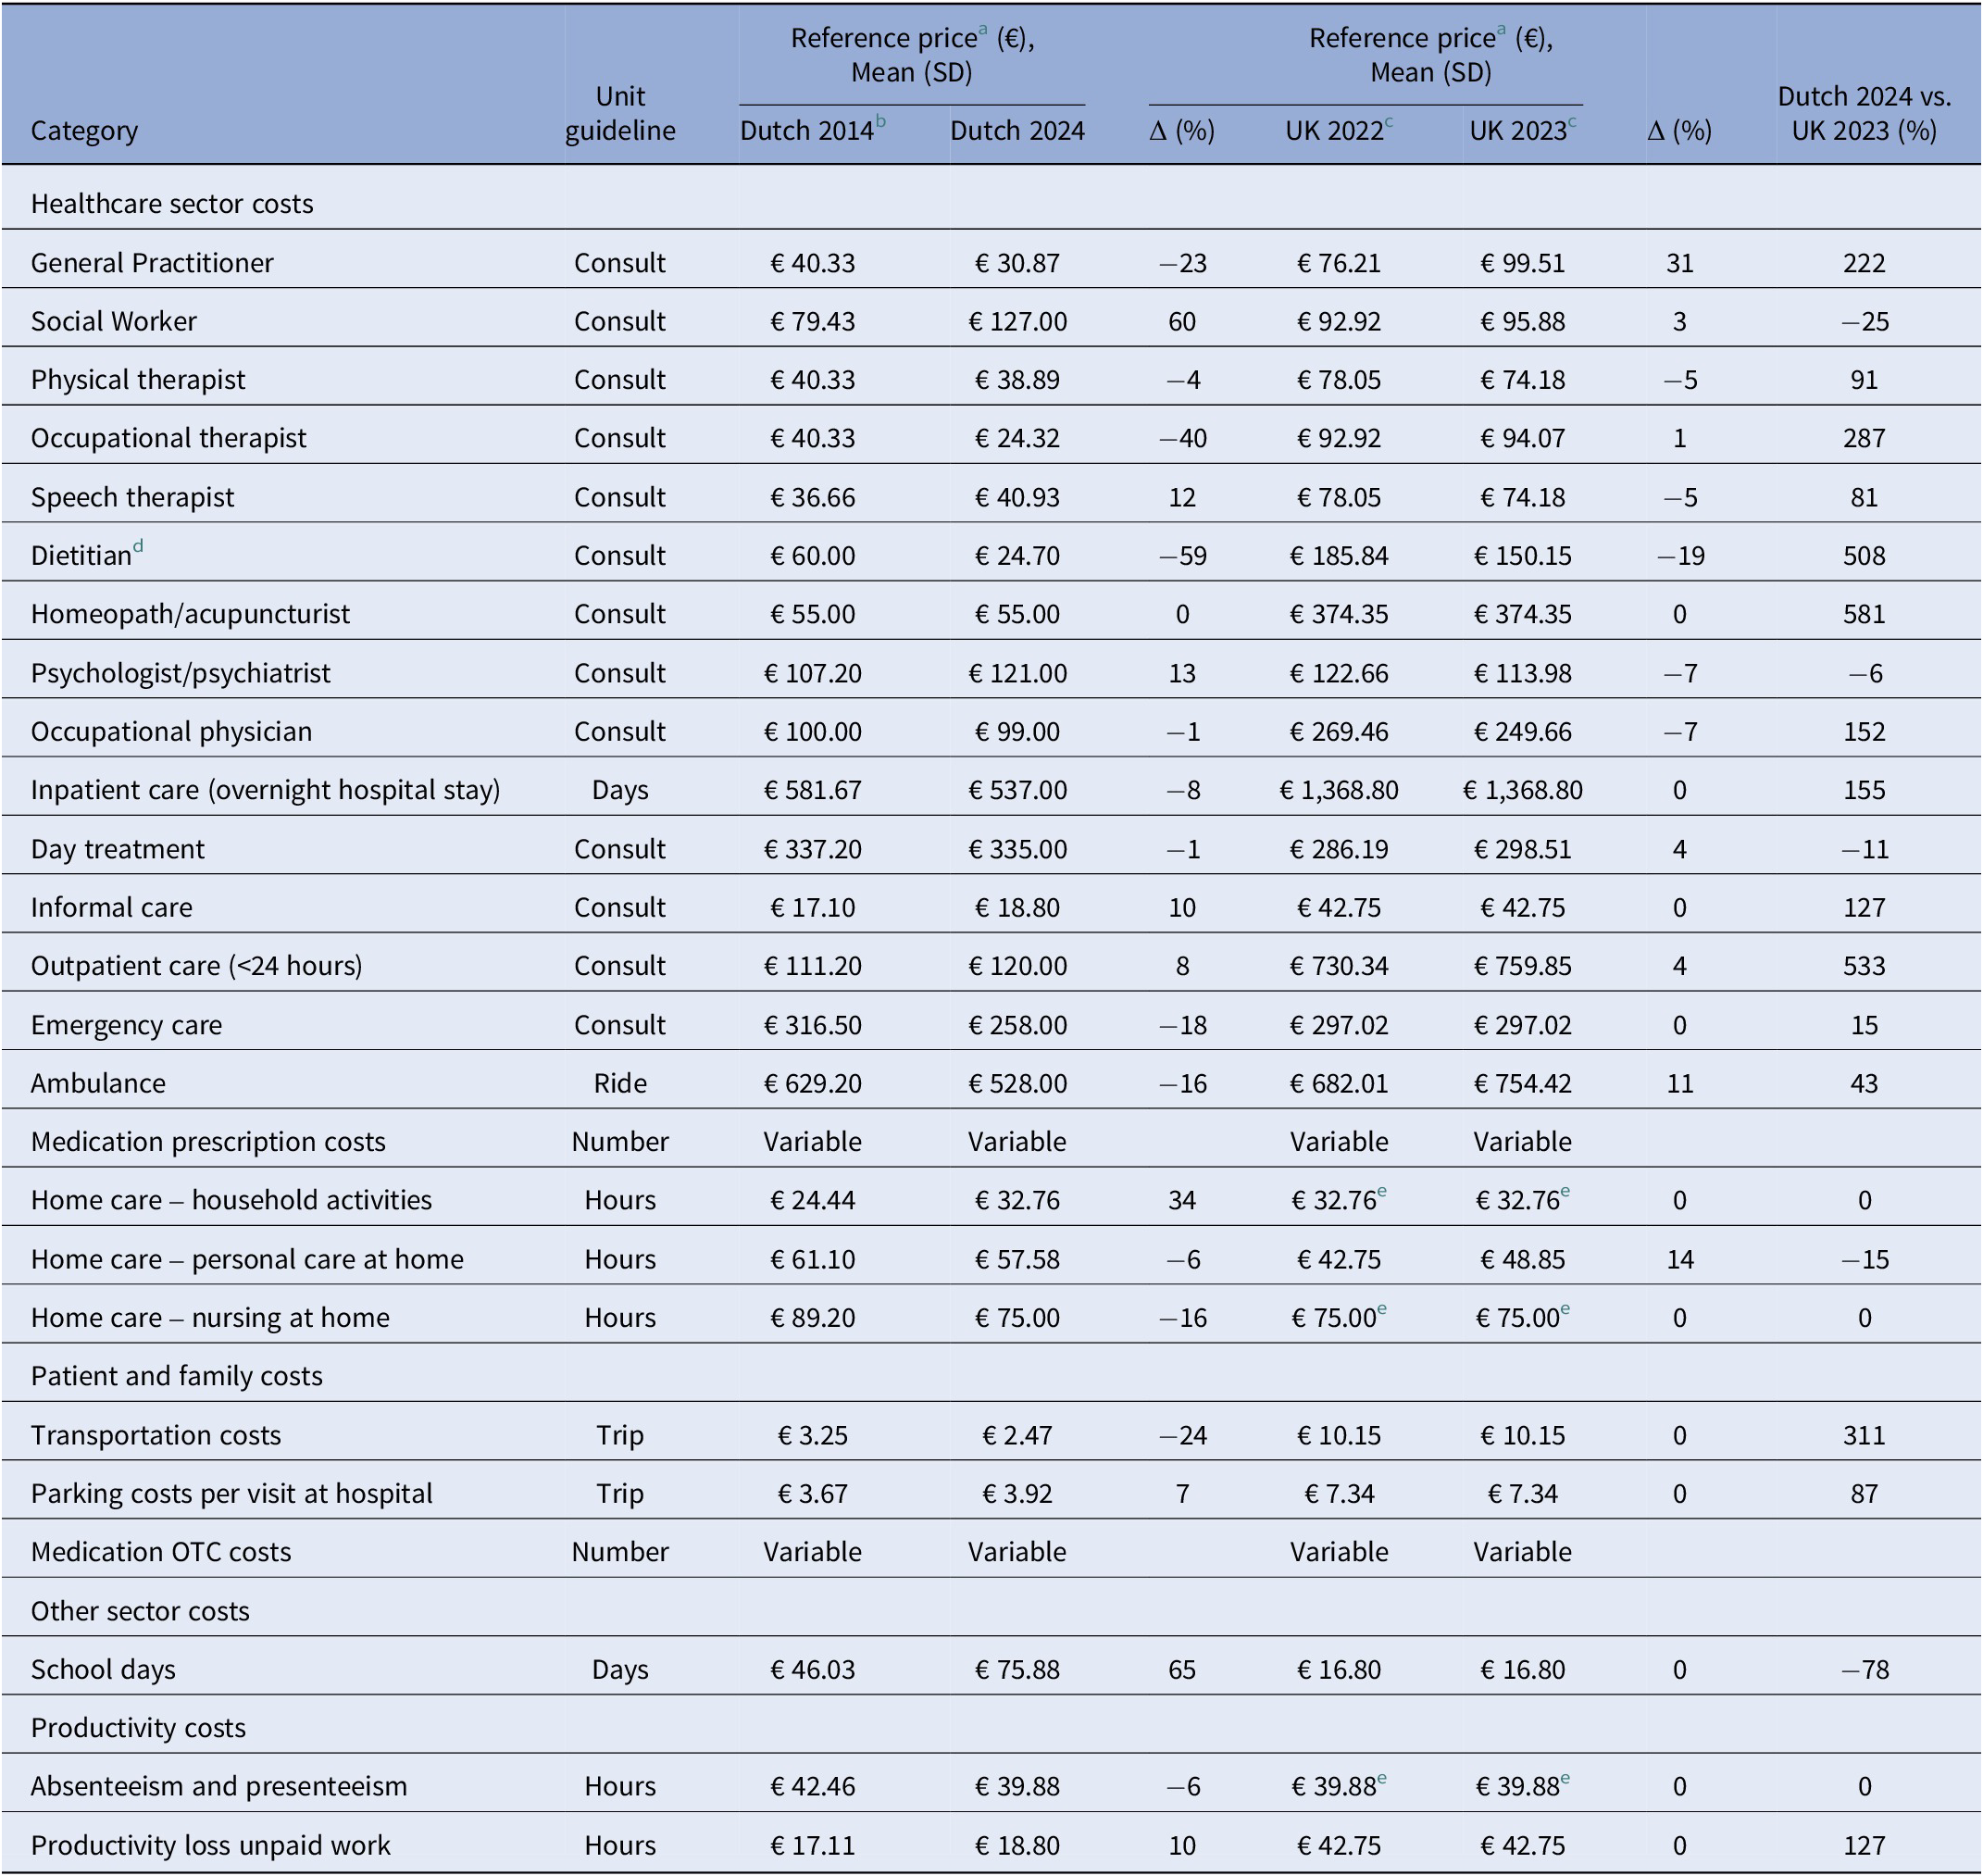
The variations in cost share attribution can be accounted for by changes in unit costs. An overview of the cost per unit item for the healthcare, patient and family, other sector costs, and productivity losses is provided in Table 2. Unit costs for all guideline versions and the difference in unit cost per item are presented.
Overview of reference prices indexed for 2022

Table 2. Long description
The table compares unit reference prices across Dutch and UK costing guidelines by cost category and reports percentage differences between guideline versions and countries. Most Dutch reference prices changed modestly between 2014 and 2024, whereas several healthcare services have considerably higher reference prices in the UK.
a All prices are indexed for the year 2022.
b CPI calculated using the factor 1.222, PPP calculated using the factor 0.726.
c Currency rate of 1.17776 (15 May 2022), PPP calculated using the factor 0.651.
d Reference price of this item was not reported in guidelines; therefore, a price estimate was used.
e Utilization of Dutch reference prices according to the 2024 guideline.
Between the Dutch guideline updates (2014 vs. 2024), twelve cost items varied in price by more than 10 percent (Marked as blue in Table 2). Most notable increases in unit costs were seen for school days (65 percent), social work (60 percent), and homecare-household activities (34 percent). The most notable decreases in unit costs were seen for dietitian (59 percent), occupational therapist (40 percent), and the general practitioner (23 percent) consultations, as well as costs for transportation (24 percent). This is unlike the difference in unit costs between the UK guidelines, where only four cost items differed in price by more than 10 percent (marked as blue in Table 2). The general practitioner costs have increased most significantly by 31 percent, followed by dietitian costs, which have decreased by 19 percent.
When comparing the most recent UK guideline to the most recent Dutch guideline, there are ten items that differ more than 100 percent (Marked as blue in Table 2) in unit cost, with some items differing up to 581 percent. Most items have a higher unit cost in the UK guideline than the Dutch guideline.
Discussion
This study aimed to determine the impact of changes in reference prices on cost analyses in EEs over time and across countries, using AIS as an illustrative example. An increase of 18 percent in total societal costs per patient per quarter was noted for the Dutch 2024 guideline compared to the earlier version (2014). For the United Kingdom, the difference in total societal costs between guideline updates was merely 1 percent. This highlights the role of frequent guideline updates in shaping apparent cost differences, beyond methodological or definitional changes. When comparing the most recent guidelines between countries, UK costs were ~69 percent higher than those in the Netherlands despite identical resource use and indexation for the same year. These findings demonstrate that total cost estimates are strongly influenced by the selection of guideline reference prices, and that cost analyses are highly sensitive to changes in reference prices even when controlling for PPP index year and resource usage for a specific condition.
For example, it is surprising that the reference price for general practitioner consultations in the updated Dutch guideline has decreased despite higher demand and tighter resources in healthcare. According to the Dutch guideline (2014), the reference price for a general practitioner consultation, indexed for 2022, was €40.33. This was based on the total expenditure of 2013, the insured population of that same year, and the number of consultations per person. However, in the updated Dutch guideline, the reference price was significantly reduced to €30.87, including registration fees. The difference may be due to changes in calculation methodology utilized since it was based on total expenditure in 2021 and the number of consultations in 2021 (Reference Hakkaart - van Roijen, Peeters and Kanters11). This example illustrates how differences in total societal costs could be attributed to variation in unit costs. These differences may arise depending on the definition used for a specific cost item or the methodology used to determine the reference price used to calculate the unit cost (Reference Mayer, Fischer, Zechmeister-Koss, Ostermann and Simon10). Thus, reference prices are not merely reflections of market prices or system expenditure, but are constructed estimates dependent on methodological assumptions, including cost components, allocation methods, and valuation perspectives (Reference Mayer, Fischer, Zechmeister-Koss, Ostermann and Simon10).
Beyond the impact on societal costs, variations in reference prices also affected the distribution of costs across sectors. With regard to cost share attribution, productivity losses accounted for the greatest share of societal costs in the Netherlands, whereas in the United Kingdom the majority of the societal costs could be attributed to the healthcare sector. There was notable variation in unit costs for the country-specific guideline updates in the Netherlands, with differences up to 65 percent in unit cost, whereas the UK guidelines showed less variation, with differences up to 31 percent. The variation was also reflected when comparing country-specific cost items between the Netherlands and United Kingdom, with differences up to 580 percent.
The difference between the Netherlands and United Kingdom may be due to the application of guideline-specific unit costs while controlling resource utilization rather than aggregating spending at the system level. Additionally, variation in methodological construction of reference prices, including variation in the incorporation of components such as labor costs, overhead attribution, and service costing approaches used in unit valuations may have resulted in higher total costs for the United Kingdom (Reference Amies-Cull, Luengo-Fernandez, Scarborough and Wolstenholme30;Reference Mokri, Kvamme, de Vries, Versteegh and van Baal31). Although PPP adjustments aid monetary comparability between jurisdictions, they do not eliminate methodological differences in the derivation of reference prices (Reference Fischer, Mayer, Perić and Simon32;Reference Mayer, Berger and Perić33;Reference Pokhilenko, Kast and Janssen34).
Furthermore, differences may occur because of variation in the adopted perspective of the EE. The lack of standardized reference prices for cost items such as absenteeism can be attributed to the United Kingdom’s adopted EE perspective, which lies between a healthcare and a full societal perspective (Reference Sittimart, Rattanavipapong and Mirelman35). For categories without a standardized UK reference price, Dutch reference prices were substituted and converted using PPP. The need for proxy estimates highlights a practical challenge encountered when conducting multinational economic evaluations and may have introduced bias. Additionally, this variation in the preferred perspective reduces transferability and increases the potential for error due to estimations or substitutions for missing reference prices.
These findings have broader implications for national and international health economic research and policymaking. Within-country guideline updates primarily affect the generalizability of cost analyses over time as identical resource utilization can lead to substantially different cost estimates following updates in reference prices. In contrast, cross-country differences in reference prices primarily affect the transferability of cost analyses, posing a major challenge for multinational collaborations seeking to align cost outcomes. These discrepancies limit the utility of EEs for informing multinational decision making, reimbursement strategies, or cross-border health initiatives. Thus, the findings in this study emphasize the need for standardization and harmonization of the methodology for determining unit cost estimates and reference prices at the national and international level (Reference Mayer, Fischer, Zechmeister-Koss, Ostermann and Simon10;Reference Mayer, Berger and Perić33;Reference Pokhilenko, Kast and Janssen34). The current study provides empirical support for initiatives such as the PECUNIA project, which aims to enhance international comparability through harmonized methods for developing reference unit costs (Reference Mayer, Berger and Perić33;Reference Pokhilenko, Kast and Janssen34). By illustrating how variations in the construction of reference prices impact cost analyses, the present findings reinforce the importance of such harmonization efforts. Similarly, Hjemlgren et al. compared health EE guidelines from various countries and concluded that more explicit insight into the monetary valuation of resources is needed for harmonization with respect to reference prices (Reference Hjelmgren, Berggren and Andersson36).
While standardization and harmonization of reference price methodologies may improve the comparability of cost analysis, they do not solely account for the variation in HTA outcomes across countries. Differences in HTA frameworks, willingness-to-pay thresholds, health outcome valuation and decision making criteria may arise depending on how HTA jurisdictions conceptualize and value health gains (Reference Vemer and Rutten-van Mölken37;Reference Weise, Buechter, Pieper and Mathes38;Reference Ahmadnezhad, Kheirandish, Akbari-Sari and Rashidian39). Consequently, standardization and harmonization of reference price methodologies serve as a complementary step toward improving transferability of EEs.
The variation in cost share attribution may also impact prevention and intervention strategies that target specific sectors. Strategies aimed at reducing healthcare sector costs may not be as impactful in the Netherlands compared to the United Kingdom, considering the main cost share attribution in the Netherlands is centered around productivity sector losses. These are essential aspects to consider when implementing cross-national prevention or intervention strategies, for example, the context of cross-border healthcare collaborations.
This study demonstrates the impact of reference prices on cost analyses in EEs and thereby raises awareness of the resulting implications. By acknowledging the challenges, discussions can be started, and solutions can be found. To understand the impact reference prices have on cost analyses, factors such as resource usage were controlled. However, it should be noted that resource usage may change depending on the context of the study.
A limitation of this study is the error in unit cost valuation. There are several variables that contribute to increased margins of error in reference prices. First, reference price definitions varied between guidelines, and hence the reference price that was most representative was selected. Second, in case reference prices were not available, an estimation had to be made, as was the case for the reference price of a dietitian consultation for the Dutch guideline (version 2014). These increases in error further illustrate the need for standardization of definitions and availability of similar reference prices for items across countries. Finally, the lack of UK reference prices for productivity losses required the use of Dutch proxy estimates, which may have resulted in a biased presentation of the true costs. However, it also demonstrates a practical challenge in EEs across multiple nations, where a lack of comprehensive guideline coverage requires the adoption of proxy estimates.
Conclusions
Changes in reference prices substantially impact cost analyses within and across countries. The sensitivity of cost analyses reduces the transferability of cost analysis findings between countries. Furthermore, reference price changes due to country-specific guideline updates hamper the generalizability of longitudinal studies’ findings within countries. Greater transparency, standardization, and international harmonization of reference price methodologies are needed to improve comparability, transferability, and usefulness of EEs.
Supplementary material
The supplementary material for this article can be found at http://doi.org/10.1017/S0266462326104103.
Author contribution
The authors made the following contributions. Conceptualization: T.C.A.H. and A.N. Material preparation: T.C.A.H., and A.N. Data curation: T.C.A.H. and A.N. Formal analysis: T.C.A.H. and A.N. Writing – original draft preparation: T.C.A.H. Writing – review and editing: T.C.A.H. and A.N. Final approval: T.C.A.H. and A.N.
Authorship confirmation
All authors certify that they meet the ICMJE criteria for authorship.
Funding statement
The authors received no financial support for this research.
Competing interests
The authors declare none.


 Open access

