Introduction
Globally, it is estimated that between 5 and 10 million people die annually due to kidney disease.Reference Luyckx, Tonelli and Stanifer1 Chronic kidney disease is the most neglected chronic disease and continues to be under recognised, despite being identified as a huge economic burden. Its link with other major diseases such as cardiovascular disease, hypertension and diabetes is often underestimated.Reference Luyckx, Tonelli and Stanifer1,Reference Couser, Remuzzi, Mendis and Tonelli2 Effective screening, prevention and early treatment can slow or reduce the incidence of chronic kidney disease.Reference Levey, Atkins and Coresh3 Understanding the influences for the healthy development of the kidneys and subsequent kidney function is a priority.
It is well established that developmental programming of the foetal kidney can affect kidney evolution in utero and in early life, which can in turn impact kidney growth patterns and function.Reference Brenner, Garcia and Anderson4,Reference Luyckx and Brenner5 The association between an adverse intrauterine environment and the development of chronic kidney disease and hypertension later in life is compelling.Reference Zohdi, Sutherland, Lim, Gubhaju, Zimanyi and Black6–Reference Hinchliffe, Lynch, Sargent, Howard and Van Velzen8 Low birth weight (defined as birth weight < 2500 g) is associated with a 70% increased risk of developing chronic kidney disease.Reference White, Perkovic and Cass9
Low birth weight, or small for gestational age (SGA) (defined as birth weight < 10th centile), is often used as a proxy for foetal growth restriction (FGR), previously known as intrauterine growth restriction. The two terms, however, are different, as not all SGA infants are growth restricted and not all growth-restricted infants are SGA. True FGR is a major cause of morbidity and mortality and is believed to predispose to a range of diseases later in life.Reference Smith10–Reference Barker, Osmond and Law12 Serial antenatal ultrasound growth measurements and uteroplacental and foetal Dopplers are employed to diagnose FGR.Reference Smith10,Reference Gordijn, Beune and Thilaganathan13
A reduced nephron endowment is associated with an increased susceptibility to hypertension and renal disease.Reference Brenner, Garcia and Anderson4,Reference Zohdi, Sutherland, Lim, Gubhaju, Zimanyi and Black6,Reference Hoy, Bertram, Denton, Zimanyi, Samuel and Hughson14 Nephrogenesis in utero is the main determinant of life-long nephron number, and so it is vital to consider the impact of foetal life programming, such as FGR, on the risks of developing kidney disease.Reference Hinchliffe, Lynch, Sargent, Howard and Van Velzen8,Reference Luyckx, Bertram and Brenner15 The challenge remains to find a method to quantify nephron numbers in utero and develop useful early prognostic factors for future renal function.Reference Bagby7,Reference Brennan, Watson, Rudd, Schneider and Kandasamy16,Reference Ismaili, Schurmans, Wissing, Hall, Van Aelst and Janssen17
Measurement of the foetal renal parenchymal thickness (RPT) with antenatal ultrasound is a novel, non-invasive method to assess changes in kidney growth. The parenchymal tissue of the kidney comprises the renal cortex and medulla, which contain the functional units of the kidney – the nephrons and glomeruli. The renal parenchyma measurement is a single, easily performed measurement focusing on the nephron-rich area. Additionally, quantifying foetal renal artery blood flow may be valuable to investigate alterations in perfusion, as it is well established that during foetal hypoxia, such as seen in FGR, blood flow is preferentially shunted away from the kidneys to more essential organs such as the heart, brain and adrenals.Reference Baschat and Hecher18 There is very little information on the usefulness of assessing the foetal renal parenchyma as a prognostic tool for renal function.
The aim of this study was to determine the effect of FGR on the development of the foetal kidneys by evaluating the RPT during consecutive ultrasound examinations between 20 and 36 weeks gestational age (GA). The primary outcome measure was the difference in RPT between appropriately grown and growth-restricted foetuses, and the secondary outcome measure was the blood flow to the foetal kidneys between these two groups. We hypothesised that FGR impairs RPT growth.
Method
This prospective, longitudinal, observational study was conducted between May 2017 and February 2019 in the Maternal Fetal Medicine Unit and Ultrasound Department at the Townsville Hospital, Australia.
Study population
The Townsville Hospital and Health Service provides tertiary, perinatal services and receives public and private referrals for obstetric care from all over North Queensland, with a catchment population of around 700,000 and 10,000 births per year.19 Pregnant patients aged 18 years or older, who presented to the Townsville Hospital for a second-trimester obstetric ultrasound scan between May 2017 and October 2018, were invited to participate, or they were informed about the study by their treating obstetrician, midwife or sonographer.
Women were included if they had a singleton pregnancy up to 30 weeks gestation with an accurately dated pregnancy based on last normal menstrual period (LNMP) and first-trimester ultrasound, that correlated with each other within 7 days, or on first-trimester ultrasound if LNMP was uncertain. Women were excluded if they had a multiple pregnancy, uncertain dates or any major congenital foetal abnormality or chromosomal abnormality. Detailed written information was given to the patient and written consent was obtained.
Study process
Participants completed a questionnaire, which included demographic, medical and obstetric data. The first ultrasound was most commonly performed between 16 and 26 weeks GA; however, nine women had their first ultrasound between 28 and 30 weeks GA and one at 30 weeks. To obtain robust longitudinal data, women were asked to attend ultrasound scans every 4 weeks from their first ultrasound until delivery. Some women, particularly those with high-risk pregnancies, had additional clinically indicated ultrasounds. If an ultrasound was performed at two or more weeks from the previous ultrasound recorded for the study, renal measurements were performed again for the study.
Ultrasound examination
Three Australian Accredited Medical Sonographers, with at least 2 years post-ultrasound qualification experience, performed all examinations. A documented protocol outlined the required renal measurements and how they were to be performed for the study. Training of the sonographers was conducted prior to commencement of the study. An audit and follow-up was conducted with all participating sonographers 3 months after commencement of the study to confirm adherence to the study protocol. A Voluson E8 (GE Healthcare Ultrasound, Milwaukee, WI, USA) or an Epiq 7 (Philips Ultrasound, Bothell, WA, USA) was used for the ultrasound examinations, and the highest frequency transducer possible, matching the mother’s body habitus (1–5 MHz), was selected to obtain the highest image resolution for each participant.
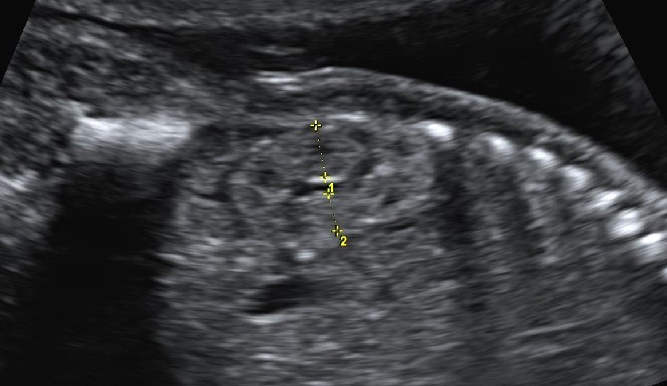
Where possible, the foetal kidneys were measured with the foetal spine positioned anteriorly or as close as possible to this position. The image was magnified so that the kidney occupied most of the image, and one focus was placed at the level of the kidney. The RPT was measured in the midsagittal plane of the kidney. It was measured from the inner aspect of the renal capsule to the sinus–pyramidal apex interface in two directions – from the posterior aspect of the kidney to the sinus–pyramidal apex (posterior parenchyma) and from the anterior border of the kidney to the sinus–pyramidal apex (anterior parenchyma) (Fig. 1). Each measurement was performed twice, and the mean of the two measurements was recorded. Both kidneys were measured.
Measurement of the renal parenchymal thickness posteriorly (1) and anteriorly (2) from the inner aspect of the renal capsule to the sinus–pyramidal apex interface at 20 weeks GA.

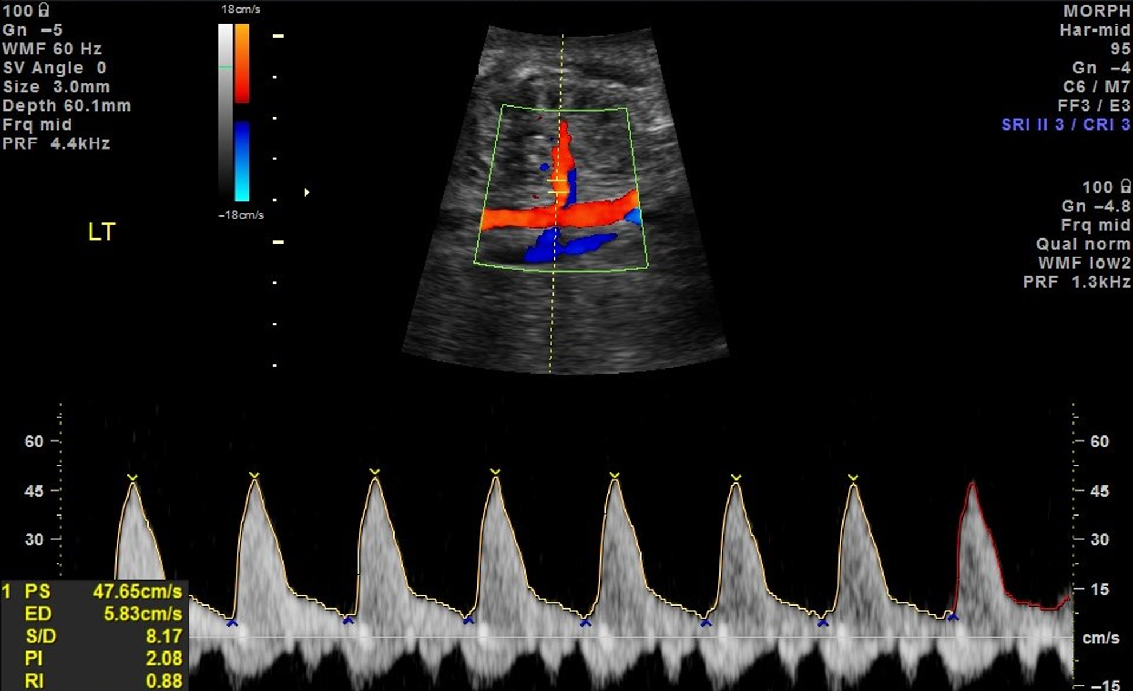
Bilateral foetal renal artery Dopplers were performed in a coronal view of the kidneys. Colour flow was employed to identify the renal artery arising from the aorta and entering the kidney. A low wall filter between 30 and 60 Hz was used, and a sample gate of size 2–3 mm was placed in the mid-trunk of the main renal artery. A pulse wave signal was obtained using an angle as close to 0° as possible and when there was no foetal movement or breathing (Fig. 2). The average of at least three consistent consecutive waveforms was used to calculate the resistivity index (RI) and pulsatility index (PI).
Colour and pulse wave Doppler from the mid-trunk of the left main renal artery at 33 weeks GA.

Sample size
The sample size was calculated based on a statistical power of 80% and a significance level of 0.05 (two-tailed). Data from our previously published study demonstrated that the mean RPT was 9.4 mm (±1.1 mm) for normal birth weight neonates and 8.3 mm (±1.0) mm for low birth weight neonates at term.Reference Brennan and Kandasamy20 Therefore, it was estimated that a sample size of 30 would be needed [15 growth-restricted foetuses and 15 appropriate for gestational age (AGA)]. Allowing for the possibility of loss to follow-up, at least 20 participants would be recruited for each group resulting in a total of 40 participants, each having ultrasound scans at least every 4 weeks.
Analysis
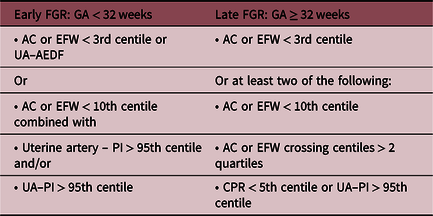
After birth, the infants were assigned to one of two groups – AGA or FGR. These groups were defined a priori.Reference Gordijn, Beune and Thilaganathan13 Birth weight was plotted on Hadlock et al.’sReference Hadlock, Harrist, Sharman, Deter and Park21 foetal weight charts, as it has been demonstrated that neonatal charts do not represent a random sample of the population at a given GA.Reference Smith10 Infants born preterm are over-represented with cases of FGR, and therefore foetal growth should be assessed against measurements of on-going pregnancies at that GA as opposed to a birth weight of infants born at a given GA.Reference Smith10,Reference Nicolaides, Wright, Syngelaki, Wright and Akolekar22 Those infants with a birth weight above the 90th centile were considered large for gestational age (LGA) and were excluded from this analysis. The criteria for classification of FGR are shown in Table 1 and were based on a consensus definition of FGR obtained by Delphi survey of 45 international experts in the field.Reference Gordijn, Beune and Thilaganathan13 Infants who were neither LGA nor FGR were considered AGA.
Classification of FGR

AC, abdominal circumference; AEDF, absent end diastolic flow; CPR, cerebroplacental ratio; EFW, estimated foetal weight; FGR, foetal growth restriction; PI, pulsatility index; UA, umbilical artery.
Based on Gordijn et al.Reference Gordijn, Beune and Thilaganathan13
Analysis of maternal and birth characteristics was performed using IBM SPSS version 25, Armonk, NY, USA. Normality of the demographic data was tested using a Kolmogorov–Smirnov test and visually inspecting the histograms. Normally distributed variables were reported as a mean and standard deviation and non-normally distributed variables as a median and interquartile range. All other analyses were conducted using R Statistical Language in R Studio (version 1.2.1335, Vienna, Austria).Reference Core Team23,24 Visual inspection of residual plots did not reveal any obvious deviations from homoscedasticity or normality. No outliers were removed. The nlme package (version 3.1-139)Reference Pinheiro, Bates, DebRoy and Sarkar25 was used to fit a random slopes linear mixed effects model to describe the effects of explanatory variables on RPT. The graphics were created with ggplot2.Reference Wickham26 Two models were fitted.
The first model focused on the relationship between the RPT and GA. For this analysis, the response variable was RPT and fixed effects in the model were GA, growth (either AGA or FGR), kidney side (right or left) and the interaction between GA and growth. The relationship between parenchymal thickness and GA showed significant curvature, so a quadratic term was also included in the model. Other fixed effects were also tested (anterior or posterior parenchyma and gender); however, they did not improve the fit. Random effects were participants with random intercepts as well as random slopes for the effect of GA. Alternative models of different complexity were compared using likelihood ratio (LR) tests and Akaike’s information criteria (AIC).
The second model assessed the effects of growth (AGA vs. FGA) on the relationship between the thickness of the foetal renal parenchyma and the head circumference (HC). We assumed a power function of the form:
 $$y = a{x^b}$$
was appropriate to describe this relationship, where y = parenchymal thickness and x = HC. Since y and x are both linear measurements, the value of b should equal 1 if both grow at the same rate. In order to fit the model, the renal parenchyma and HC measurements were log transformed to convert the power function to a linear equation of the form:
 $${\rm{log}}\left( y \right){\rm{ = log}}\left( a \right)+b \left( {{\rm{log}}\left( x \right)} \right).$$
The fixed effects in the model were HC (log10), growth (either AGA or FGR) and kidney side (right or left). In this case, the interaction term did not improve the model fit and is omitted from the final model, as are other fixed effects tested (anterior or posterior parenchyma and gender). Random effects were participants with random intercepts as well as random slopes for HC (log10).
Analysis of the foetal renal arteries (for both RI and PI) used fixed effects of GA (as a quadratic fit), growth (AGA or FGR), with interaction and kidney side (right or left). Other fixed effects tested which did not improve the model included anterior or posterior parenchyma and gender. Random effects were participants with random intercepts as well as random slopes for the effect of GA. As in previous models, LR tests and AIC were used to compare alternative models.
Results
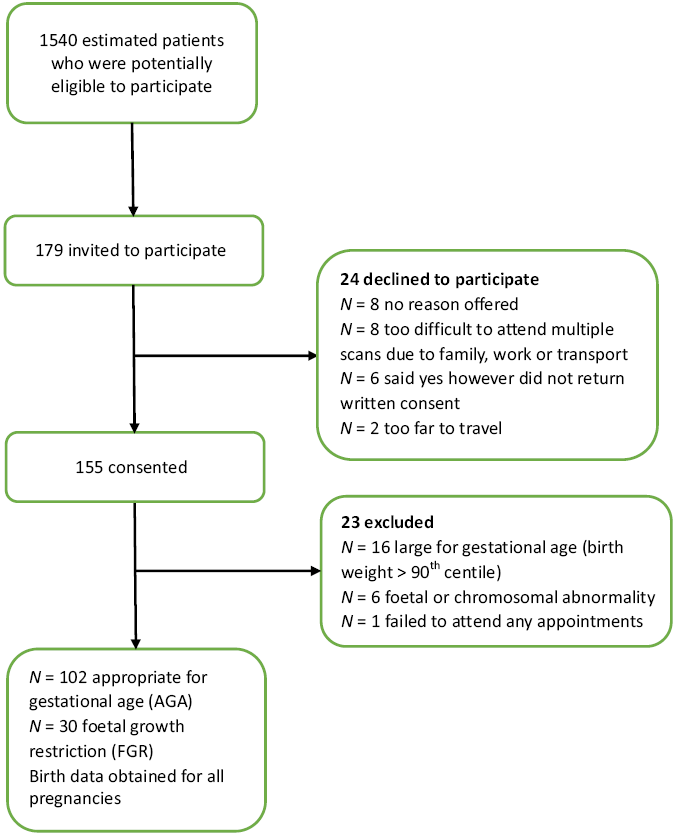
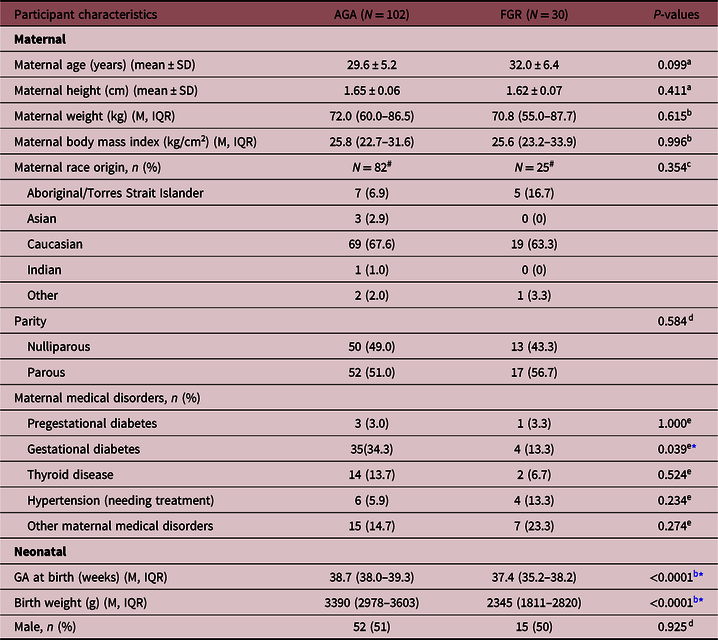
One hundred and fifty-five pregnant women were recruited for the study, with 23 excluded (Fig. 3). Among the remaining 132 pregnancies, 102 were AGA and 30 were FGR. The characteristics of the mother and baby are summarised in Table 2. FGR was associated with a significantly lower birth weight, an earlier GA at birth and a lower rate of diabetes.
Flow chart of participant inclusion and exclusion processes.

Characteristics of 102 AGA and 30 FGR pregnancies and their infants

AGA, appropriate for gestational age; FGR, foetal growth restricted; GA, gestational age; IQR, interquartile range; M, median; SD, standard deviation.
# 20 (19.6%) AGA and 5 (16.7%) FGR participants declined to answer maternal race.
* P < 0.05.
a Independent t-test.
b Mann–Whitney U.
c Likelihood ratio.
d Pearson chi-squared.
e Fisher’s exact test.
Due to the small number of examinations below 20 weeks and over 38 weeks GA, data were only included between 20 weeks 0 days and 37 weeks 6 days GA. Measurements were obtained from both foetal kidneys and renal arteries with a total of 638 separate ultrasound examinations performed between 20 and 37 weeks GA. The median number of scans per pregnancy was 5 (range: 1–8). The full set of planned examinations were not completed in some cases as the participant delivered prior to the end of the study.
Renal parenchymal thickness
In total, 2556 RPT measurements were made – 4 measurements on each foetus at each GA, corresponding to 1 each by side (right or left) and anterior and posterior. During modelling, no significant effect was found according to gender (P = 0.177) or whether the anterior and posterior parenchyma was measured (P = 0.163), and therefore these were not included in the model. There was a significant difference in the RPT between the right and left kidneys with the left parenchyma measuring significantly thinner (P = 0.001), and therefore kidney side was included in the model.
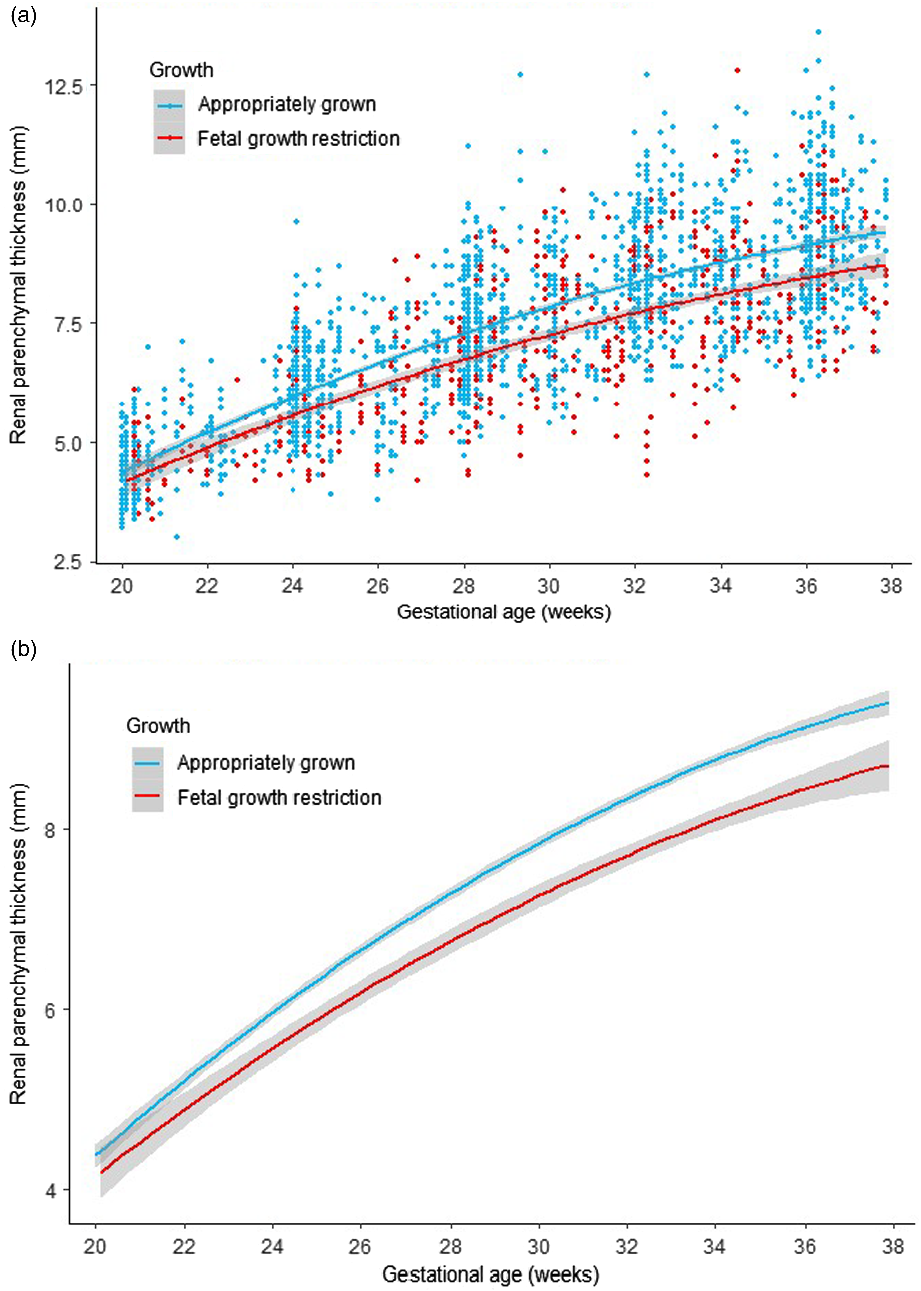
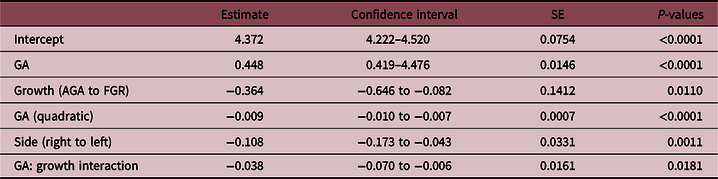
The findings have demonstrated that the RPT is significantly thinner in growth-restricted foetuses when compared to appropriately grown foetuses, and the effect is strong (LR = 21.06, P = <0.0001). P-values are obtained by LR tests of the full model with the growth of the foetus (whether they are appropriately grown or not) in the model against a model without the foetal growth included. With increasing GA, the difference between the thickness of the parenchyma of appropriately grown and growth-restricted foetuses increases. The overall regression line (assuming independence) is illustrated in Fig. 4. Table 3 displays the fixed effects estimates and Supplementary Table S1 displays the random effects. The equations for RPT are
Right AGA RPT = 4.37 + 0.448GA − 0.00885(GA2).
Right FGR RPT = 4.37 + (0.448 − 0.0383)GA − 0.00885(GA2).
Left AGA RPT = (4.37 − 0.108) + 0.448GA − 0.00885(GA2).
Left FGR RPT = (4.37 − 0.108) + (0.448 − 0.0383)GA − 0.00885(GA2).
Renal parenchymal thickness by GA for appropriately grown and foetal growth-restricted foetuses: (a) overall regression lines with all data points and (b) overall regression lines. Shades denote 95% confidence interval.

Fixed effects estimates for renal parenchymal thickness by GA modelling

AGA, appropriate for gestational age; FGR, foetal growth restriction; GA, gestational age; SE, standard error.
95% confidence intervals.
RPT compared to HC
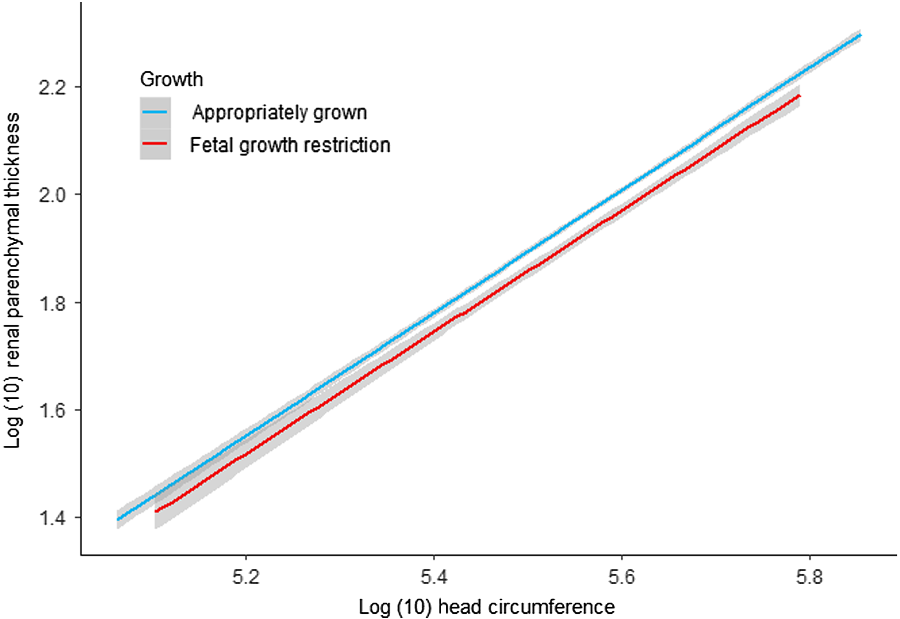
Growth of the RPT was compared to HC (Fig. 5), and this showed a significant difference between AGA and FGR foetuses (LR = 8.9, P = 0.0028) with the RPT growing at a slower rate compared to HC in FGR than in AGA foetuses. There was, however, no difference in the slope of the growth. Fixed and random effects estimates are provided in Supplementary Tables S2 and S3.
Relationship between log(10) transformed renal parenchymal thickness and HC for appropriately grown and foetal growth-restricted foetuses. Shades denote 95% confidence interval.

Renal artery Dopplers
In total, 1235 renal artery Dopplers were carried out. Doppler of the renal artery was not able to be obtained for 1 kidney in 25 scans and for both kidneys in 12 scans due to foetal position and/or persistent movement. No significant difference was seen between AGA and FGR foetuses in the RI (P = 0.182) or PI (P = 0.554) of the renal arteries. Supplementary Tables S4 and S5 show the fixed and random effects estimates, respectively.
Discussion
RPT and FGR
Our study demonstrates that the RPT is significantly thinner in growth-restricted foetuses when compared to appropriately grown foetuses. A point of difference with this study is that foetal size and Doppler criteria were used to classify true FGR.Reference Gordijn, Beune and Thilaganathan13 Almost all previous foetal and kidney studies use SGA as a surrogate for FGR.Reference Zohdi, Sutherland, Lim, Gubhaju, Zimanyi and Black6,Reference Silver, Decamps, Korst, Platt and Castro27–Reference Drougia, Giapros, Hotoura, Papadopoulou, Argyropoulou and Andronikou29 Recent advances in medical imaging technology and publication of an international consensus on FGR classificationReference Gordijn, Beune and Thilaganathan13 enable clinicians and researchers to improve the diagnosis of FGR and understand that FGR is failure to achieve optimal growth and not just smallness.
SGA is based only on a weight cut-off after birth, such as a birth weight less than 2500 g, and therefore includes genetically small foetuses, but healthy, and excludes infants within the normal weight range who are truly growth restricted. FGR is defined as a pathologically small foetus that does not meet its optimal growth and will usually be associated with abnormal uteroplacental or foetal blood flow.Reference Smith10,Reference Gordijn, Beune and Thilaganathan13 It is largely independent of absolute growth and is principally based on growth trajectory.Reference Figueras and Gratacos30 If foetal growth drops from the 80th centile to the 20th centile over time, the foetus is considered growth restricted even though the foetal weight is within the normal range.
As this was a longitudinal study, we can truly assess the growth of the parenchyma in real time. In the literature, only limited data are available on actual foetal kidney growth; as although some studies report kidney growth, the studies are cross-sectional in design and therefore unsuitable to assess growth.Reference Brennan, Watson, Rudd, Schneider and Kandasamy16 A strength of our study was having longitudinal data analysed by mixed effects modelling. Mixed effects modelling is much more flexible and powerful than traditional analyses that perform overall averaging.Reference Baayen, Davidson and Bates31 Every data point is considered using fixed and random effects in a single model to account for all sources of variation. Mixed effects models can deal with missing data and naturally handle unevenly spaced repeated measures which commonly occur in human studies.
Our study demonstrated a significant difference in thickness and growth trajectory of the renal parenchyma between AGA and FGR foetuses. With increasing GA, the difference between thicknesses of the parenchyma in the two groups increased. Placental insufficiency is the most common cause of FGR.Reference Smith10,Reference Resnik11 It is therefore plausible that this deceleration in growth of the parenchyma of FGR foetuses may be at least partly due to increasing placental insufficiency and redistribution of foetal blood supply away from the foetal kidneys. This is particularly important for kidney development as nephrogenesis continues up until 36 weeks GA, with 60% of nephrons formed in the third trimester.Reference Hinchliffe, Sargent, Howard, Chan and van Velzen32 Ultrasound studies also indicate maximum kidney growth occurs in the third trimester.Reference Verburg, Geelhoed and Steegers33,Reference Konje, Bell, Morton, de Chazal and Taylor34 This coincides with the timing of incidence of the majority of FGR.Reference Sharma, Shastri, Farahbakhsh and Sharma35
Our analysis has shown that the right foetal renal parenchyma was thicker than the left by 0.11 mm. This is not thought to be clinically important. In a recent systematic review completed by our group on the evaluation of foetal kidney growth using ultrasound, we discovered almost all studies found no significant difference between right and left foetal kidney size.Reference Brennan, Watson, Rudd, Schneider and Kandasamy16 One large study (n = 1215) did find that the right kidney was significantly wider and deeper than the left kidney, however, not longer.Reference Verburg, Geelhoed and Steegers33 This is consistent with our study demonstrating a thicker parenchyma in right kidneys. Our ability to detect this difference may be due to the higher sensitivity provided by the mixed effects modelling in our study.
Foetal and neonatal kidney volumes have been used as a surrogate measure of nephron number and kidney function.Reference Kandasamy, Smith, Wright and Lumbers36–Reference Roderick, Jeffrey, Yuen, Godfrey, West and Wright39 There are some limitations, however, with using kidney volume as an estimate of nephron number. Obtaining a kidney volume involves acquiring three orthogonal measurements and then applying an ellipsoid formula. There is an error associated with each measurement and the formula. A study we conducted in neonates demonstrated that kidney volume measurements had a significantly higher variance than RPT measurements.Reference Brennan and Kandasamy20 Ultrasound kidney volumes calculated using the ellipsoid formula have also been found to underestimate actual kidney volume compared to in vivo and ex vivo models by more than 20%.Reference Bakker, Olree, Kaatee, de Lange and Beek40,Reference Cheong, Muthupillai, Rubin and Flamm41 The advantage of measuring the RPT is that instead of measuring the entire kidney, a single measurement is performed in the functional, nephron-containing region and the collecting system is not included. For example, in cases of hydronephrosis measurements of kidney volume could significantly overestimate nephron number due to the enlargement of the collecting system when in fact the renal parenchyma could be thinner than normal, and the kidney may have impaired function.
KadiogluReference Kadioglu42 appears to be the first author to report normative ultrasound values for RPT for children to assess for alterations in normal growth. Our studies since on the RPT of neonates and other studies in children highlight the potential of the parenchymal thickness measurement as a possible marker for renal function and to monitor renal parenchymal changes.Reference Brennan and Kandasamy20,Reference Brennan and Kandasamy43–Reference Eze, Akpan and Nwadike45 One study has reported some normal ranges for foetal RPT,Reference Hadar, Davidovits and Mashiach46 however, to our knowledge no study has investigated the growth of the renal parenchyma with GA in growth-restricted foetuses. This new parenchymal thickness measurement is a more specific, indirect evaluation of nephron endowment.
Measurement of foetal RPT could be used to monitor the effects of FGR on foetal kidney growth and the effects of any possible interventions for FGR treatment. FGR can arise from foetal, placental and/or maternal disorders and often may be due to a combination of more than one cause.Reference Resnik11,Reference Sharma, Shastri, Farahbakhsh and Sharma35 When placental abnormalities or maternal disease is the cause, nutrients and oxygen flow to the foetus may be impaired. The foetus compensates for this by preferentially shunting blood away from organs such as the kidneys, towards the more essential organs of the brain (known as “brain sparing”), heart and adrenals.Reference Baschat and Hecher18
Considering that there may be brain sparing in the FGR foetuses, the growth of the RPT was compared to the growth of the HC between the AGA and FGR groups and a significant difference was seen in our study. In foetuses with the same HC, a growth-restricted foetus was more likely to have a thinner parenchyma than an appropriately grown foetus. This suggests that in small growth-restricted foetuses the renal parenchyma is thinner than could be expected purely based on foetal size compared to an appropriately grown foetus. A possible mechanism for this differential renal parenchyma growth is preferential shunting of foetal blood away from the kidneys to the brain due to foetal hypoxia which impacts on appropriate nephrogenesis. The fact that the slopes are the same for both groups may imply that the “brain-sparing” effect happens earlier than 20 weeks gestation and that the kidneys never catch up once they have been compromised.
Foetal renal arteries
The renal arteries were analysed for any changes in blood flow to the kidneys. No significant difference in the resistivity or PI of the foetal renal arteries between AGA and FGR foetuses was seen. This is consistent with the findings from other studies.Reference Silver, Decamps, Korst, Platt and Castro27,Reference Stigter, Mulder, Bruinse and Visser47 This observation may be due to several reasons. (1) Foetal blood flow to the kidneys is very low with only 5% of cardiac output going to the kidneys compared to 9% after birth.Reference Blackburn48 Therefore, any change in foetal blood flow may be too subtle for us to detect using ultrasound. It is also possible that our study was not powered to specifically detect a difference in the renal blood flow. (2) A much larger study of FGR foetuses with identifiable abnormal uteroplacental or foetal blood flow is needed to detect a difference.
Limitations of the study
There were some limitations to our study. The lack of blinding of the sonographers could have potentially introduced measurement bias. It was difficult to blind the sonographer to all clinical and biometric information as most of the studies included a diagnostic scan. Sonographers are generally specifically trained not to look at the measurements at the time that they are being performed. Additionally, the infants were not assigned to AGA and FGR groups until after birth and it was based on birth weight and not the estimated foetal birth weight calculated from the measurements done by the sonographer. Having multiple sonographers performing the examinations rather than only one reduces some of the bias. Another limitation was the number of the FGR group compared to the AGA group. The foetuses in the FGR group were more likely to be delivered earlier before all planned ultrasound examinations could be performed.
Future direction
Although it is widely accepted that FGR has an effect on nephron number and future kidney function, there is a lack of in vivo proof of the mechanisms occurring in utero.Reference Zohdi, Sutherland, Lim, Gubhaju, Zimanyi and Black6 This study provides evidence of an effect on the development of the renal parenchyma which likely represents a reduced nephron number, in circumstances of true FGR.
Life-long monitoring of growth restricted, low birth weight and preterm infants along with those exposed to pre-eclampsia or gestational diabetes is advocated.Reference Luyckx, Perico and Somaschini49 Such an implementation would involve a significant number of the population and be a significant health cost burden. Measurement of the RPT, in contrast, has the potential to more appropriately and accurately identify infants with a reduced nephron endowment, so that monitoring and interventions can be focused on those individuals at a higher risk of developing neonatal acute kidney injury and future hypertension and chronic kidney disease.
Conclusion
Kidney disease is associated with a significant global burden and health costs, and this study improves our understanding and assists in identifying adverse effects on the kidney during gestation. Utilising ultrasound to measure the foetal RPT provides a simple, non-invasive estimate of nephron number. Our data suggest that FGR has a negative influence on nephron numbers as it is associated with a significantly thinner parenchyma and slower growth trajectory. It should be remembered that having a reduced nephron number alone does not mean hypertension or chronic kidney disease is inevitable, but that the kidney may be less able to endure future kidney injury in later life. Using the approach outlined in our study, there is the potential to prevent or reduce the adverse outcomes of kidney disease for future generations.
Acknowledgments
The authors thank all the women who participated in the study and acknowledge their significant contribution. The authors thank Emprof Rhondda Jones for her invaluable help and advice with the statistical analysis and interpretation for this paper. The authors also thank Ms. Nicole Clapham for organising participants, data management and collection, and sonographers Ms. Sue Bloomfield and Ms. Kate Gerard for helping to perform the ultrasound examinations.
Financial support
This work was supported by the Australasian Society for Ultrasound in Medicine (ASUM research grant 2018) and the Townsville Hospital Study, Education and Research Trust Account (SERTA grant 27_2016).
Conflicts of interest
The authors have no conflicts of interest to declare.
Ethical standards
The authors assert that all procedures contributing to this work comply with the ethical standards of the National Health and Medical Research Council of Australia and with the Helsinki Declaration of 1975, as revised in 2008 and have been approved by the Townsville Hospital and Health Service Human Research Ethics Committee (HREC/16/QTHS/216).
Supplementary material
To view supplementary material for this article, please visit https://doi.org/10.1017/S204017442000015X.