I. INTRODUCTION
Age hardening is a heat treatment technique widely used to increase the yield strength of aluminum alloy. Reference Marioara, Andersen, Zandbergen and Holmestad1,Reference Andersen, Marioara, Frøseth, Vissers and Zandbergen2 It is known that the addition of Cu to an Al–Mg–Si alloy is an effective way in increasing the age-hardening response of alloy. Reference Daoudi, Triki and Redjaimia3,Reference Holmestad, Bjørge, Ehlers, Torsæter, Marioara and Andersen4 The precipitation sequence generally accepted for the Al–Mg–Si alloys is as follows Reference Andersen, Marioara, Frøseth, Vissers and Zandbergen2–Reference Torsæter, Lefebvre, Marioara, Andersen, Walmsley and Holmestad5 :
Super-saturated solid solution (SSSS) → clusters → spherical Guinier-Preston (GP) zones + platelet-like GP-zones → β′ → β″ → β.
With exception of the equilibrium phase β (Mg2Si) phase, all phases are assumed to be metastable. In the aging process SSSS is gradually reduced, and strength increases when a high density of very fine coherent or semicoherent precipitates nucleate and grow. The unstable phases gradually evolved into stable ones. Cu additions to the ternary Al–Mg–Si system change the precipitation sequence and produce new phases Reference Holmestad, Bjørge, Ehlers, Torsæter, Marioara and Andersen4,Reference Marioara, Andersen, Stene, Hasting, Walmsley, Van Helvoort and Holmestad6 :
SSSS → clusters → GP zones → β″ + L + S + QC → β′ + Q′ → Q.
Among these precipitates, the needle-shaped β″ is often thought to be the most effective hardening strengthening phase responsible for the peak-hardening effect. Reference Panigrahi and Jayaganthan7–Reference Ehlers, Wenner, Andersen, Marioara, Lefebvre, Boothroyd and Holmestad9 Consequently, many experimental and theoretical works are focusing on this precipitate. Up to now, the generally accepted atomistic structure of β″ in Al–Mg–Si alloys is a stoichiometry of Mg5Si6, which was clarified originally by Zandbergen et al. Reference Andersen, Zandbergen, Jansen, TrÆholt, Tundal and Reiso10,Reference Zandbergen, Andersen and Jansen11
However, this precipitate configuration is questioned in some recent studies. For example, according to one recent investigation, Reference Ehlers12 the composition of β″ varies due to the substitution of Al at Mg and/or Si sites in the prototype Mg5Si6 model. In another investigation, by using advanced atom probe tomography (APT) and transmission electron microscopy, Sha et al. Reference Sha, Möller, Stumpf, Xia, Govender and Ringer8 proposed that significant quantities of Al have been detected in β″ needles in their study, and small dissolve clusters were also detected having weak Cu-enrichment. Moreover, they found that with increasing aging time, the Cu concentration of the GP zones increased, and β″ precipitates were observed with higher Cu enrichment than both the GP zones and dissolved clusters. Most recently, using APT and high-resolution energy-dispersive x-ray mapping, Li et al. Reference Li, Béché, Song, Sha, Lu, Zhang, Du, Ringer and Schryvers13 proposed that the β″ precipitates have an average β″ composition of 28.6 at.% Al–38.7 at.% Mg–26.5 at.% Si–5.17 at.% Cu in an Cu-containing Al–Mg–Si alloy. In the observation with high-angle annular dark field scanning transmission electron microscopy, their results revealed that Cu is preferential substituted for atoms in one column of each Si3 column pair, Al probably partially substitutes for these Cu-containing columns.
These experimental observations bring out the possibility of the substitution of Al and/or Cu at Mg and/or Si sites in the accepted prototype Mg5Si6 model. Since material properties are influenced by different precipitates, it is important to understand the structure of all the precipitates for the sake of alloy design. It is then activating scientific interest in the influence of the substitution on the mechanical properties and deformation mechanism.
Due to the unstable nature of these metastable phases, it is very difficult in preparation of suitable samples for observation and performing mechanical test. Instead, in the present study, we will use atomic simulation technique to investigate the influence of the substitution on the mechanical properties of the alloys. The obtained results will be compared with each other, as well as the results of the prototype Mg5Si6 model. Currently, there are many researchers using molecular dynamics (MD) method to study deformation behavior of nanomaterials. Yuan et al. Reference Yuan, Shan and Guo14 studied the tensile deformation behavior of Al nanowire at different temperatures and strain rates by MD simulation. Jian et al. used MD simulations to investigate the low-cycle fatigue fracture of metallic glass nanowires Reference Luo, Dahmen, Liaw and Shi15 and applied conventional uniaxial tension test on a slab-shaped sample with a strain rate of 2 × 10⁷ s−1 to study the tensile fracture of metallic glasses. Reference Luo and Shi16 Meanwhile we will focus on the displacement of some pivotal elements. Based on the previous simulations, MD method is used to construct the experimental composition of the precipitate to study the microstructural evolution, providing reliable results of deformed β″ during aging process. Atomeye software Reference Ju17 is adopted to give a visualizing microscopic process and generate MD snapshots.
II. METHODOLOGY AND CALCULATION DETAILS
A reliable MD simulation is dependent on the used atomic potentials.
Reference Wang and Liu18
Recently, Jelinek et al.
Reference Jelinek, Groh, Horstemeyer, Houze, Kim, Wagner, Moitra and Baskes19
developed a modified embedded atom method (MEAM) potential for Aluminum, silicon, magnesium, copper, iron, and their combinations. These potentials reproduce well a large body of elemental and binary properties from density functional theory (DFT) calculations at the temperature of 0 K and experimental results. Basic finite-temperature tests of the single element potentials and their alloy combinations were also performed. These successfully constructed MEAM potentials are adopted to describe the interaction among Al, Mg, Si, and Cu atoms in the present MD simulations. The readers are referenced to Ref. Reference Jelinek, Groh, Horstemeyer, Houze, Kim, Wagner, Moitra and Baskes19 for more details about the MEAM model. It is worth stressing here that, comparing to the original EAM method, where the electron density
 ${\overline \rho _{\rm{i}}}$
depends only on the bond length, the MEAM includes the angular dependence of the background electron density.
Reference Pilipenko, Natanzon and Emmerich20
This treatment makes it suitable for simulating not only metals and alloys with hexagonal close-packed (hcp), body centered cubic (bcc), face center cubic (fcc), and diamond cubic structures, but also covalently bonded materials like carbon and silicon. To carry out the uniaxial tension simulations of the ternaries and quaternaries alloys in this work, the potential function was tested for its accuracy in reproducing the lattice constants for prototype β″ and ternary U1-Al2MgSi2 phase in age hardening Al alloys. The crystal structure information of prototype β″ and ternaries U1-Al2MgSi2 phase in Al–Mg–Si system based on the experimental observation, together with the structural parameters calculated from the present MD calculation after relaxation, and the results from the first-principles calculations and other theoretical results published in literature are shown in Table I. In general, the lattice constants of β″-Mg5Si6 and U1-MgAl2Si2 nanowires constrained in Al matrix are in good accordance with the previous theoretical results and experimental data. The deviation from the experimental data is less than 2.25%, which demonstrates that the structures are reasonably built and the MEAM potentials are properly used.
Calculated and experimental lattice parameters of β″ and U1 precipitation.

Mon. = monoclinic.
The atomic simulations in this study are done with the open source code Large-scale Atomic/Molecular Massively Parallel Simulator (LAMMPS) developed at Sandia National Laboratory. Reference Plimpton21 The used time step is 1 fs (10−15 s). The structure relaxation is performed with two steps. The first step is in fixed number, volume, and temperature ensemble. 20 ps times are performed to reach energy equilibration. The second step is in fixed number, pressure, and temperature ensemble. 40 ps times are performed to reach pressure equilibration. Without the loss of generality, the simulation is relaxing and deforming with the Nose–Hoover thermostat to control the temperature at 100 K, Reference Berendsen, Postma, van Gunsteren, DiNola and Haak22 since this temperature is low enough to avoid large thermal fluctuations. Reference Kong, Shen, Proust and Ranzi23,Reference Vodenitcharova, Kong, Shen, Dayal and Hoffman24 A strain rate of 1 × 10⁸ s−1 is used in the present MD simulations. The whole part adopted periodic boundary condition is used to simulate the strain conditions. The crystal was set-up with a cubic orientation and a constant strain rate uniaxial tension along Z (001) direction, 2000 ps times are performed for samples without Al matrix constrained and 600 ps are performed for samples with Al matrix constrained.
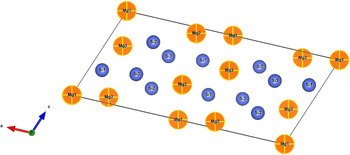
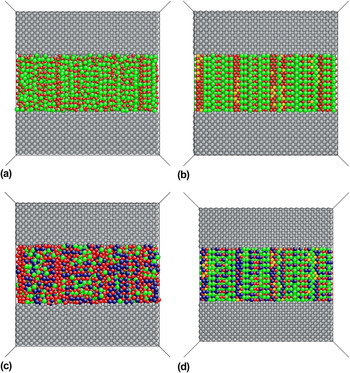
A unit cell of prototype β″ crystal containing 10 Mg atoms and 12 Si atoms is shown in Fig. 1. The β″ precipitates are proposed to be constrained in Al-matrix under experimental conditions. In the simulation models, boxes with the size of 100 Å × 100 Å × 100 Å, which are filled with Al atoms in face center cubic symmetry with a lattice constant of 4.05 Å are build. Needle like shaped β″ precipitate is simulated through constructing nanowire structures in the simulation boxes. Specifically, nanowires with the shape of cylinder (located at the middle of x and y plane with radius = 20 Å and length = 100 Å) are created along the z-direction in the formerly constructed boxes. A stoichiometry of Mg5Si6 with the shape of cylinder located at the middle of Al box is shown in Fig. 2(a), labeled as Al(Mg5Si6). Similarly, the β″ precipitate with Cu atoms that substitute Si3 sites is shown in Fig. 2(b), labeled as Al(Mg5Si5.43Cu0.57). The β″ precipitate with Al atoms substitute Mg1 sites is shown in Fig. 2(c), labeled as Al(Al3.14Mg1.86Si6). Using Cu and Al atoms substitute Si3 sites and Mg1 sites in the unit cell of Mg5Si6, respectively, a model with composition very close to experimentally reported 28.6 at.% Al–38.7 at.% Mg–26.5 at.% Si–5.17 at.% one Reference Li, Béché, Song, Sha, Lu, Zhang, Du, Ringer and Schryvers13 is constructed and labeled as Al(Al2.12Mg2.88Si5.02Cu0.98) [shown in Fig. 2(d)].
A unit cell of β″ precipitate, the atomic species are represented by different colors: Si (blue), Mg (yellow). The crystal equivalent points are noted as Si1, Si2, Si3, Mg1, Mg2, and Mg3.

Slices of the atomic configurations constrained in Al matrix used in the present MD simulations. (a) Al(Mg5Si6). (b) Al(Mg5Si5.43Cu0.57). (c) Al(Al3.14Mg1.86Si6). (d) Al(Al2.12Mg2.88Si5.02Cu0.98). The atomic species are represented by different colors: Al (blue), Mg (green), Si (red), Cu (yellow), and the gray balls represent Al atoms in matrix. The atomic fractions (at.%) for the cylinder nanowires are listed in Table I.

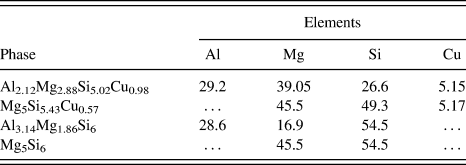
Without counting the number of Al atoms in Al matrix, chemical composition of the Al2.12Mg2.88Si5.02Cu0.98, Mg5Si5.43Cu0.57, Al3.14Mg1.86Si6, and the prototype Mg5Si6 are given in Table II.
Chemical compositions of investigated structures (atomic fraction, %).

III. RESULTS AND DISCUSSION
A. Mechanical properties with various compositions
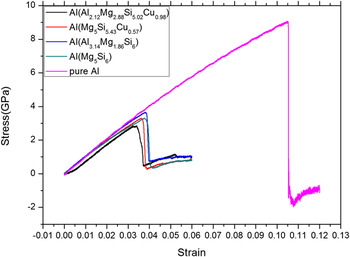
Figure 3 plots the stress–strain curves obtained by MD simulation of the tensile specimens of Al(Al2.12Mg2.88Si5.02Cu0.98), Al(Mg5Si5.43Cu0.57), Al(Al3.14Mg1.86Si6), and Al(Mg5Si6), together with pure aluminum. From the figure, one can find that all the curves have similar trends, that is, all increase with near linear slope to the maximum with a different peak value followed by a sharp drop at different strains. And the curve of pure aluminum shows a rapid growth to the maximum of 8.9 GPa at 0.105 strain. In fact, we know that Al is not that strong. The perfect crystalline sample in MD does not have dislocation sources and then they have almost a theoretical strength of a perfect crystal. After replace the composite by different precipitate cylinders in pure Al, then plasticity will occur at much lower stress and strain as shown in Fig. 3, because dislocations will be created at the interface. The reason may also lie in the used MEAM potential, which includes the angular dependence of the background electron density, making it is more difficult for plastic deformation appearing when compared with conventional EAM potential. It is worth to note that the curve of Al(Al2.12Mg2.88Si5.02Cu0.98) shows lower maximum stress (2.83 GPa) and smaller strain (0.033) compared to Al(Mg5Si5.43Cu0.57) (3.29 GPa, 0.036), Al(Al3.14Mg1.86Si6) (3.66 GPa, 0.038), and Al(Mg5Si6) (3.30 GPa, 0.038). From the initial slope of the curves, the Young's Modulus is calculated to be 94.32, 97.63, 94.14, and 91.87 GPa for Al(Mg5Si5.43Cu0.57), Al(Al3.14Mg1.86Si6), Al(Mg5Si6), and pure Al, respectively, a little larger than that of the experimental data of pure Al [70.5 GPa (Ref. Reference Martienssen and Warlimont25)]. It is noted that Cu atoms and Al atoms dissolved in the present simulated Al(Al2.12Mg2.88Si5.02Cu0.98) structure make relatively poorer mechanical performance. Why this composite substitution induced poorer ultimate strength, strain at max stress and Young's modulus? It is highly scientific and interesting to reveal the underlying mechanism.
Stress–strain curves of Al(Al2.12Mg2.88Si5.02Cu0.98) (black line), Al(Mg5Si5.43Cu0.57) (red line), Al(Al3.14Mg1.86Si6) (blue line), Al(Mg5Si6) (pale green line), and pure aluminum (magenta line) at 100 K.

B. Mechanisms of tensile deformation
Considering the constructions of the four β″ atomic models, since the simulation box is with the same size, and the nanowire is with the same diameter and location in the simulation box, the only difference among these four models lies in the interior of the nanowire, which is filled with Al(Mg5Si5.43Cu0.57), Al(Al3.14Mg1.86Si6), Al(Mg5Si6), and Al(Al2.12Mg2.88Si5.02Cu0.98), respectively. Obviously, the difference in Al matrix after tensile test rooted in these filled compounds.
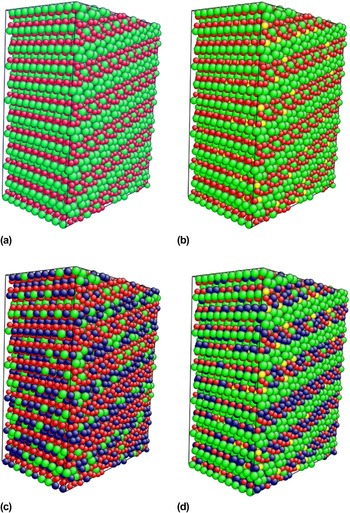
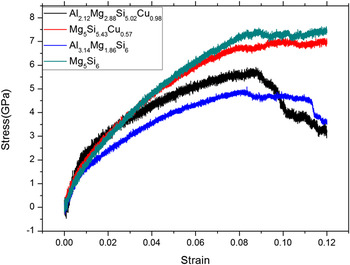
To gain a better insight from these four compounds, uniaxial tensile tests of these four β″ precipitates with various compositions unconstrained in Al-matrix are further performed. Figures 4(a)–4(d) demonstrate the atomic configurations of β″ precipitate with various compositions, labeled as Mg5Si6, Mg5Si5.43Cu0.57, Al3.14Mg1.86Si6, and Al2.12Mg2.88Si5.02Cu0.98, respectively. Figure 5 gives the obtained results of the stress–strain curves of them at 100 K. From Fig. 5, firstly, one can find that the curves initially undergo a short linear slope in the elastic range. Secondly, at around 0.008 strain, all of the models are entering yield stage. Thirdly, with strain further increasing, the stress increases and reaches a plateau at around 0.081 strain for Mg5Si6 and Mg5Si5.43Cu0.57. This is not likely when there are Al atoms dissolved in the β″ precipitate. From the stress–strain curves of Al3.14Mg1.86Si6, and Al2.12Mg2.88Si5.02Cu0.98, it is noted that after reaching the maximum stress point, the stress in Al2.12Mg2.88Si5.02Cu0.98 will drop to a low value. The overall effect with Al atoms dissolved in the precipitate is that the strength of the precipitate will decrease. In the case of Mg5Si5.43Cu0.57, there is no such drop in stress even after 1200 ps, indicating that Cu addition markedly increases the elongation.
Atomic configurations with a size of 40 Å (X) × 20 Å (Y) × 40 Å (Z) used in the present MD simulations. (a) Mg5Si6. (b) Mg5Si5.43Cu0.57. (c) Al3.14Mg1.86Si6. (d) Al2.12Mg2.88Si5.02Cu0.98. The atomic species are represented by different colors: Al (blue), Mg (green), Si (red), and Cu (yellow).

Stress–strain curves of Al2.12Mg2.88Si5.02Cu0.98 (black line), Mg5Si5.43Cu0.57 (red line), Al3.14Mg1.86Si6 (blue line), and Mg5Si6 (pale green line) at 100 K.

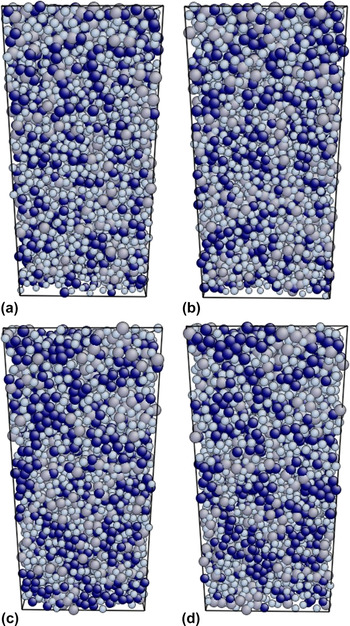
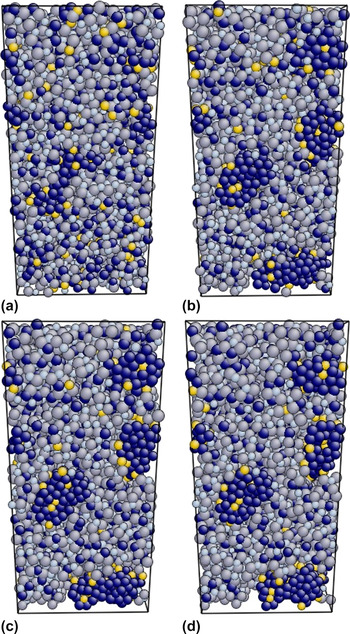
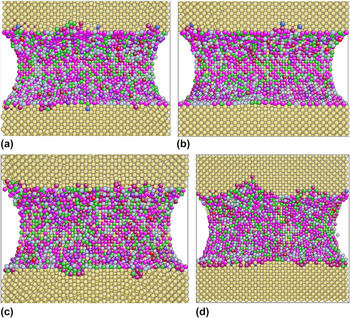
To investigate the underlying mechanism, atomic configurations of Al3.14Mg1.86Si6 and Al2.12Mg2.88Si5.02Cu0.98 at different deformation stages are shown in Figs. 6(a)–6(d) and Figs. 7(a)–7(d), respectively. From Fig. 6, one can find that, after 60 ps structure relaxation, the snapshot of the initial stage of tensile test [Fig. 6(a)] shows that all the atoms are vibrating around their equilibrate position. Snapshots at a further tensile loading of 290, 1700, and 2000 ps show similar sceneries. From Fig. 7, however, one can note that the behavior of the atoms in Al2.12Mg2.88Si5.02Cu0.98 is very different from that in Al3.14Mg1.86Si6. Specifically, although after 60 ps structure relaxation, all the atoms are similarly vibrating around their equilibrate position, the snapshots at a further tensile loading of 290, 900, and 1200 ps show that the existence of Cu atoms cause the Al atoms to aggregate to form cluster under tensile loading. We also check the snapshots of atomic configuration of Mg5Si5.43Cu0.57 at different deformation stages, but find no obvious aggregation.
(a)–(d) Snapshots of the atomic configuration of the Al3.14Mg1.86Si6 at various stages during uniaxial tensile loading. The atomic species are represented by different colors: Al (blue), Mg, and Si (gray).

(a)–(d) Snapshots of the atomic configuration of Al2.12Mg2.88Si5.02Cu0.98 at various stages during uniaxial tensile loading. The atomic species are represented by different colors: Al (blue), Cu (yellow) Mg, and Si (gray).

Obviously, these newly formed clusters through segregation of Al atoms in β″ precipitate will apply different stress fields on the Al matrix when compared with other three models. To describe such impact in more detail, coordination parameter (CP) has been calculated for the four β″ precipitate models and the obtained results are shown in Figs. 8(a)–8(d), respectively, where a coordination number is defined as the number of neighbor atoms with specified atom type(s) that is within the specified cutoff distance from the central atom. It is noted that where only the CPs for atoms in Al matrix are given, and the results for the atoms in nanowires are not shown for clarity.
(a)–(d) CP for the (a) Al(Mg5Si6), (b) Al(Mg5Si5.43Cu0.57), (c) Al(Al3.14Mg1.86Si6), and (d) Al(Al2.12Mg2.88Si5.02Cu0.98) nanowires constrained in Al matrix at a strain of 0.033, respectively, where only the parameters for atoms in Al matrix are given, and the results for the atoms in nanowires are not shown for clarity. Atoms with low values are colored blue, while atoms with high values are colored red.

In summary, Al atoms will segregate to form clusters if there are Cu atoms dissolved in β″ precipitate. Moreover, these newly formed clusters through segregation of Al atoms in β″ precipitate will apply different stress fields on the Al matrix, resulting relatively poorer mechanical performance of Al(Al2.12Mg2.88Si5.02Cu0.98). What makes this segregate of Al atoms when Cu atoms exist? The deeper physical origin needs further investigation.
C. Mechanism of clusters formation
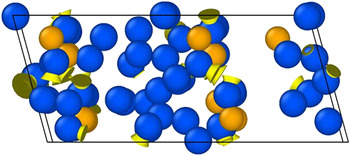
To reveal the underlying mechanism of cluster formation, ab initio molecular dynamics simulations (AIMD) based on DFT calculations have been performed using the Vienna ab initio simulation package (VASP). Reference Kresse and Furthmuller26 The Al2.12Mg2.88Si5.02Cu0.98 was modeled by a supercell of 2 × 3 × 2 geometry with the approximate experimental substitution and composition. The supercell is shaped as a parallelogram and represented by 264 atoms (61 of Al atoms, 108 of Mg atoms, 80 of Si atoms and 15 of Cu atoms) in the present study. The exchange-correlation effects have been described within the local density approximation of this AIMD simulation. Convergence tests indicated that 295 eV was a sufficient cutoff to achieve accurate of Al2.12Mg2.88Si5.02Cu0.98 systems. The used time step is 1 fs (10−15 s). The AIMD simulations were performed with a time step of 2000 at temperature of 100 K. To better understand the underlying mechanism of cluster formation, the so-called displacement vectors analysis in ovito Reference Stukowski27 software is used to reveal the detail of the cluster formation behavior in Al2.12Mg2.88Si5.02Cu0.98. This method calculates the displacement vector of each particle by subtracting its position in the reference configuration from the position of the particle in the current configuration. The calculated vectors are stored and visualized as arrows.
Figure 9 shows the displacement vectors of Al2.12Mg2.88Si5.02Cu0.98 after running 2000 steps at 100 K. The yellow conical arrows represent displacement of each Al atoms (blue) and Cu atoms (orange), Mg atoms, and Si atoms are not shown here for clarity. From Fig. 9 one can find that Al atoms deviate from their initial positions and tend to approach Cu atoms. Due to the very short running time of the AIMD, although the cluster formations are not observed directly, the tendency is in accordance with the present MEAM MD results.
Displacement vectors of Al2.12Mg2.88Si5.02Cu0.98 after run 2000 steps at 100 K. The yellow conical arrows represent displacement of each Al (blue) atoms and Cu (orange) atoms, Mg atoms, and Si atoms are not shown here for clarity.

It is noted that Al atoms cluster under deformation is not normal. The possible reasons for inducing such unusual clustering are complex. Beside the cluster tendency observed in AIMD, three more possible reasons are proposed. The first reason we think is that the used Al2.12Mg2.88Si5.02Cu0.98 model is unstable. It seems that the deformed system is amorphous and behaves in a liquid-like way, leading to segregation, unlike the Mg5Si5.43Cu0.57, Al3.14Mg1.86Si6, and Mg5Si6. The second reason we think is that the used simulation box will introduce interface energies between the box and its periodic images. These extra energies will make the Al2.12Mg2.88Si5.02Cu0.98 in a much higher energy state than 100 K, leading it to behave in a liquid-like way. The third reason we think is that it may come from the used MEAM potential. Although it is carefully tested for Mg, Si, Al, Fe, Cu, and their binary combinations, for multicomponent alloys, the used MEAM only checked elastic properties of one commercial alloy that has in total less than 2 at.% of solutes, being Al more than 98%. Applying to complex quaternary system is challenging for the used MEAM potentials.
Further MD simulations with MEAM potentials, together with AIMD simulations will be carried out in our next work to clarify this cluster formation phenomenon.
IV. CONCLUSIONS
Due to its peak-hardening effect, β″ precipitation has been the focus of many experimental and theoretical studies in quaternary Al–Mg–Si–Cu alloys under various conditions. In this study, we have performed a constant rate loading (108 s−1) uniaxial tension on samples by applying stress in the z axis of the crystal, using a MD simulation based on MEAM potential. The mechanical properties and deformation mechanism of β″ precipitate with various compositions constrained in Al-matrix and in the empty boxes are investigated.
Several conclusions are drawn as follows:
-
(1) It was found out that Al and minor Cu (0.57 at.% Cu atoms) composite substitution makes poorer mechanical performance in simulated Al(Al2.12Mg2.88Si5.02Cu0.98) structure when compared with other models.
-
(2) The mechanism of inducing this tendency occurs due to the segregation of Al atoms to form clusters when there are Cu atoms dissolved in β″ precipitate. And these newly formed clusters will apply different stress fields on the Al matrix.
-
(3) Displacement vectors study indicate that Al atoms deviate from their initial positions and tend to approach Cu atoms after running 2000 steps at 100 K in Al2.12Mg2.88Si5.02Cu0.98.
ACKNOWLEDGMENTS
The financial supports from the project of Innovation-driven plan in Central South University (Grant No. 2015CX004) and National Natural Science Foundation of China (Grant No. 51531009) are greatly acknowledged. Part of the first-principles calculations were carried out on the High Performance Computing Center of Central South University, China.