Introduction
Wildfire is a common occurrence in boreal Alaska and although part of a natural successional process it sometimes presents a natural hazard when human lives and property are at risk. Fire management agencies devote considerable resources to fire management and suppression. These agencies currently rely on the Canadian Fire Weather Index (FWI) System (Van Wagner Reference Van Wagner1987) for the assessment of the potential for wildfire. The FWI is a subsystem of the larger Canadian Forest Fire Danger Rating System (CFFDRS). The codes and indices of the FWI System are based solely on point source weather data collected daily in a sparse network across the state of Alaska.
FWI codes were developed in Canada and have been used in Alaska since the early 1990s.Although this system is essential to current practices and wildfire management, it is notwithout its shortcomings. One problem with the FWI System is the initialisation of someofthe codes and indices making up the system in early spring. Since the FWI system is completely weather-based, consisting of a daily accounting of weather parameters from spring to autumn, default start-up values are not always appropriate (due to high end of season drought and/or low winter precipitation). This is particularly an issue for the drought code (DC), which is an index of water stored in the soil and an indicator of seasonal drought and the amount of smouldering in deep duff layers (Jandt and others Reference Jandt, Allen and Horschel2005). The DC fuel layer is described as a deep compact organic forest floor layer (the lower duff layer), and has a 53 day lag period. The timelag determines the length of weather history covered by the index (Van Wagner Reference Van Wagner1987) and because it is so long, it is suggested to users of the FWI system to precede computation of the DC each spring by exercising a model of over-winter recharge of moisture in the forest floor (Lawson and Dalrymple Reference Lawson and Dalrymple1996). However, the winter precipitation data do not always exist, thus limiting this practice operationally. Instead a DC default value of 15 is typically used. When winter precipitationexceeds 200 mm, the DC default value of 15 works well because the duff layer has had a chance to saturate (Lawson and Dalrymple Reference Lawson and Dalrymple1996). However, this is not the case for much of Alaska, nor for much of western and northern Canada. Interior Alaska has a very dry climate with an average of about 300 mm of precipitation a year, and about half of that coming from snow. At Fort Greely Alaska weather station in Delta Junction, the 30 year average annual precipitation was 282 with fewer than 103 mm (snow water equivalent) falling as snow. The climate of the North American boreal forest biome ranges from dry with extreme annual temperature variations in the west (interior Alaska) to a relatively warmer, wetter maritime climate of eastern Canada (Bourgeau-Chavez and others Reference Bourgeau-Chavez, Brunzell and Kletzli2000, Bonan and Shugart Reference Bonan and Shugart1989). According to Stocks (Reference Stocks1979) adjustments to spring start-up values are only occasionally required in eastern Canada, but are commonly needed in drier parts of western and northern Canada (Alexander Reference Alexander1983).
A second problem with FWI is that while fuel types and drying conditions (day length, permafrost, decomposition rate, and soil type) vary across the North American boreal forest, the FWI moisture code calculations do not (Jandt and others Reference Jandt, Allen and Horschel2005). In Alaska scientists and resource managers have noted that there are mid-summer variations in measured moisture values that are not accounted for in the FWI system. Melting of some of the frozen layers later in the summer in both continuous permafrost and discontinuous permafrost areas may be a cause of increased moisture not accounted for in the weather-based system. Yetthis is a variable that cannot be easily measured as a weather parameter. A remote methodto capture a snapshot of the current moisture condition at a particular location would assist fire danger prediction by determining when a departure from the default DC is appropriate and what that number should be.
Recent research has been conducted to improve the prediction of wildfire potential in Alaska using satellite C-band (5.7 cm wavelength) synthetic aperture radar (SAR). SAR is sensitive to the moisture content of the features being imaged including vegetation and soils. The relationships between in situ soil moisture, C-band backscatter and fire danger codes have been the focus of intensive studies for several years at a variety of burned and unburned sites in interior Alaska (French and others Reference French, Kasischke, Bourgeau-Chavez and Harrell1996; Kasischke and others Reference Kasischke, Morrissey, Way, French, Bourgeau-Chavez, Rignot, Stearn and Livingston1995, Reference Kasischke, Bourgeau-Chavez and Johnstone2006; Bourgeau-Chavez and others 1999, Reference Bourgeau-Chavez, Nolan and Hyer2001, Reference Bourgeau-Chavez, Kasischke, Riordan, Brunzell, Nolan, Hyer, Slawski, Medvecz, Walters and Ames2006). Focus has been on recently burned (0–7 years) boreal forests because they allow moisture in the organic ground surface layer to be measured directly from a satellite sensor without interference of the forest canopy, and because they are a regular feature across the boreal landscape. Further, comparisons of unburned forests to adjacent burned forestshave revealed similarities in the temporal patterns of in situ moisture monitored throughout a fire season. Thus, soil moisture monitored from burned forests may be used as surrogates for unburned adjacent forests.
In our previous research, C-band (5.7 cm wavelength) satellite radar backscatter from a burn scar in Tok Alaska was correlated to the FWI system's DC calculated at Tok Area Forestry (Bourgeau-Chavez and others Reference Bourgeau-Chavez, Kasischke and Rutherford1999). This relationship exists because the radaris sensitive to the moisture of the features being imaged, and because the forest canopy has been removed exposing the ground layer for measurement by the satellite-based radar. The goal of the current research was to develop a generic algorithm relating backscatter to DC that had the potential of operational application to all of interior Alaska, where wildfire is most prevalent. We expanded on the initial research by including data from multiple years and multiple burned areas of interior Alaska for development of a robust yetgeneric algorithm. This algorithm would allow us to use backscatter from a burned area inspring to initialise the DC weather-based system and backscatter in mid-summer to calibrate the DC.
Since recent (0–7 years) fire scars exist intermittently across the interior landscape, this procedure is plausible for operational use. It does not require georectification of imagery, only knowledge of the general area, comparison to fire scar maps and knowledge of weather-station locations. It is a quick and easy method for initialising the DC, and also for calibrating it throughout the season. Further, these new data points derived from imaging radar can be used as additional point sources of information across the landscape in the absence of weather stations.
Background on fire weather index subsystem
The FWI subsystem of the CFFDRS used in Alaska and Canada is a bookkeeping system based solely on meteorological data for the assessment of fire danger. Rain, temperature, relative humidity, and wind are used to predict the moisture status of forest litter and duff as well as drought conditions that are then used to determine fire danger. The FWI components are based on daily noontime measurements of dry-bulb temperature, relative humidity, 10 m open wind speed and 24 hour accumulated precipitation. The approach was developedusing field experiments and extensive empirical analyses (Stocks and others Reference Stocks, Lawson, Alexander, Van Wagner, McAlpine, Lynham and Dube1989).
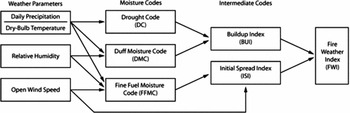
There are six components of the FWI system that individually and collectively account for the effects of fuel moisture and wind on the potential for fire ignition (Alexander and others Reference Alexander, Stocks and Lawson1996). Three of the codes are designed to estimate the moisture content in three distinct layers of soil (Jandt and others Reference Jandt, Allen and Horschel2005):
FFMC represents moisture in the litter material up to 2 cm in depth
DMC represents moisture in the upper 5–10 cm of duff material
DC represents moisture in the lower layers of duff, from 10–20 cm in depth
These codes are based on the accounting of daily precipitation and drying. FFMC is linked with wind to form the intermediate code ISI, while DC and DMC are linked to form the intermediate code BUI. Finally the BUI and ISI are linked to form one final index of firepotential, the FWI code (Fig. 1). Four codes (FFMC, DC, DMC and FWI) are used in tandem to estimate the potential for a fire to start. The FFMC has a time lag of 2/3 of day while DMC has a time lag of 15 days, and DC that of 53 days.
Diagram showing how the fire weather index system works.

Methods
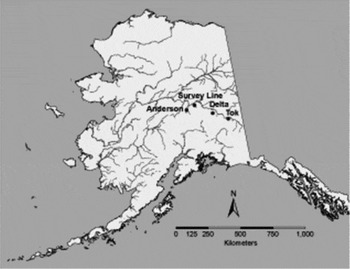
We built the model for predicting DC based on ERS-1 and ERS-2 SAR backscatter using data collected between 1992 and 2004 at the 1990 Tok burn, 2001 Survey Line burn and 1994 Gerstle River burn (located near Delta Junction) test sites (Fig. 2). Data from additional test sites (Donnelly Flats (also near Delta) and Anderson) were used for application and validation of the model.
Map of study areas

For this procedure as large an area as possible (approximately 3000 m x 3000 m) was randomly chosen within each burn scar for analysis. By choosing a large area within the burn that crosses over different site conditions and burn severity conditions (that is varying surface roughness and biomass conditions) the variation within an area is captured, thus allowing comparison between burns. Next all of the pixel values per test site were averaged for each date of image collection. These linear backscatter intensity values were then converted to dB using the formula:

For ERS-2 data processed by Alaska Satellite Facility (AFS), the data then needed normalisation because the ERS-2 sensor has been losing power (∼0.66 dB per year) over theyears but the ASF processor does not correct for the power loss. ASF references all data to 1998 so all data must be normalised with reference to 1998. In order to normalize the data reference is made to Meadows and others (Reference Meadows, Rosich and Santella2004) for offset values in dB.
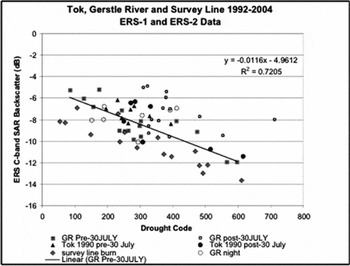
Next the DC values from the corresponding weather stations located within approximately 10 km were matched to the backscatter from the various image collection dates and analysed for correlations. The combined data from the three test sites are presented in Fig. 3. The Gerstle River (GR) test site is underlain by discontinuous permafrost and, as other sites underlain by permafrost, exhibits a shift in the relationship between ERS backscatter and DC mid- summer. The hypothesis is that this shift is due to increased mid-summer moisture due to frozen ground thaw that is not taken into account in the weather-based DC but is apparent in the SAR imagery. Because of this shift, the data displayed in Fig. 3 are sorted by pre-30 July and post-30 July for GR and for Tok (which is not underlain by permafrost) as comparison. The solid diamond points are from the Survey Line Burn, which as Tok, is permafrost-free. In this plot we also differentiated nighttime satellite overpass data for GR (open circles), but found no difference between night and daytime overpasses. It should be noted that time of collection has been found to be an issue with Radarsat data (Bourgeau-Chavez and others Reference Bourgeau-Chavez, Brunzell and Kletzli2000). There is no shift in data collected pre-30 July (solid triangles) in comparison to post-30 July (solid dots) at Tok for ERS-2, as isexpected.
Plot of DC vs. ERS C-band backscatter at the Gerstle River 1994 burn between 1995-2000, Tok 1990 burn between 1992-5, and the 2001 Survey Line fire from 2003-4.

For the final DC prediction algorithm (inversion of Fig. 3), we eliminated all post-30 July data from the permafrost site GR (open squares and circles representing post-30 July data of Fig. 3). The resulting model:

has a coefficient of determination of 0.64, standard error of 64.68, and p-value « 0.00001. Since this model was built using multiple test sites and multiple years of data it should be fairly robust within the interior of Alaska. To test the applicability ofthis model, it was exercised at three test sites using in situ moisture and rainfall as validation.
Application of SAR algorithm
Using the DC prediction algorithm, DC-start values were calculated in spring for independent test sites representing weather stations, including the Donnelly Flats 1999 burn (DF, located near Delta Junction) for the Fort Greely Weather Station and the Anderson burns (1991 Anderson Burned Spruce (ABS) and 2003 Anderson Clear Fire (ACF)) for the Nenana weather station. We also adjusted the 2005 FWI data with survey line imagery for the Fairbanks weather station. It should be noted that when in situ data are shown in the plots of this application section, the field measured volumetric moisture content has been converted to Drought Code for display purposes using the formula:

This equation was developed by Lawson and Darlymple (1996) for white spruce-moss forests in White Horse, Yukon, Canada to convert percent gravimetric moisture content (%GMC) to DC. A few equations have been developed for various sites across Canada to convert in situ moisture to DC. Since the White Horse location is most similar to interior Alaska spruce-moss forests, it was chosen for conversion in our research. To use equation 3 with our field measurements, which were collected as percent volumetric moisture content (VMC) using Campbell Scientific water content reflectometer probes (Garwood and others Reference Garwood, Riordan, Bourgeau-Chavez and Slawski2006), the VMC first needed to be converted to GMC using the bulk density (BD) of the soils. Unfortunately BD (gms of soil per unit volume) was calculated only for a subset of study locations, and all soil sample types were not represented. Therefore, we only present in situ data here for locations where BD was measured. While, in most cases, our in situ moisture represents a mean of 50 sample locations over a 200 m × 200 m area, only one or two BD samples were measured per site. Thus, caution must be exercised in interpreting the in situ moisture displayed as DC in the plots that follow. The purpose of displaying the in situ DC is to demonstrate the trends in moisture over the fire season. These trends are real, but the magnitude of the DC values may not be exact. Thus the plots of in situ DC may be shifted slightly up or down from where they should be.
Donnelly Flats
Using data over DF we adjusted the start values for DC at Fort Greely for the years 2000 to 2005. Analysis of this series of years allowed for the evaluation of the trends andpotential anomalies. It also allowed for the determination of limitations on capability as the fire scar ages from years 1 to 6 since burn. Since the procedure showed consistent results across years, we focus here on years 2000–2001 when the Alaska Fire Servicehad overwintered DC to calculate the initial start value instead of the default of 15, and years 2003–2004 when we collected a great amount of in situ moisture for validation.
In 2000 and 2001, the default DC value of 15 was not used at Ft. Greely. Instead Alaska Fire Service (AFS) had used methods to predict the start values based on the ending Drought Code (DC) value for the previous autumn, over-winter precipitation, the nature of the area (Chinook prone) and the nature of spring break-up. The following formula was developed by Turner and Lawson (Reference Turner and Lawson1978) to calculate over-winter DC:

where Qs = starting spring moisture equivalent of DC
Qr = final fall moisture equivalent of DC
P = winter precipitation in mm
a, b - user selected values set by regional fire weather authorities (see table 1 in Lawson and Dalrymple (Reference Lawson and Dalrymple1996).

where DCf is the final fall DC value.
Spring start value (DCs) can be calculated by

For comparative purposes we exercised the FWI computer program code with the default of 15 in spring as well as with the SAR-predicted start value and these are plotted together on the charts for 2000 and 2001.
In Delta Junction ‘Chinook’ winds often blow from the south, from the Alaska Range, and can bring + 50 ° F temperature readings in January-February, thus causing the area to be drier in springtime. The DF site is located in a discontinuous permafrost zoneof Delta Junction, and although field data show that the northern portion of this site isnot underlain by permafrost, we did observe a midsummer shift in the SAR vs. DC data indicating increased moisture at that time which is not associated with rainfall.
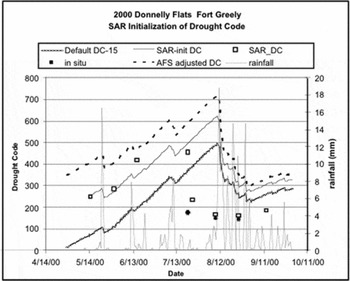
The plot of 2000 Fort Greely Weather Station DC shows the SAR-initialized DC curve as solid black (Fig. 4). All available ERS-2 SAR images from this year were used to obtain SAR-derived DC values throughout the summer using equation 2. The SAR-derived DC values are shown as open squares that overlay nicelyon the SAR-initialised DC curve until mid-summer when the SAR and in situ (black dots) show the DF site as getting wetter in late July. However, the weather-based DC curves continue to climb until mid-August when heavy rainfall causes the DC to drop. It should be noted that high DC values indicate dry conditions and lowDC indicates wet conditions. The crosshatched curve on this and subsequent plots shows the default 15 initialisation DC curve. Finally, the dashed line shows the Alaska Fire Service (AFS) adjusted (over-winter) curve. The SAR-initiated DC curve falls between the default and AFS adjusted curves in 2000.
Plot of seasonal drought code values for Fort Greely weather station, AK in 2000. Three DC lines are shown each having different spring initialisation values: the Alaska Fire Service (AFS) over-wintered DC, the DC-15 default and the SAR-initialized DC. Also plotted are seasonal rainfall and in situ 6 cm moisture converted to DC.

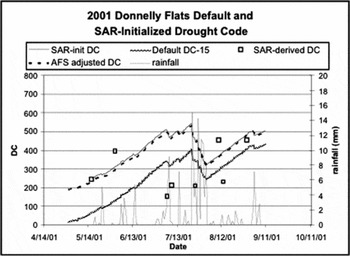
A similar plot for Fort Greely in 2001 (Fig. 5) shows that in that year the AFS adjusted curve is very close to the SAR-initialised DC curve with the default 15 initiated curve falling far below. This site is drier in the spring than the default implies, but according to SAR-predicted DC (open squares), the site gets wetter mid-summer due to factors other than just rainfall. It should be notedthat in situ data collected in 2001 was very limited so it was not used for validation. However, rainfall overlaid on the plot shows that on the SAR collection dates of 6, 9, and 25 July there were 3.2, 0.3 and 5.8 mm of rainfall, respectively. Also on 12 August, one day before the 13 August SAR collection 1.3 mm of rain fell, causing the SAR-predicted DC value to drop from over 400 to just over 200. Rain on the ground and vegetation surfaces can cause enhanced SAR backscatter that is not trulyreflective of the actual soil condition, so caution should be used on rain dates, especially if the rainfall is a small amount but the effects on the backscatter are large. This may be the case on 13 August.
Plot of seasonal drought code values for Fort Greely weather station, AK in 2001. Three DC lines are shown each having different spring initialization values: the Alaska Fire Service (AFS) over-wintered DC, the DC-15 default and the SAR-initialized DC. Also plotted are seasonal rainfall.

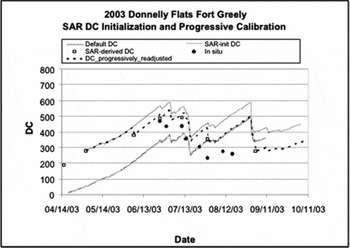
This research project began in 2003 and therefore we have much in situ data for validation of the trends in moisture on the ground. For thisyear we conducted a spring initiation of the Fort Greely DC using ERS SAR backscatter from the Donnelly Flats 1999 (Fig. 6), but also a progressive re-adjustment of the DC throughout the fire season using six dates of imagery from May to August. Fig. 6 shows the default DC curve (cross hatched) for the summer of 2003 and the new SAR initiated DC (solid black). The backscatter values from throughout the summer were used to predict DC and these values are shown as open squares on the plot. The SAR-initiated code appears to workwith respect to SAR-predicted DC values until mid-summer when the weather-based DC curve increases but the SAR-DC points show the DC is decreasing. In situ data (black dots) verifiy this decrease in DC (increase in moisture) midsummer. Donnelly Flats is in a discontinuous permafrost area and midsummer melting of the frozen ground may be causing the actual moisture to increase. The SAR-predicted DC values were then used progressively to readjust or calibrate the DC curve throughout the summer (dashed line). While this was somewhat helpful, the DC has a tendency to increase (lower moisture) as time progresses and only large rainfall events will cause it to drop. There are therefore sharp increases in DC that deviate from in situ trends.
Plot of seasonal drought code values for Fort Greely weather station, AK in 2003. Three DC lines are shown each having different spring initialisation values; the DC-15 default, the SAR-initialised DC, and the progressively calibrated with SAR-DC. Also plotted is in situ 6 cm moisture converted to DC.

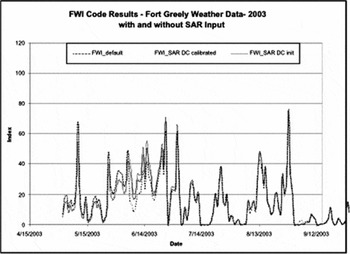
For the 2003 data, we tested to determine how much the DC-adjustments affected the FWI calculation. FWI is the final code in the Fire Weather Index System (Fig. 1). In Fig. 7, the 2003 fire season default FWI (grey cross hatched) is plotted against the FWI resulting from initialising the DC in spring with SAR (solid black), and the FWI resulting from progressively adjusting the DC using SAR throughout the fire season (black dotted line). At first the two SAR adjusted lines overlap, that is until another SAR image is used to adjust the DC on 5 June, at this point the adjusted curve goes from above the default to below, and the solid (spring adjusted only) curve stays above the default. The difference between the default and each of these SAR adjusted curves range between 0% and +/− 60% in the 2003 season. For the spring initialised DC, the percent difference in the final FWI code is high in the early season and becomes lower as the season progresses, butthe difference is always positive. However, with the progressive SAR adjustment, the percent difference is highly variable throughout the season, with both positive and negative differences. This demonstrates what a huge effect using SAR to adjust the DC would have on assessing the potential for wildfire. Since researchers and fire managers in Alaska have noted problems not only with spring start up values but also with deviations between observed fuel moisture and DC-values later in the summer, this represents a potentially viable method for calibrating the DC values periodically throughout the fire season.
Plot of FWI codes with DC-initialised using SAR, DC-initialised using the spring default of 15, and DC-progressively calibrated throughout the summer with SAR.

The application of spring initialisation of DC with SAR was repeated in years 2002 and2005 at DF with similar results. Thus, the utility of burned sites for initialisation of DC with SAR continues at least through year 5 post-fire as is demonstrated with the 1999 DF burn scar.
Anderson Alaska
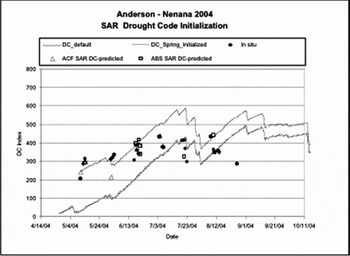
This SAR-DC initialisation procedure was next conducted at the Anderson burn sites (Fig. 8) to show repeatability of the process at a new site that is also underlain by discontinuous permafrost. Note that the weather station is located about 40 km away, so the correlation is likely lower than it was at DF.The 2003 Anderson Clear Fire (ACF) was used for initiation and insitu validation, and SAR-predicted DC values for the 1991 Anderson Burned Spruce (ABS) site are shown for comparison. Both test sites show comparable SAR results, and this permafrost site again shows the site as becoming wetter in midsummer rather than continuing along the weather based DC trend of increasing dryness (in situ black dots of Fig. 8). This demonstrates that burn scars as old as 13 years post-fire can be used for this procedure. It depends on how quickly a site revegetates post-burn and the resulting level of biomass.
Plot of seasonal drought code values for Nenana weather station, AK in 2004. Two DC lines are shown each having different spring initialisation values: the DC-15 default and the SAR-initialised DC. Also plotted is in situ 6 cm moisture converted to DC.

Survey Line Alaska
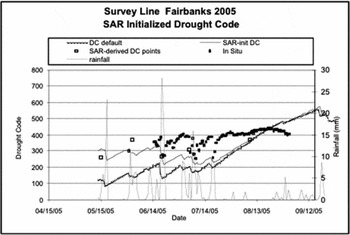
The final site that we applied this algorithm was the 2005 Survey Line Burn (Fig. 9). This site is permafrost free and the adjustment shows that initially the site is drier than the default DC of 15, but the site does not experience the midsummer increased moisture that the permafrost zone fires do. This new plot follows the SAR-derived DC better than the default, and the two lines merge in midsummer. This is the point after the 53 day lag when DC should correct itself. Also plotted on this chart are the 7 cm in situ data and rainfall. These show consistent trends between rainfall and drops in the in situ moisture and SAR-derived DC points. Also, it should be noted that based on the in situ moisture and SAR, the conditions appear drier here in midsummer (mid-July) than are predicted by the default DC or the springinitialised DC. This site may also benefit from progressive calibration of DC throughout the summer.
Plot of seasonal drought code values for Fairbanks weather station, AK in 2005. Two DC lines are shown each having different spring initialisation values: the DC-15 default and the SAR-initialised DC. Also plotted are seasonal rainfall and in situ 7 cm moisture converted to DC.

Comparison of soil moisture in neighbouring burned and unburned sites
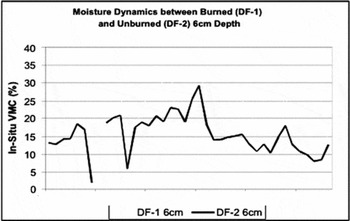
Since we are using burned sites to initialise and calibrate the fuel moisture code DC for evaluation of potential for fire in unburned sites, there is concern about potentially different drying dynamics occurring between the unburned and burned study sites which may skew the results. In order for burned sites to be used as surrogates for unburned sites, it is necessary to determine if the patterns of moisture of one follow the same trendsas the other. To investigate this, the moisture dynamics for a burned site at Donnelly Flats (DF-1) and a nearby unburned site (DF-2) were directly compared over the summers of 2003–2004. Site DF-1 had similar pre-burn conditions to DF-2 so it makes an ideal comparison. Soil moisture measurements were collected with a Hydrosense CS620 water contentreflectometer at 6 and 12 cm depths along two transects within the boundaries of each 200m × 200 m test site. 50 sample locations were measured at each depth along the two transects on each date corresponding to a satellite radar overpass. These samples were then averaged per depth per site per date. Results show high coefficients of determination for 6 cm (R2 = 0.84) and 12 cm (R2 = 0.93) burned versus unburned moisture measurements. The 6 cm results are displayed in the graph of Fig. 10.
Plot of 6 cm in situ moisture measured at burned Donnelly Flats site. DF-1 versus moisture at unburned DF-2 site.

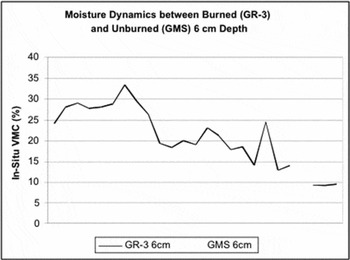
Next the same comparison between burned and unburned test sites was conducted at Gerstle River (Fig. 11), but pre-burn conditions were not the same at burned site GR-3 in comparison to the unburned GMS site. As depicted in Fig. 11, there is a clear relationship between the moisture dynamics of the burned and unburned sites with the two plotted lines following similar patterns. Results show high coefficients of determination at GR for6 cm (R2 = 0.85) and 12 cm (R2 = 0.93) burned versus unburned moisture measurements. There is more of an offset between the GR sites at both 6 and 12 cm depths than there was between the DF sites. At DF there was more of an offset at 6 cm than 12 cm moisture for the burned and unburned sites (Fig. 10). It is expected that the offset seen in the 6-cm plot (Fig. 10) is the result of a much thicker matte of organic material on the unburned site with that material being removed with the fire at the burned location. What is important is that the patterns of changing moisture are similar betweenthe burned and unburned sites, thus the patterns of drying and wetting are similar, although the absolute values are different.
Plot of 6 cm in situ moisture measured at burned Gerstle River site GR-3 versus moisture at unburned GMS site.

There are a few dates where the volumetric moisture is significantly different betweenthe burned and unburned sites. These areas may be the result of rain occurring while the samples were being collected, or sampling error.
Point source comparisons at permafrost and non-permafrost sites
The comparisons above relate averaged in situ moisture measurements over a 200 m × 200 m test area using the Hydrosense probe (CS620) inserted vertically into the soil (12 cm) and at 60° (6 cm). In 2000 and 2005 point source moisture monitoring instruments were deployed at several sites at multiple depths. In 2000 the CS615 instruments were used and inserted horizontally into the soil at a variety of depths. In 2005, CS625 probes were inserted vertically at various angles to obtainvarious depths. This section presents comparisons between burned and adjacent unburned point-location in situ moisture. Results reveal similarities in patterns of volumetric soil moisture, although the magnitude may be offset. Data presented here are from 2005 at Survey Line (non-permafrost) and from 2000 and 2005 at Gerstle River and Donnelly Flats (permafrost sites).
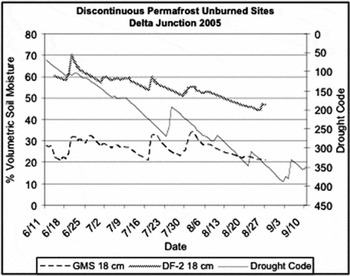
Comparisons of in situ moisture collected at two unburned sites at Delta Junction, Donelly Flats 2 (DF-2) and Gerstle Moderate Spruce (GMS) in 2005, show that these two unburned sites vary in hydrological moisture class with DF-2being much wetter (Fig. 12). However the patterns of increasing and decreasing moisture follow the same trend with an offset in themagnitude. The drought code is plotted (inverted) on the graph of Fig. 12 for comparison, although there is not a direct comparisonbetween the DC of the y-2 axis and % volumetric moisture of the y-1 axis. However, it is noticeable that the DC is not capturing all of the peaks and troughs of the in situ moisture and that it has a tendency to decrease continuallyover time, while the in situ moisture shows a less dramatic decline. This plot shows that even between neighbouring unburned black spruce sites, soil moisture conditions vary greatly.
Plot of % volumetric soil moisture collected at 2 depths for GMS and DF-2 for the summer of 2005.

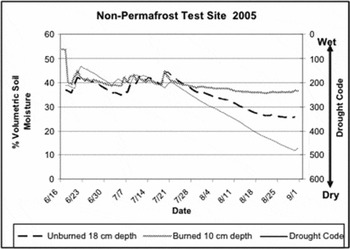
In Fig. 13, 2005 data from Survey Line, paired burned and unburned sites are compared against the DC calculated from a nearby weather station in Fairbanks. The DC is inverted here for comparison to % volumetric soil moisture. The DC increases with drier conditions. Also it should be noted that there is not a direct comparison between the y-1 axis VMS scale and the y-2 axis DC scale. For the non-permafrost Survey Line test area, DC becomes much drier in the later summer than either the 10 cm burned moisture or the 18 cm unburned.
Survey Line burned vs. unburned soil moisture at comparable duff layer depths for the summer of 2005. Probes were inserted vertically and each line represents 3 or 4 probes from different locations within the test site (200 m × 200 m area) averaged.

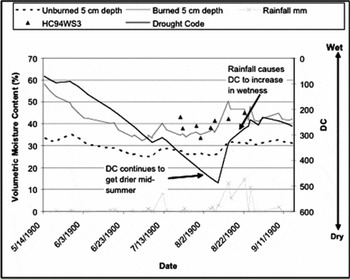
Lastly, plots of in situ moisture from the CS615 probes collected in 2000 at Gerstle River burned and unburned sites at 5 cm depth reveal similar trends in moisture over the summer, while DC continues to become drier until midsummer when high amounts of rainfall cause the DC to decrease (Fig. 14). These discontinuous-permafrost test sites are also possibly affected by midsummer frozen ground thaw. Data from the CS615 probe over the burned sites, shown as the solid grey line, agree with Hydrosense CS620 6 cm depth data (black triangles) from the same time period (although averaged over a distributed 200 x 200 m area rather than a single point, and from an adjacent but similar test site).
Plot of burned and unburned 5 cm depth soil moisture measured in 2000 at Gerstle River, AK. Probes were inserted horizontally, and each line represents a single probe.

Based on these in situ comparisons, the trends in moisture, for both permafrost and non-permafrost areas and both point source and distributed measurements, show similar trends between neighbouring burned and unburned study areas. This information allows the use of variations in burned site moisture conditions to be used as surrogates of surrounding unburned areas.
Summary
SAR data represent an innovative tool for improving the current weather-based fire danger system of interior Alaska by initialising the spring values of DC, calibrating the codes throughout the season and providing additional point-source data. This SAR approach for DC initialisation has been deemed extremely useful for the near term and in an operational sense by managers at the Alaska Fire Service. Since DC is a key variable used for predicting not only fire danger but also fire behaviour and severity (Alexander and Cole Reference Alexander and Cole1995), it is important that this variable beas accurate as possible. The methods presented here have been assessed based on in situ moisture and precipitation and are consistent across the test sites and years of data. The methods were tested on independent test sites, with the exception of the Survey Line 2005 analysis for Fairbanks Airport Weather Station, which represented one of the sites used in algorithm development, but the data were from a subsequent year.
An in situ investigation on how patterns of moisture observed in burned sites related to patterns of moisture in neighbouring unburned test sites was conducted and demonstrated strong correlations, although the magnitude is sometimes offset. It should be noted that the magnitude of moisture often shows an offset evenbetween two adja-cent unburned test sites and is more dependent on the soil type and sitedrainage. The FWI codes are designed to provide a general overview of fuel moisture conditions and the changes in moisture over time. Therefore using burned test sites is a viable method for observing such changes.
Although the research presented here focused on C-band VV-polarisation from ERS satellites, a similar procedure for C-band HH-polarization data from Radarsat and Envisat couldbe easily developed based on preliminary analysis of C-HH data and research by Abbott andothers (Reference Abbott, Leblon, Staples, MacLean and Alexander2006). Preliminary analysis of a small sample (n=9) of Radarsat Standard Beam-1 data over the 1990 Tok, Alaska and GR fires show a relationship of:

with a coefficient of determination of 0.65. Furthermore, Abbott and others (Reference Abbott, Leblon, Staples, MacLean and Alexander2006) found relationships between FWI codes and Radarsat C-band backscatter at all beams from burned jack pine (Pinus banksiana) forests of the Northwest Territories. Based on these recent results by Abbott and others (Reference Abbott, Leblon, Staples, MacLean and Alexander2006), the methods presented here should be transferable to northern and western Canada.
Acknowledgements
This research was funded under NASA grant NAS5-03113 from 2003 to 2006. The 2000 data collections were funded under an ASF IARC # NAS-98-129, with additional funding from Frostfire. The 2001–2002 data collections were funded under NASA data grant #NAG-51-0097. We would like to acknowledge the researchers who supported the field collection of allsoil moisture and biophysical data which were used in validation of the application of the SAR-algorithm for retrieving soil moisture; including James Slawski, Michael Medvecz, Seth Ames, Timothy Walters, Edward Hyer, Matt Nolan, and Eric Kasischke. We would also like to thank Suzanne Brunzell for her help in processing and analysing pre-2001 SAR imagery.