INTRODUCTION
Altitudinal gradients in species richness on tropical mountains provide tractable systems for studying ecological processes of global importance. These gradients are particularly useful because large changes in both climate and biota take place over relatively short distances (Lomolino Reference LOMOLINO2001, Malhi et al. Reference MALHI, SILMAN, SALINAS, BUSH, MEIR and SAATCHI2010). Moreover, altitudinal gradients are replicated many times (Fjeldså & Rahbek Reference FJELDSÅ and RAHBEK2012), allowing comparisons of faunal and floristic change at both regional and global levels.
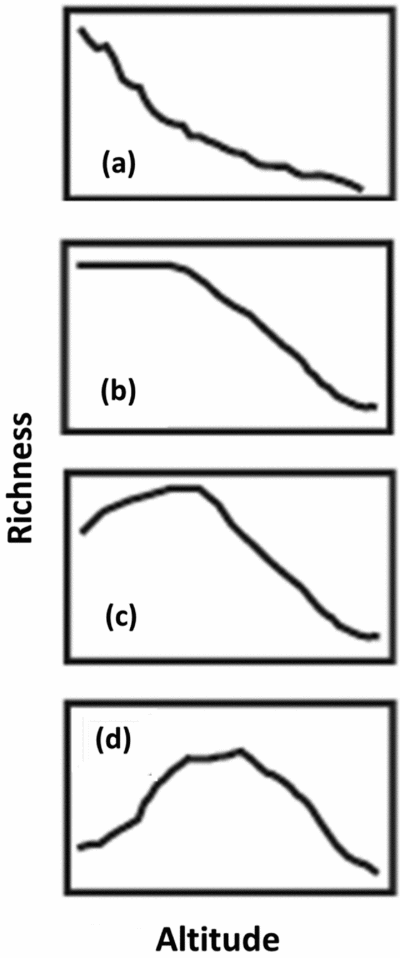
Although species richness was thought originally to decline with altitude, extensive review of global mountain data has shown the actual situation to be much more complex (Rahbek Reference RAHBEK1995). Several patterns occur regularly among mountains (Figure 1). In vertebrates, global patterns differ among taxa (McCain Reference MCCAIN2005, Reference MCCAIN2007, Reference MCCAIN2009, Reference MCCAIN2010), but the most common is a hump-shaped distribution indicating peak richness at low–middle altitudes (Rahbek Reference RAHBEK1995). Numerous explanations have been proposed for these patterns, including null models, such as the mid-domain effect (MDE) (Colwell et al. Reference COLWELL, RAHBEK and GOTELLI2005) and variability in abiotic and biotic factors (Lomolino Reference LOMOLINO2001).
Common patterns of the avian richness-altitude relationship, modified from McCain (Reference MCCAIN2009). These include: monotonic decline in richness (a), low-altitude plateau followed by a monotonic decline (b), hump-shaped decline with a low-mid-altitude peak (c) and symmetrical mid-altitude peak (d).

In addition to richness, another important altitudinal-gradient measure is species turnover. Hump-shaped richness peaks are often assumed to correspond to areas of community overlap or turnover (Lomolino Reference LOMOLINO2001). However, McCain & Beck (Reference MCCAIN and BECK2015) found that richness and turnover peaks seldom coincide in vertebrate communities. However, a hypothesis based on faunal overlap predicts that on a mountain with distinct lowland and montane communities, altitudinal range midpoints will be bimodally distributed, reflecting the existence of each group, and that richness of the lowland group will decline monotonically with altitude (Beck & Chey Reference BECK and CHEY2008). Where the two altitudinal groups overlap, a hump of species richness will occur.
In view of these issues, we set out to survey avian communities using consistent quantitative methods along primary-forest gradients on three mountains on Borneo. Borneo is perhaps the most important centre of rain-forest species diversification in insular South-East Asia (de Bruyn et al. Reference DE BRUYN, STELBRINK, MORLEY, HALL, CARVALHO, CANNON, VAN DEN BERGH, MEIJAARD, METCALFE and BOITANI2014, Sheldon et al. Reference SHELDON, LIM and MOYLE2015), and its forests are also changing rapidly due to immense pressure from logging and plantation development (Wilcove et al. Reference WILCOVE, GIAM, EDWARDS, FISHER and KOH2013). Despite Borneo's regional importance and the threats facing its habitats, quantitative surveys of primary-forest birds on the island are relatively few; almost all are focused on lowland forest disturbance at Danum Valley, Sabah (Edwards et al. Reference EDWARDS, LARSEN, DOCHERTY, ANSELL, HSU, DERHÉ, HAMER and WILCOVE2011, Lambert Reference LAMBERT1992), and none examines montane gradients. Indeed, of 78 total avian altitudinal-gradient data sets used in the meta-analysis of McCain (Reference MCCAIN2009), only nine are from South-East Asia, including one each from Sumatra, Java and Borneo. However, the last three derive not from surveys but only from altitudes gleaned from a field guide (MacKinnon & Phillipps Reference MACKINNON and PHILLIPPS1993). No publications based on quantitative surveys of altitudinal variation in bird species occurrence exist from any of the Greater Sunda Islands, although surveys have been conducted on Mt Kinabalu (Harris et al. Reference HARRIS, YONG, SHELDON, BOYCE, EATON, BERNARD, BIUN, LANGEVIN, MARTIN and WEI2012).
Here we use avian point counts on three Bornean mountains to quantify patterns of avian species richness, turnover and community composition along altitudinal gradients. With these data we test several hypotheses: (1) bird species richness peaks at an intermediate altitude consistent among mountains; (2) the richness and turnover patterns fit predictions of the MDE; and (3) species composition is similar among the mountains for a given altitude.
METHODS
Study sites
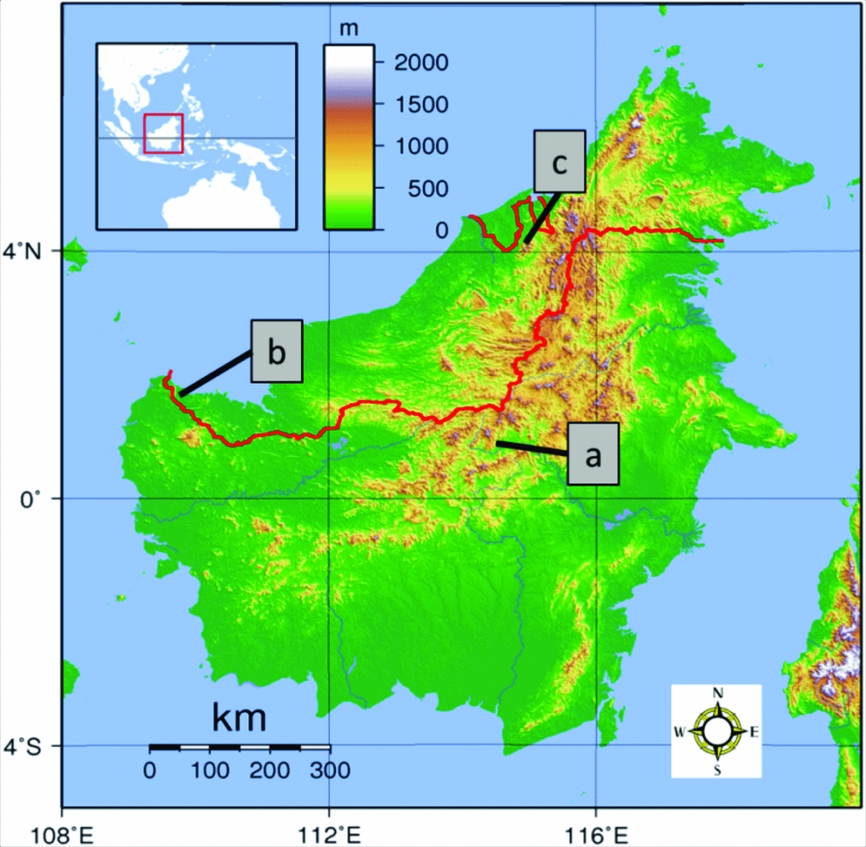
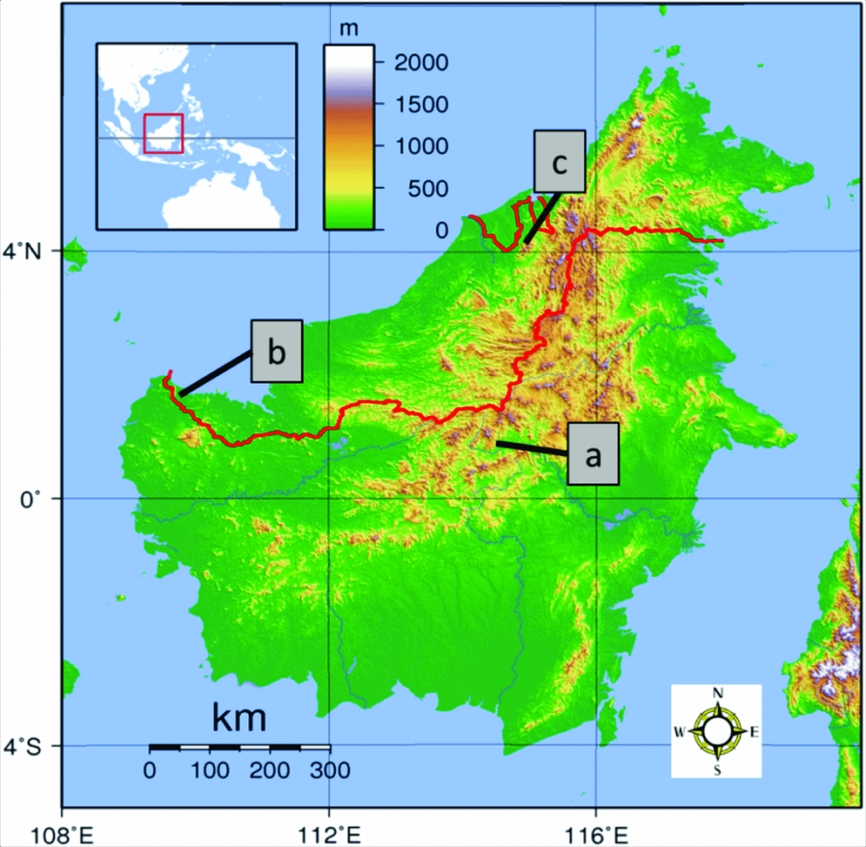
The island of Borneo consists primarily of coastal lowlands surrounding an interior mountain chain that runs from the north-east to the south-west (Figure 2). This chain comprises mountains mainly below 2000 m, with only a few reaching 2400 m and one, Mt Kinabalu, rising to 4096 m. There are also a few isolated mountain ranges and volcanoes of low stature. The central mountain chain, with its larger, more connected mountains hosts a larger complement of montane bird species (Banks Reference BANKS1952). For surveys, we selected three mountains that differ in size, isolation from the main mountain chain, and distance from the coast to compare patterns of species richness and altitudinal distribution (Figure 2).
Location of study sites on Borneo. Mt Topap Oso in East Kalimantan, Indonesia (a), Mt Pueh in western Sarawak, Malaysia (b), and Mt Mulu in eastern Sarawak (c).
Mt Topap Oso (0.929°N, 114.206°E) in East Kalimantan, Indonesian Borneo, is a remote 1450-m peak in the central mountain chain in an area where most peaks range from 1200–1450 m. Forest on its lower slopes (below 600 m asl) has been disturbed by shifting agriculture, but above this altitude primary forest is intact. We reached the mountain from the villages of Naha Silat and Long Apari in the headwaters of the Mahakam River and conducted point counts at 600, 800, 1000 and 1200 m asl from June to November 2012 on the western slopes of the mountain, as well as on the southern slopes of a sister peak (referred to as Mt Baring Uning on some maps) connected by a long ridge (0.858°N, 114.150°E). These mountains have never been surveyed for birds and are representative of remaining primary montane forest in Borneo.
Mt Pueh (1.721°N, 109.669°E) is a 1550-m mountain in far western Sarawak, Malaysian Borneo. It sits only a few kilometres from the coast, and is separated from the island's central mountain chain by about 300 km of lowlands and isolated smaller peaks. Several montane bird species that are present on mountains of similar size connected to the central mountain chain are absent from Pueh, probably due to its isolation (Banks Reference BANKS1952, Chua et al. Reference CHUA, SMITH, BURNER, RAHMAN, LAKIM, PRAWIRADILAGA, MOYLE and SHELDON2017, Manthey et al. Reference MANTHEY, MOYLE, GAWIN, RAHMAN, RAMJI and SHELDON2017). Pueh has stunted montane forest at its summit, and thus displays the telescoped vegetational zones sometimes observed on coastal mountains (Bruijnzeel et al. Reference BRUIJNZEEL, WATERLOO, PROCTOR, KUITERS and KOTTERINK1993). It is also home to one of Borneo's montane endemics, the mountain black-eye (Chlorocharis emiliae), a sky-island species that was rediscovered on Pueh only recently (Ramji et al. Reference RAMJI, MIN, RAHMAN and RAHMAN2012). Its presence on Pueh is probably related to the small patch of ericaceous scrub at Pueh's summit. Parts of our study area on Pueh were selectively logged in the past with tractors up to 900 m asl and by helicopter at higher altitude. We conducted point counts at 600, 800, 1000 and 1200 m asl from June to August 2013. As on Mt Topap Oso, we limited our surveys to altitudes at and above 600 m asl to avoid shifting cultivation plots that have replaced forests.
Mt Mulu (4.045°N, 114.929°E) is Borneo's fifth highest mountain at 2376 m, located in Sarawak near its border with Brunei and the Malaysian state of Sabah. Almost all of Borneo's montane bird species inhabit Mulu, including many endemics (Burner et al. Reference BURNER, CHUA, BRADY, VAN ELS, STEINHOFF, RAHMAN and SHELDON2016). The mountain is the central feature of Mt Mulu National Park and as such is covered by primary forest from near sea level to the summit. Only in the floodplain at the mountain's base (~50 m) has the forest been selectively logged. Mulu is probably the only site in Borneo outside of Brunei where a complete primary-forest gradient can be found. We accessed Mulu via the summit trail, which is maintained by the Park for tourists, and conducted avian point counts at 50, 300, 600, 900, 1200, 1500 and 1800 m asl from June to September of 2014. Most of our analyses in this paper are focused on Mt Mulu because of its intact forest gradient and the completeness of our survey range.
Survey methods
Avian communities were surveyed at point locations spaced every 150–200 m along transects at each sampled altitude. Counts consisted of 10–12-min (Mt Topap Oso and Mt Pueh) or 6-min (Mt Mulu) audio recordings using a Marantz digital recorder and Sennheiser microphone for later species identification. Count length was shortened on Mulu to allow time for additional replicates at each survey point. A truncated data set that reduced all Topap Oso and Pueh surveys to 6 min produced similar richness estimates, so we retain the full data set in this paper. Using audio recordings allowed more thorough consideration of the many bird sounds in this species-rich environment (Haselmayer & Quinn Reference HASELMAYER and QUINN2000). Species observed during the count were also noted. Points on Topap Oso were surveyed only once each, but points on Pueh and Mulu were sampled three to four times each, usually within a few days of the first visit (MacKenzie et al. Reference MACKENZIE, NICHOLS, LACHMAN, DROEGE, ROYLE and LANGTIMM2002). At each altitude on each mountain, 20–70 unique points were surveyed depending on time available and difficulty of access. Unrecognized recorded vocalizations were identified by Andrew Siani, an expert on Malaysian bird songs. At each point, time of day, altitude, weather, latitude and longitude, as well as habitat data were recorded. Counts were conducted from 06h00 to 10h30 solar time, and only when not raining.
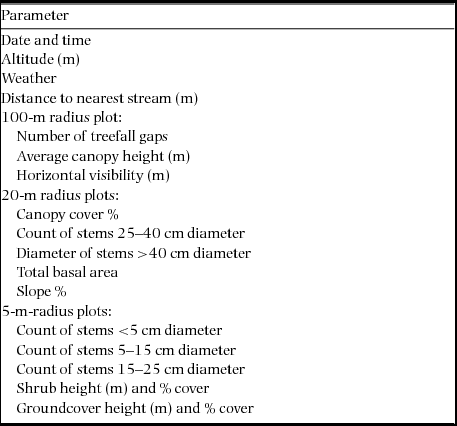
Habitat parameters were recorded for each point using the methods of Sheldon et al. (Reference SHELDON, STYRING and HOSNER2010), and were measured outside the morning survey period (Table 1).
Habitat and survey parameters measured at each avian point count for inclusion in ordinations. Measurements were taken within plots of three sizes (100-m radius, 20-m radius, 5-m radius).

Data analysis
Turnover is a measure of difference in species composition between two altitudes. Nestedness (Baselga Reference BASELGA2010) is the extent to which one community is a subset of a larger community (i.e. at an adjacent altitude). To address hypothesis one (patterns of species richness), richness at each location was estimated using the Chao2 estimator in EstimateS, which allows comparison between multiple sites that differ in sampling effort. Turnover was estimated using Simpson's dissimilarity, and turnover and nestedness were calculated using visual basic scripts (available at http://spot.colorado.edu/~mccainc/simulation_programs.htm) from McCain & Beck (Reference MCCAIN and BECK2015).
To address hypothesis two (fit to MDE predictions), empirical results from Mt Mulu were compared to the three null models of McCain & Beck (Reference MCCAIN and BECK2015): (1) the hard boundaries mid-domain effect (MDE), in which species altitudinal ranges are constrained to lie entirely within the gradient sampled; (2) the partially bounded model, in which ranges are constrained to fit within a gradient that is expanded by 20% on each end; and (3) an unbounded model, in which ranges are placed randomly on an altitudinal gradient twice as large as the sampled gradient. Fit to these models was assessed using R-squared values. The MDE model was not used for Mt Topap Oso and Mt Pueh due to the limited altitudinal sampling range.
To test the faunal overlap hypothesis on Mulu, empirical range midpoints were calculated for each species (max altitude – min altitude) and the results plotted to look for evidence of distinct groups of lowland and montane species (Beck & Chey Reference BECK and CHEY2008). Species with five or more detections were then designated as lowland if 75% of observations occurred below the peak turnover point (as calculated above), and montane if 75% of observations occurred above this point. All other species were considered mid-altitude/widespread.
To address hypothesis three (comparisons among the three Bornean mountains), we tested and compared differences in community composition between altitudes and mountains, and tested the correlation between habitat parameters and differences in these communities, using non-metric multidimensional scaling (NMDS) via the metaMDS function in the package Vegan in R. The SIMPER function was used to calculate each species’ contribution to dissimilarity between sites. All points from all mountains were ordinated together in a single data set to examine inter- as well as intra-mountain differences. The number of relevant ordination axes was assessed using a measure of stress from the ecodist package (Goslee & Urban Reference GOSLEE and URBAN2007) in R.
Multiple Response Permutation Procedure (MRPP) was performed using the function mrpp in Vegan to test for differences among altitudinal groups. This procedure tests whether a significant difference occurs between communities at two or more points. It compares both differences of location in ordination space (means) and differences of spread or variation.
RESULTS
Avian surveys
We conducted 1088 point-counts at 527 points over the course of this study, including 238 locations on Topap Oso (one visit per point), 114 on Pueh (x = 2.52 visits per point) and 175 on Mulu (x = 3.22 visits per point) based on difficulty of access and time available. Points were divided approximately equally among the four altitudes on Topap Oso and Pueh, and among the seven altitudes on Mulu. From these counts, 11,152 species presence records were obtained, representing 213 species (Appendix 1).
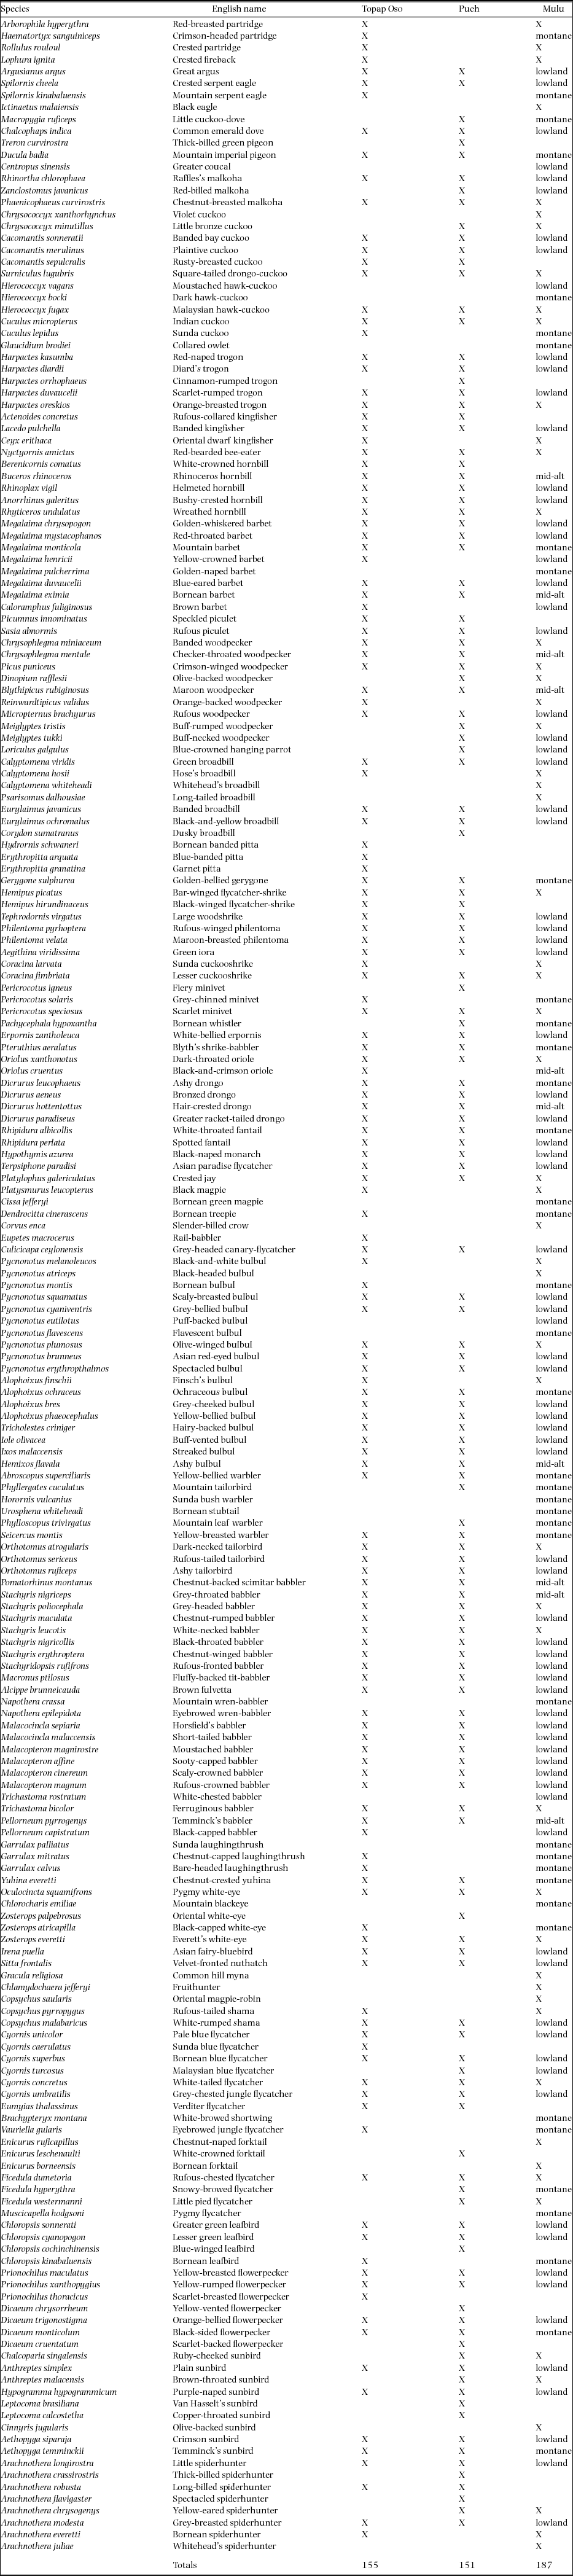
We detected a total of 187 species on Mulu, followed by 155 species on Topap Oso, and 151 on Pueh. Of the 213 total species, 115 were found on all three mountains; 7 occurred on Pueh and Topap Oso only, 16 Pueh and Mulu only, and 27 Mulu and Topap Oso only. Mulu had the largest number of unique species, 29, followed by Pueh with 13 and Topap Oso with 6. However, only 15 of the 29 unique species on Mulu were detected between 600 m and 1200 m, corresponding to the survey range on the other two mountains. Of 52 distinctly montane or submontane species detected, all of which were found on Mulu, 33 were found on Topap Oso but only 24 on Pueh.
Richness, turnover and nestedness
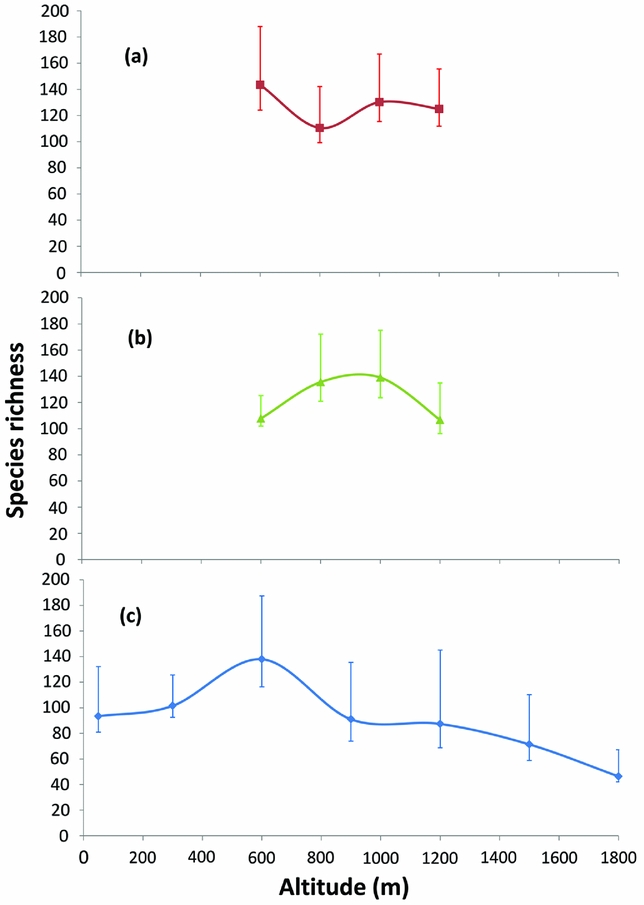
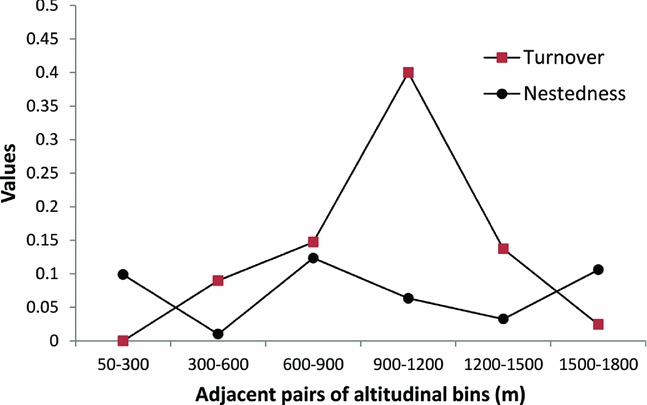
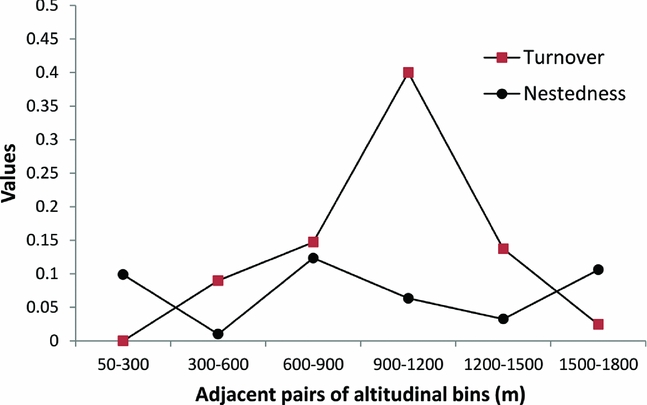
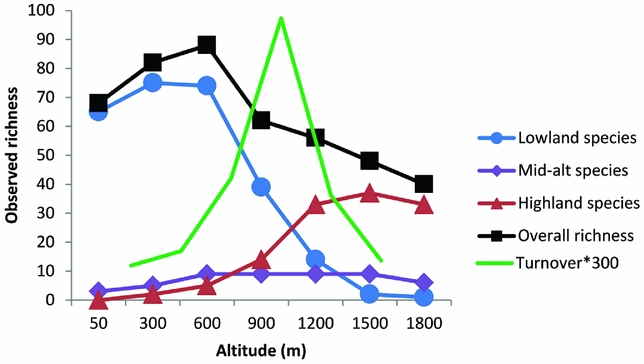
Species richness on Mulu increased with altitude until 600 m, where it peaked and thereafter declined to less than a third of the peak-value at 1800 m (Figure 3). Species turnover on Mulu showed a single peak (0.40) between 900 m and 1200 m (Figure 4), hundreds of metres above the richness peak at 600 m. Nestedness (Figure 4) was highest between 600 m and 900 m (0.12). A lower nestedness value between 900 m and 1200 m (0.06) was consistent with the higher turnover between these altitudes, and helped explain why estimated richness can decline so rapidly from 600 m (138 species) to 900 m (91 species) without a correspondingly high turnover rate; the 900-m community was to some extent just a subset of the community at 600 m. Turnover was high between 900 m and 1200 m, corresponding to the low nestedness value.
Avian species richness by altitude on three Bornean mountains. Richness based on Chao2 estimator from EstimateS, with 95% confidence intervals: Mt Topap Oso (a), Mt Pueh (b) and Mt Mulu (c).
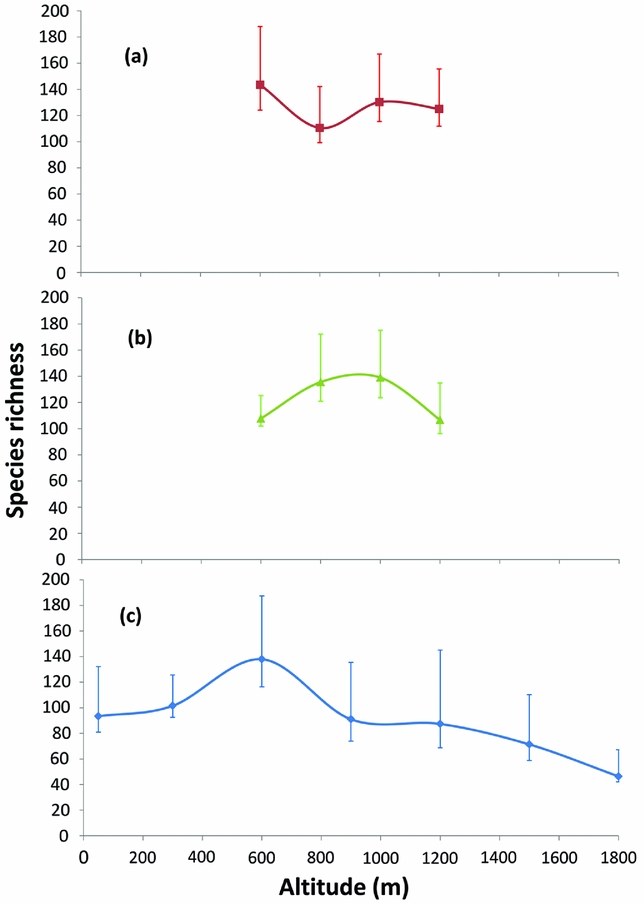
Avian species turnover and nestedness between adjacent pairs of altitudinal bins on Mt Mulu in Sarawak, Malaysian Borneo. Turnover measures differences in species composition between altitudes, while nestedness indicates the extent to which the species at one altitude are a subset of those occurring at an adjacent altitude. The point of maximum turnover is several hundred metres above the point of maximum richness (600 m).
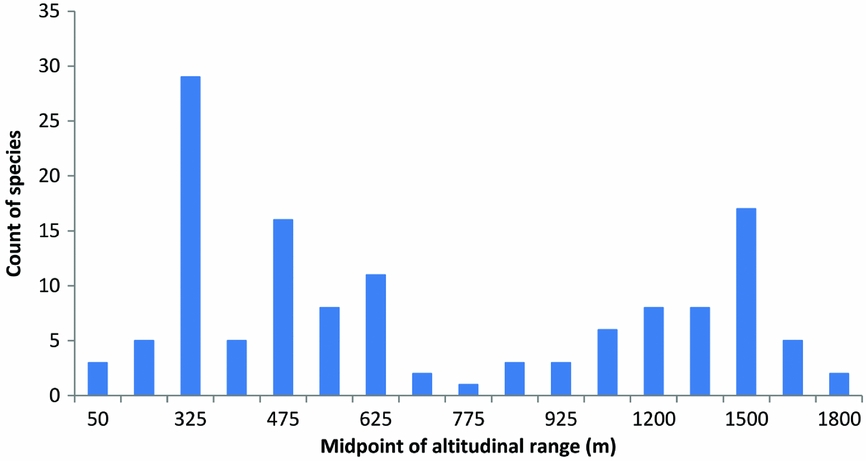
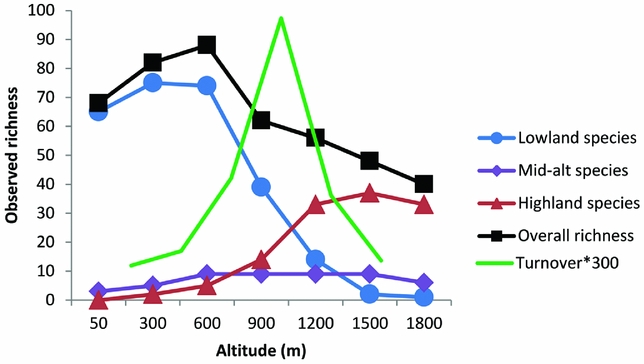
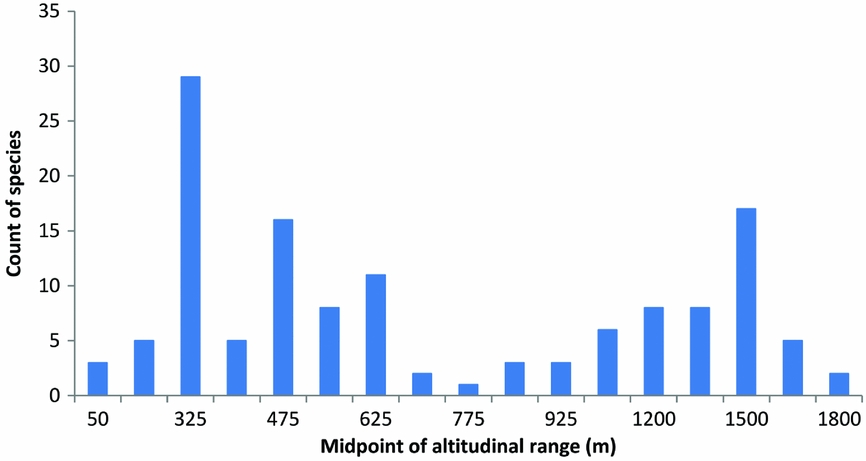
Species ranges on Mulu did not occur along the gradient at random. Instead, range midpoints were bimodally distributed according to whether the species were members of the lowland or montane community (Figure 5). Of 132 species on Mulu with five or more detections, the majority (92%) belong to one of the two groups, as defined by having >75% of their detections either below (lowland) or above (montane) the altitude of maximum turnover between 900 and 1200 m (Appendix 1). Those not fitting either group (8%) were considered mid-altitude species. The richness patterns of these three groups combined to form the low-to-mid-altitude hump in species richness (Figure 6).
Frequency of midpoints of species’ altitudinal ranges on Mt Mulu in Sarawak, Malaysian Borneo. The bimodal distribution provides support for the existence of distinct lowland and montane groups of avifauna.
Empirical avian species richness and turnover by altitude on Mt Mulu. Richness of lowland, mid-altitude, and montane communities combine to produce an overall richness pattern with a low-mid-altitude richness peak similar to the estimated total richness curve. Turnover (which is scaled up by a factor of 300 for plotting) peaks in the interval between 900 and 1200 m, the interval in which lowland species richness steeply declines while montane species richness increases.
Richness patterns on the parts of the gradient that were sampled were less obvious on Pueh and Topap Oso (Figure 3). Richness on Topap Oso may also peak at 600 m. Pueh appeared to have a mid-altitude richness peak at a higher altitude than Mulu and Topap Oso, i.e. 800 m to 1000 m, and would certainly fit either the low-mid or mid-altitude peak pattern. Species turnover on Topap Oso and Pueh was on average much lower than on Mulu (peaking at 0.11 and 0.14, respectively, compared with Mulu's maximum of 0.40). Nestedness was highest on Topap Oso and Pueh between 800 m and 1000 m (0.10 and 0.12, respectively).
MDE and other models
For patterns of richness, turnover and nestedness on Mulu fit to expectations of the three null models was generally low. Correlation with predictions of the MDE, soft boundaries, and unbounded models was especially low for richness (R2 = 0.11, 0.13 and 0.21, respectively) and nestedness (R2 = 0.02, 0.25 and 0.04, respectively). Observed turnover fitted the null expectations of the MDE and soft-boundary models somewhat better (R2 = 0.35 and 0.47, respectively), but did not fit the unbounded model (R2 < 0.01). Over half of the empirical turnover and nestedness values fell outside the 95% confidence intervals of each null model. The incompleteness of the altitudinal range sampled on Topap Oso and Pueh made the null model simulations less informative because data were available from only three altitudinal intervals in the middle of the mountains.
Community composition
The three mountains we sampled shared many species and several of these were common on all three mountains, including the golden-whiskered barbet (Megalaima chrysopogon), Bornean barbet (Megalaima eximia), blue-eared barbet (Megalaima duvaucelii), grey-headed canary-flycatcher (Culicicapa ceylonensis), brown fulvetta (Alcippe brunneicauda) and chestnut-backed scimitar babbler (Pomatorhinus montanus). Additionally, each mountain had a few common species of its own that were not nearly so common on the other mountains. These included the yellow-bellied warbler (Abroscopus superciliaris), grey-throated babbler (Stachyris nigriceps) and wreathed hornbill (Rhyticeros undulatus) on Pueh, and the chestnut-rumped babbler (Stachyris maculata), Asian fairy-bluebird (Irena puella) and rufous-crowned babbler (Malacopteron magnum) on Topap Oso. Most of the examples from Mulu were upper montane species that rarely occur at altitudes sampled on the other mountains (e.g. Blyth's shrike-babbler, Pteruthius aeralatus, and chestnut-capped laughingthrush, Garrulax mitratus), but also included the low-mid-altitude fluffy-backed tit-babbler (Macronus ptilosus).
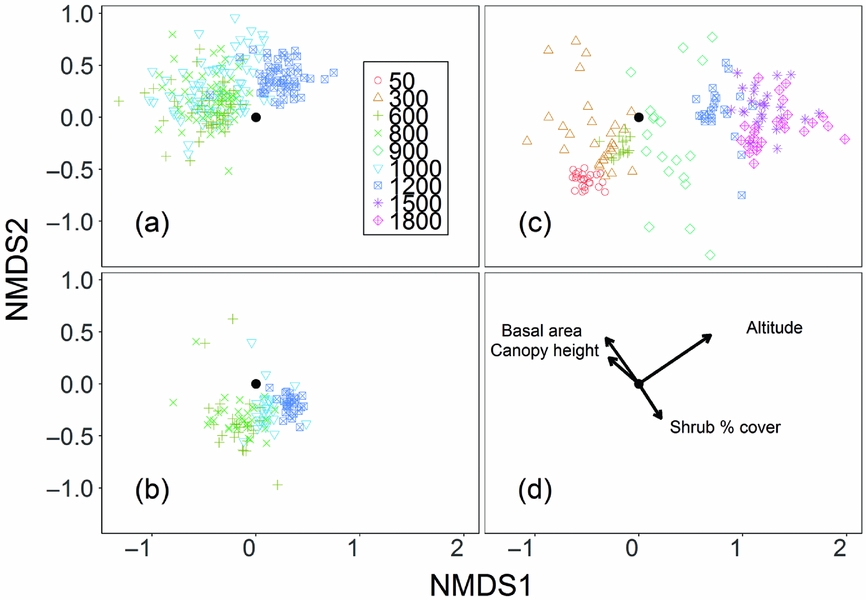
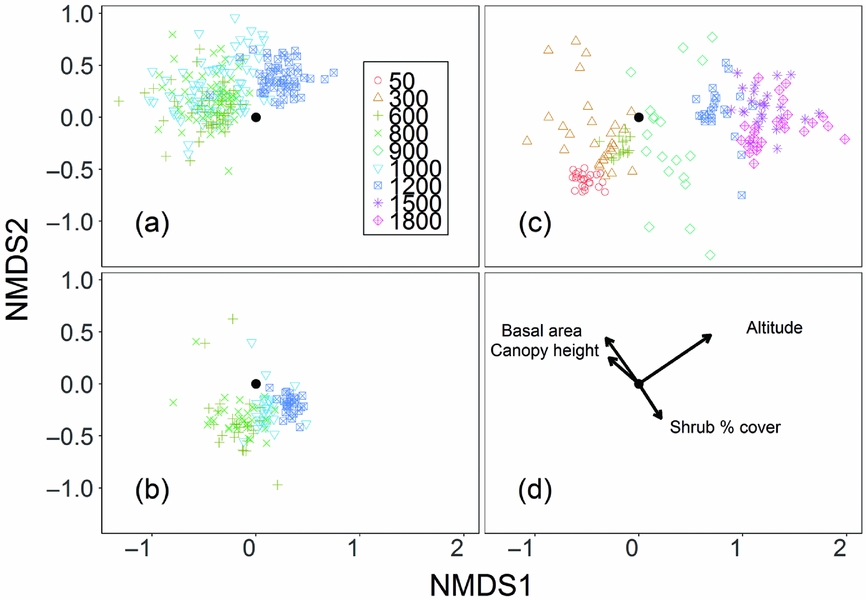
Ordination of combined data from the three mountains via NMDS, and a series of pairwise MRPP tests, showed that all groups on all mountains differed significantly from one another (Figure 7; max P < 0.01). Differences in ordination space between altitudes were greatest on Mulu, with clusters moving left to right across the plot with increasing altitude. On Topap Oso and Pueh, altitudinal clusters of points were less visually distinct, although altitudinal groups were still significantly different (mrpp, max P < 0.01). Points at 1200 m on both smaller mountains overlap little in ordination space with points from other altitudes, but there were broad zones of overlap between points at 600 m, 800 m and 1000 m. The two smaller mountains occupy parts of the graph distinct from one another, with points from Mulu spread more widely across the plot (reflecting its greater altitudinal range).
NMDS of combined avian point count data. Each mountain is displayed on a separate graph for clarity: Mt Topap Oso (a), Mt Pueh (b), and Mt Mulu (c). Positions of point clusters from different mountains relative to each other can be compared in reference to the solid dot at the centre. Environmental vectors (d) show the strength and direction of correlations between the labelled habitat parameters and the bird community composition of points. All vectors are significant (P < 0.001) based on a perMANOVA in R.
The SIMPER function in R was used to calculate individual species’ contributions to Bray–Curtis distance between altitudinal groups among and within mountains (Appendix 2). At least 33% of the variation between sites of similar altitude was explained by differences in only 10–15 species. The majority of these most significant species were important across multiple pairwise comparisons among multiple mountains and altitudes. They include the chestnut-backed scimitar babbler, golden-whiskered barbet, brown fulvetta, grey-headed canary-flycatcher and Bornean barbet. Each of these species was detected on all mountains at all altitudes from 600 to 1200 m. Only a few of the most influential species overall were entirely absent from any altitude within this range on any mountain – the blue-eared barbet was not detected above 600 m on Mulu, while the chestnut-winged babbler (Stachyris erythroptera) and red-throated barbet (Megalaima mystacophanos) were not detected above 900 m on Mulu, and the spectacled bulbul (Pycnonotus erythropthalmos) was not detected above 1000 m on Pueh.
In contrast to these species that showed up repeatedly in the SIMPER analyses, a few species contributed to differentiating only a single pair of sites. Grey-throated babbler was common at 1200 m on Pueh, but only a few individuals were detected at this altitude on Topap Oso. Bornean bulbul (Pycnonotus montis) was common at 1200 m on Topap Oso, but only a few were detected at this altitude on Mulu. Pale blue flycatcher (Cyornis unicolor) and short-tailed babbler (Malacocincla malaccensis) were common on Pueh at 600 m (and higher), while only a few were detected on Topap Oso at this altitude.
Habitat
Environmental vectors (Figure 7d) highlight habitat features most strongly correlated in the ordination. Altitude, woody plant basal area, canopy height and per cent shrub-cover were all significantly correlated with community composition (P < 0.001); this was especially true of altitude (R2 = 0.69). That this relationship held on all three mountains was apparent because points moved left to right on the ordination plots with increasing altitude, although points below 1200 m on the smaller mountains changed little with altitude. The effects of plant basal area, shrub per cent cover and canopy height were also correlated significantly with species composition (R2 = 0.29, 0.15, and 0.15, respectively; all P values < 0.001).
Canopy cover, shrub cover and total woody plant basal area differed between mountains and were significant vectors in the ordination, but none of them was significantly correlated with species richness. On Mulu, average canopy height increased with altitude from an average of 26.0 m at sea level (possibly due to some large tree removal) to a maximum of 36.1 m at 900 m, then declined steadily with altitude above this point to an average of only 16.4 m at 1800 m (R2 = 0.45, P < 0.001). Canopy height was not correlated significantly with altitude within the narrower sampled altitudinal range on Topap Oso, where average height was 33.3 m. On Pueh points at 600 m had an average canopy height of 32 m. Canopy height at points from 800 m to 1200 m averaged 28.1 m, significantly lower than points from 600 m (P < 0.01) but not different from each other.
Canopy cover, assessed using a canopy cover index, was not correlated with altitude but did vary significantly between sites (paired t-tests with Bonferroni correction, maximum P < 0.001). Cover on Mulu averaged 20% higher than Pueh, and 40% higher than Topap Oso. Total woody plant basal area was correlated with altitude within the sampled range only on Mulu (R2 = 0.17, P < 0.001).
DISCUSSION
This study of Bornean birds provides Sundaland's first example of an altitudinal study of montane bird species richness and turnover derived from a single set of replicated, quantitative surveys (but see Harris et al. Reference HARRIS, YONG, SHELDON, BOYCE, EATON, BERNARD, BIUN, LANGEVIN, MARTIN and WEI2012 for a study of occurrence). Of the three mountains surveyed, Mt Mulu has the most complete primary forest altitudinal gradient. Richness on Mulu is not correlated with patterns of community nestedness and turnover, or with values predicted by the MDE. Richness peaks at 600 m, and this peak appears simply to be the result of overlap of distinct lowland and montane bird communities, a result consistent with the faunal overlap hypothesis (Beck & Chey Reference BECK and CHEY2008). While low-to-mid-altitude richness peaks have previously been attributed to lowland-montane community overlap (Herzog et al. Reference HERZOG, KESSLER and BACH2005, Romdal & Rahbek Reference ROMDAL and RAHBEK2009), more recent studies have downplayed the importance of this phenomenon (McCain & Beck Reference MCCAIN and BECK2015) or found it to lack explanatory power (Beck et al. Reference BECK, MCCAIN, AXMACHER, ASHTON, BÄRTSCHI, BREHM, CHOI, CIZEK, COLWELL and FIEDLER2017). On the other two Bornean mountains, richness again is not correlated with community nestedness or turnover. MDE could not be determined for those mountains because of the short altitudinal range surveyed. Mt Pueh shows an apparent mid-altitude peak in richness, whereas richness on Mt Topap Oso appears to peak at 600 m (or its richness-peak is outside the survey range). On all three mountains, lowland and montane communities are predictable assemblages that are distinct from one another, and they overlap to varying degrees.
Richness, turnover, nestedness
The species richness gradient on Mt Mulu displays a low-altitude plateau, then it rises to a hump-shaped peak at 600 m, followed by a monotonic decline (Figure 3). This pattern agrees with about 25% of avian altitudinal gradient patterns worldwide (McCain Reference MCCAIN2009). The same pattern has been shown to be common in moths (Beck et al. Reference BECK, MCCAIN, AXMACHER, ASHTON, BÄRTSCHI, BREHM, CHOI, CIZEK, COLWELL and FIEDLER2017), plants (Grytnes et al. Reference GRYTNES, BEAMAN, ROMDAL and RAHBEK2008) and mammals (McCain Reference MCCAIN2005), including at several sites in South-East Asia. This finding reinforces the general observation that richness does not always decline monotonically with altitude, a phenomenon inconsistent with the global latitudinal diversity gradient (Rohde Reference ROHDE1992). The difference between altitudinal and latitudinal patterns suggests that the forces influencing richness on tropical mountains differ at least partially from those acting globally. Such differences are not surprising given the massive difference in scale. The limited spatial extent of altitudinal gradients, for example, likely leads to overlap between distinct montane communities based on spill-over in marginal habitat. Such differences are worth keeping in mind as biogeographers try to relate species richness patterns on mountains to those across the globe (Rahbek Reference RAHBEK2005).
When combined with richness estimates, turnover and nestedness values can help identify the community characteristics producing an altitudinal richness pattern. As in most vertebrate datasets worldwide (McCain & Beck Reference MCCAIN and BECK2015), the richness and turnover peaks on Mulu do not coincide. McCain & Beck (Reference MCCAIN and BECK2015) acknowledge that this does not exclude the possibility that mid-altitude richness peaks are the result of a broad zone of overlap between distinct highland and lowland communities, but report that in at least half of the datasets they examine there is no evidence for such distinct communities. In Borneo, however, distinct lowland and montane bird communities are quite clear, and Mulu provides an example illustrating that the richness peak and turnover peak are products of different (but related) phenomena. The low–mid-altitude richness peak at 600 m occurs because montane species richness increases more rapidly than lowland species richness declines with altitude (Figure 6). The pronounced, single turnover peak on Mulu occurs between 900–1200m because most lowland species are exhausted above 900m, whereas virtually all species above that altitude are montane (Figure 6). Richness at 900 m resembles richness at 1200 m, but this numerical similarity obscures a significant change in species composition. This change is apparent not only in the ordination, but also in the contrast between high turnover and low nestedness values across this interval. For these reasons, a lack of coincidence between turnover and richness values for gradients with significantly non-random species range distributions may be consistent with the faunal overlap hypothesis.
In testing the faunal community overlap hypothesis in Bornean geometrid moths, Beck & Chey (Reference BECK and CHEY2008) predicted that (1) species richness will decline with altitude when montane species are excluded, and (2) the distribution of species’ altitudinal range midpoints will be bimodal, one mode for lowland species and one for montane species. Although this hypothesis was not found to have much explanatory power in Bornean moths (Beck & Chey Reference BECK and CHEY2008), both predictions are true for Mulu birds (Figures 5 and 6). Species’ altitudinal range midpoints are distributed bimodally (Figure 5), and richness of lowland species declines with altitude above 300 m. Lower richness below 300 m on Mulu is probably attributable to disturbance of low-altitude forest rather than intrinsically lower richness, since undisturbed lowland forest in Borneo is known to be extremely rich in species (Smythies Reference SMYTHIES1999). Overlap of two distinct communities has also been found to explain the richness peak in small-mammal communities on Mt Kinabalu, in Sabah, north Borneo, although this peak occurs at a much higher altitude (Nor Reference NOR2001). Similar patterns have also been found in African birds (Romdal & Rahbek Reference ROMDAL and RAHBEK2009).
Unfortunately, extensive forest disturbance due to widespread shifting cultivation at low altitude prevented us from surveying entire gradients on the other two Bornean mountains. The scarcity of full altitudinal gradients still covered by primary forest is unsurprising given that over 38% of Borneo's lowland forest has been converted to plantations since the mid-1970s, and 56% of the remaining lowland forest has been heavily disturbed (Gaveau et al. Reference GAVEAU, SLOAN, MOLIDENA, YAEN, SHEIL, ABRAM, ANCRENAZ, NASI, QUINONES and WIELAARD2014). Even minor forest disturbance has been shown to have a significant effect on species assemblages of moths (Beck et al. Reference BECK, KITCHING, LINSENMAIR, Hawksworth and Bull2006) and birds in Borneo (Cleary et al. Reference CLEARY, BOYLE, SETYAWATI, ANGGRAENI, LOON and MENKEN2007, Edwards et al. Reference EDWARDS, LARSEN, DOCHERTY, ANSELL, HSU, DERHÉ, HAMER and WILCOVE2011, Johns Reference JOHNS1996, Lambert Reference LAMBERT1992), necessitating the truncation of survey ranges on Pueh and Topap Oso. Even so, surveys on these mountains appear to have captured altitudes of peak richness, if not the total shape of richness–altitude curves. The survey analyses also illuminate the main zones of community turnover on both mountains, as evidenced by the distinct difference in ordination space between sites at 1200 m and those at lower altitudes. Interestingly, we find that peak richness occurs at higher altitude (800–1000 m) on Pueh than on Mulu and Topap Oso. This shift on Pueh may have two causes: the upward expansion of lowland species in the absence of a rich montane community of potential competitors, and the downward expansion of the few montane species that are present on this relatively small, isolated, coastal mountain resulting from telescoping of vegetation zones. The higher altitude of peak richness on Pueh is consistent with the idea that lowland species are able to live higher on a mountain when released from competition (Terborgh & Weske Reference TERBORGH and WESKE1975), in this case because of the limited montane avifauna due to its isolation and small size. Other researchers, however, have cautioned against inferring competition without considering alternative explanations (Cadena & Loiselle Reference CADENA and LOISELLE2007), and more research is required to make strong claims about the mechanisms responsible for Pueh's community patterns.
MDE and other null models
Null models of McCain & Beck (Reference MCCAIN and BECK2015), including the MDE, predict different richness and turnover patterns than occur on Mt Mulu. The models’ poor fit is likely related to our finding that peak richness is caused deterministically by overlap of distinct lowland and montane faunal communities. Nevertheless, MDE models have been shown to have at least some explanatory power in respect to plant community distributions on Borneo's Mt Kinabalu (Grytnes et al. Reference GRYTNES, BEAMAN, ROMDAL and RAHBEK2008), which at 4095 m is nearly twice as high as Mt Mulu. In that case, a statistical framework combining both ecological factors and the null models was most successful in predicting species richness, an approach promoted by the models’ original proponents (Colwell et al. Reference COLWELL, RAHBEK and GOTELLI2005). We do not rule out the importance of null processes in influencing bird distribution on Mulu, but faunal overlap appears to provide a better explanation of the low-mid-altitude richness hump.
Community composition
Combined ordination of all survey points from the three mountains revealed differences in community composition between mountains and between altitudes on individual mountains. Pueh and Topap Oso further differ from each other in occurrence of key species. For example, on Pueh species that are most common across the gradient were chestnut-winged babbler and yellow-bellied warbler, whereas on Topap Oso they were spectacled bulbul, Bornean barbet, red-throated barbet and blue-eared barbet. On the other hand, as dictated by common sense, sites at adjacent altitudes on the same mountain are on average more similar in respect to species composition than to sites at the same altitude on different mountains. This was especially true on Pueh and Topap Oso for the lowest three altitudes sampled (600, 800 and 1000 m). Overall, for Pueh and Topap Oso, as mountains of similar size, differences in community composition suggest that factors other than altitude (e.g. geography, climate, degree of isolation and possibly habitat disturbance on the lower slopes; cf. Lomolino Reference LOMOLINO2001) are playing important roles in structuring avian communities.
On all three mountains, sites at 1200 m exhibit a significant shift in species composition from those at 1000 m and below. This community change is reflected quantitatively in richness and turnover values as well as visually on the ordination plot. This break even occurs on Pueh, with its relatively impoverished higher montane community, which suggests a primarily abiotic rather than biotic cause (Jankowski et al. Reference JANKOWSKI, LONDOÑO, ROBINSON and CHAPPELL2013). If the 800–1000 m ceiling apparent in many lowland species’ distributions on typical Bornean mountains (e.g. Mulu and Topap Oso) is caused by competition with montane avifauna, we would expect a significant uphill shift in species’ upper range limits on Pueh, where many montane competitors are absent (Pueh has half as many montane species as Mulu) (Terborgh & Weske Reference TERBORGH and WESKE1975). In fact, some species do appear to expand their ranges upward on Pueh relative to the other mountains (e.g. grey-headed canary-flycatcher and square-tailed drongo-cuckoo, Surniculus lugubris), contributing to its richness peak at higher altitudes. But these range-shifts are not without limits, and usually consist of only a few hundred metres, suggesting they are constrained ultimately by climate or habitat. Abiotic factors are therefore likely to play a role in limiting distributions of bird species, whether directly through physiological limits or indirectly through habitat structure (Lomolino Reference LOMOLINO2001).
Conclusions
The decline of species richness with latitude is a pervasive pattern globally, but the decline of species richness with altitude is a much less uniform pattern. This study, conducted on three distinctly situated Bornean mountains, presents the first published quantitative surveys of altitudinal gradients of birds in Sundaland. Species richness peaks at 600 m on Mt Mulu (and probably Mt Topap Oso), but several hundred metres higher on Pueh. Only limited conclusions can be drawn from the surveys of partial altitudinal gradients, which highlights the importance of studying and conserving the few remaining intact forest gradients that remain in the Sunda region. Continuous gradients of altitude not only provide habitat for a wide diversity of species, but also represent crucial but diminishing opportunities to understand the processes that have produced and structured biodiversity in the past.
Patterns of lowland versus montane community richness, plus overall patterns of turnover and nestedness, on Mulu explain the formation of the mountain's low-mid altitude richness peak. This peak is caused by overlap of lowland and montane communities. However, the peak in richness does not coincide with the peak in turnover, but occurs in a lower altitudinal band where the lowland bird community is still mostly intact and some montane species begin to appear. The distribution of species ranges producing this peak is not consistent with null predictions of the mid-domain effect on Mulu, but the narrower surveyed range on the other two mountains does not allow us to rule out this effect on those mountains. The gradual and overlapping transition from lowland to highland species supports the idea that bird species ranges in Borneo are not distributed randomly with respect to each other, but rather form relatively distinct communities by altitude. This supports the idea that a faunal overlap can produce a mid-low altitude peak in richness that does not coincide with peak turnover.
ACKNOWLEDGEMENTS
Indonesian Kementerian Riset dan Teknologi (RISTEK; SIP No. 89/EXT/SIP/FRP/SM/X/2012) and Sarawak Forestry Department, Forestry Corporation and Biodiversity Centre, and Parks kindly provided research permits. Andrew Siani identified many difficult species in our recordings. Numerous Indonesian, Malaysian and American field assistants and friends were indispensable, including David Bernasconi and Abdullah. Drs Mustafa Abdul Rahmah and Dency Gawin of Universiti Malaysia Sarawak provided institutional support. Conversations with Van Remsen, Phil Stouffer, Kyle Harms and Bret Collier contributed much to the project. We thank two anonymous reviewers for helpful comments. The US State Department Student Fulbright Grant program and the American Indonesian Exchange Foundation (AMINEF) provided funding to R. Burner for the fieldwork in 2012. The NSF (DEB 1241059), National Geographic Society (8753-10) and LSU's Student Research Fund helped fund fieldwork in Sarawak.
Bird species recorded in this study by Bornean mountain. Classification and order follow IOC World Bird List (v 4.4). (http://www.worldbirdnames.org/). Species with five or more detections on Mulu are designated as ‘lowland’ (n = 82) or ‘montane’ (n = 40) based on whether >75% of detections occur above or below the altitude of peak turnover (between 900 and 1200 m). Those species with five or more detections split more evenly between these two altitudinal zones are designated mid-altitude (‘mid-alt’; n = 10).

Simper scores reflecting species' contributions to pairwise differences between groups of sites from specified mountains and altitudes in Borneo. The ‘csum’ represents the cumulative sum of the contribution of the top n species. The 15 most influential species are displayed for each comparison. Species found to be influential in 10 or more of these 14 pairwise comparisons are marked with a single asterisk (*), while species found to be influential in only one of these pairwise comparisons are marked with a double asterisk (**).