INTRODUCTION
Understanding the role of elasmobranch fishes in marine food webs is a key component to management of marine ecosystems (Hussey et al., Reference Hussey, MacNeil, McMeans, Olin, Dudley, Cliff, Wintner, Fennessy and Fisk2014). Therefore, information about their trophic relationships (e.g. diet, trophic level) is necessary to understand their interactions, and build management plans to stabilize natural dynamics of marine ecosystems (Stevens et al., Reference Stevens, Bonfil, Dulvy and Walker2000; Heithaus et al., Reference Heithaus, Frid, Wirsing and Worm2008; Deehr et al., Reference Deehr, Luczkovich, Hart, Clough, Johnson and Johnson2014).
Knowledge of trophic interactions traditionally has been based on diet studies, using stomach content analysis (SCA), whereby the taxa found in the stomach are identified (Hyslop, Reference Hyslop1980; Grey et al., Reference Grey, Thackeray, Jones and Shine2002). However, unless a very comprehensive sampling investigation is used, stomach contents provide only a snapshot of the range of taxa in a species' diet. A complementary approach to SCA for determining trophic relationships and trophic level of marine predators is the use of stable isotope analysis (SIA). SIA measures the ratio between heavier and lighter isotopes; the most commonly employed to describe trophic relationships are the nitrogen (15N/14N = δ15N) and carbon (13C/12C = δ13C) isotope ratios.
Consumer tissues (predator) have higher δ13C and δ15N values relative to their diet (DeNiro & Epstein, Reference DeNiro and Epstein1978, Reference DeNiro and Epstein1981; Minagawa & Wada, Reference Minagawa and Wada1984). Hence, stable isotopes are suitable to infer trophic relationships. The δ15N is enriched as increasing in trophic level, and is often used as a proxy for trophic position (Post, Reference Post2002). In contrast, δ13C has little change with increases in trophic level, thus, it is used to trace the isotope composition of the carbon source in a food web, and give insights into different sources of primary productivity, such as benthic vs pelagic or nearshore vs offshore environments (France, Reference France1995; Burton & Koch, Reference Burton and Koch1999).
Isotope mixing models estimate the relative contribution of prey to the predator (Parnell et al., Reference Parnell, Inger, Bearhop and Jackson2010), which is one of the most promising applications for determining diet using SIA (Hussey et al., Reference Hussey, MacNeil, Olin, McMeans, Kinney, Chapman and Fisk2012). The difference in the isotopic values between consumer tissue and its diet is known as the diet-tissue discrimination factor (DDF) (Caut et al., Reference Caut, Angulo and Courchamp2009). This method requires an accurate DDF, which can vary widely between taxa (Vanderklift & Ponsard, Reference Vanderklift and Ponsard2003; Caut et al., Reference Caut, Angulo and Courchamp2009; Hussey et al., Reference Hussey, MacNeil, McMeans, Olin, Dudley, Cliff, Wintner, Fennessy and Fisk2014), even in elasmobranchs (Hussey et al., Reference Hussey, Brush, McCarthy and Fisk2010; Kim et al., Reference Kim, Casper, Galván-Magaña, Ochoa-Díaz, Hernández-Aguilar and Koch2011). To date, only a few studies have used stable isotope mixing models to estimate diet proportions in elasmobranch species (Drymon et al., Reference Drymon, Powers and Carmichael2011; Kim et al., Reference Kim, Casper, Galván-Magaña, Ochoa-Díaz, Hernández-Aguilar and Koch2011; Vaudo & Heithaus, Reference Vaudo and Heithaus2011; Boyle et al., Reference Boyle, Ebert and Cailliet2012).
The shovelnose guitarfish (Pseudobatos productus) is commonly observed in temperate and subtropical waters along the shoreline of the Pacific Ocean from San Francisco Bay, California, to the State of Guerrero, Mexico, including the Gulf of California (Fischer et al., Reference Fischer, Krupp, Schneider, Sommer, Carpenter and Niem1995). It is a demersal species that inhabits muddy soft bottoms of bays, lagoons and estuaries (Márquez-Farías, Reference Márquez-Farías2007). This guitarfish is the most abundant and economically important batoid in Gulf of California fisheries. This species represents >50% of the batoid fishery landings in the Gulf of California. It is heavily exploited by local fishermen and is taken as bycatch in the commercial shrimp trawlers (Márquez Farías, Reference Márquez-Farías2002; Bizzarro et al., Reference Bizzarro, Smith, Hueter, Tyminski, Marquez-Farias, Castillo-Geniz, Cailliet and Villavicencio-Garayzar2007). In Elkhorn Slough California, the guitarfish feed mainly on crustaceans and a few fish and clams (Talent, Reference Talent1982). Despite the extensive number of the guitarfish caught and its potential importance to the benthic community in the Gulf, little information on dietary habits and trophic level are available for this species. Therefore, the objective of this study was to describe the diet of the guitarfish and to estimate its trophic level in the upper Gulf of California by sex and ontogenetic stage using SCA and SIA.
MATERIALS AND METHODS
Sampling and study area
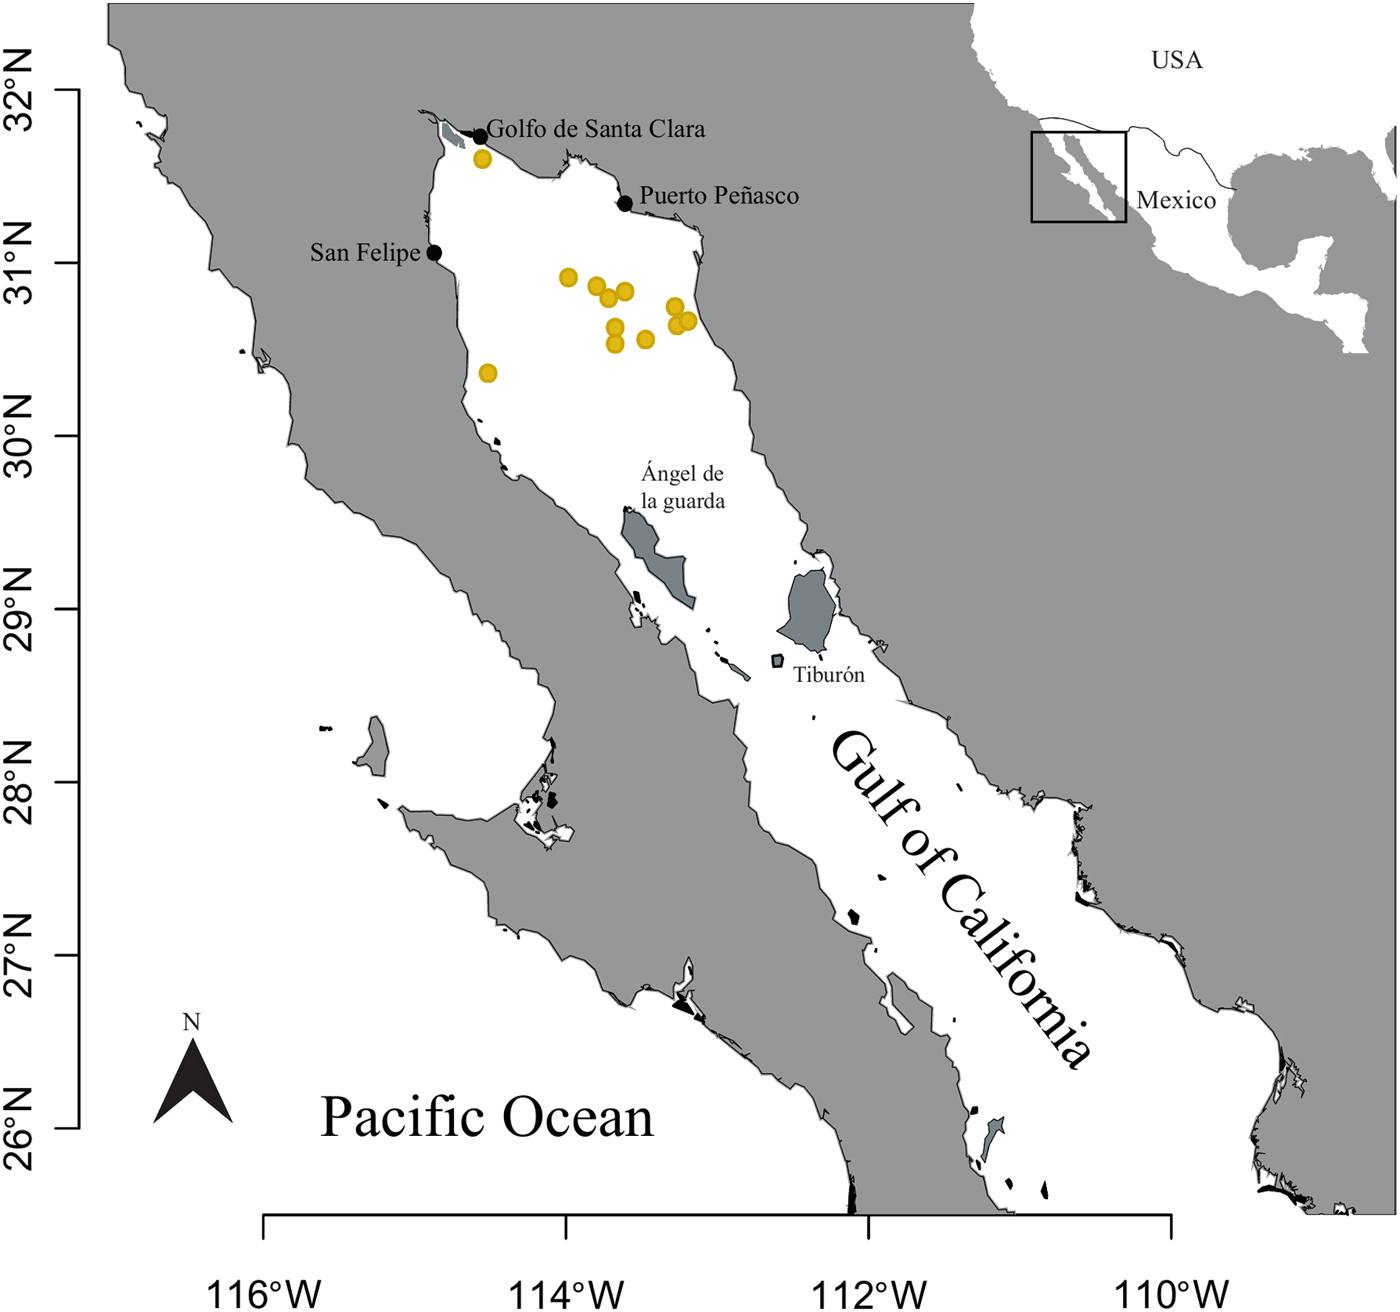
Guitarfish were sampled between March and August 2008, with a total of 160 specimens being caught in the upper Gulf of California by fishermen and researchers via gillnets and trawling (Figure 1). Total length (L t) in millimetres (mm), sex and geographic location of each specimen were recorded. Stomachs were excised and frozen for later examination in the laboratory. Muscle tissue from the mid-dorsal region of 85 specimens was excised and frozen for later stable isotope analysis. To assess ontogenetic variations in diet, samples were divided in three size classes roughly based on length at maturity (Márquez-Farías, Reference Márquez-Farías2007). These size classes were juveniles size class I (<570 mm L t), young adults size class II (570–831 mm L t), and older adults size class III (>832 mm L t).
Study area in the upper Gulf of California. Small circles are collection sites.

Stomach content analysis (SCA)
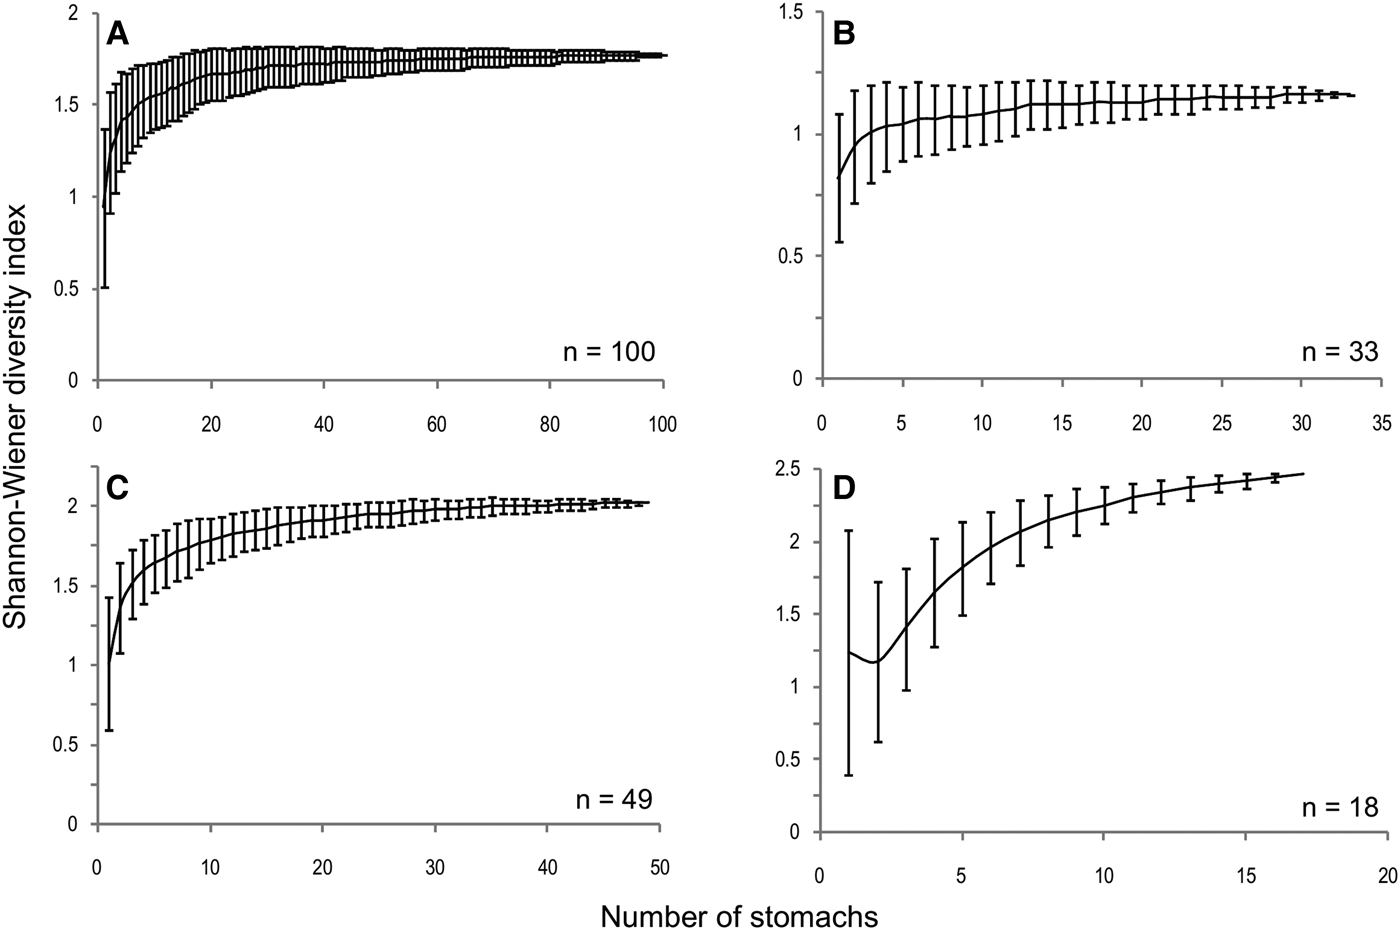
To determine whether a sufficient number of guitarfish was sampled to adequately describe the diet, the Shannon cumulative prey diversity index was employed. It estimates the mean prey diversity as a function of sample size. Stomach samples were randomized 1000 times by the program Stimates 8.2.0 (Colwell, Reference Colwell2009). Sample size is considered sufficient to describe diet, if the cumulative prey curve reaches the asymptote. It was tested by using a linear regression of the endpoints of the curve and comparing the slope with respect to a line of zero slopes (Bizzarro et al., Reference Bizzarro, Smith, Hueter, Tyminski, Marquez-Farias, Castillo-Geniz, Cailliet and Villavicencio-Garayzar2007).
Index of stomach fullness was based on visual estimates (1 = 1–25%; 2 = 26–50%; 3 = 51–75% full; 4 = 76–100%). Prey were identified to the lowest taxonomic level possible, counted and weighed. Prey taxa were grouped into seven categories: shrimp-like (Penaeidae and Caridea), crabs (Brachyura), stomatopods, unidentified crustaceans, fishes, squid (Loliginidae) and other.
The percentage by number (%N), percentage by mass (%M), frequency of occurrence (%FO) and the index of relative importance (IRI), which is defined as IRI = % FO (% N + % M) were calculated for each prey category (Pinkas et al., Reference Pinkas, Oliphant and Iverson1971). To compare with other studies the IRI values were expressed as a percentage (%IRI) by sex and size class (Cortés, Reference Cortés1997). Niche breadth was estimated using the standardized Levine's Index (Pielou, Reference Pielou1975) based on the total number of prey taxa. This index presents values from 0 to 1, where low values indicate a specialist predator and high values represent a generalist predator (Labropoulou & Eleftheriou, Reference Labropoulou and Eleftheriou1997). Prey diversity by sex and size class was estimated using the Shannon–Wiener Index (Pielou, Reference Pielou1975).
Stable isotope analysis (SIA)
Muscle samples were dried at 60°C for 60 h. Lipid extraction was performed in a microwave digestion oven (MARS X, CEM, Matthews, NC) with temperature and pressure controlled (Paré et al., Reference Paré, Bélanger and Stafford1994; Renoe, Reference Renoe1994). Dried samples were ground to a powder using an agate mortar and pestle; 1 mg samples were weighed in tin containers (8 × 5 mm) with a precision scale (±0.001 g). Also, non-lipid extracted samples were processed to assess differences between lipid extracted and non-extracted samples to determine if this step was necessary for SIA in the guitarfish.
Stable carbon and nitrogen isotope ratios were measured at the University of California Isotope Facility using a PDZ Europa ANCA-GSL elemental analyser interfaced to a PDZ Europa 20–20 isotope ratio mass spectrometer (Sercon Ltd, Cheshire, UK). Standard materials were Vienna-PeeDee belemnite (VPDB) for carbon and atmospheric nitrogen (air) for nitrogen. Analytical precision was 0.13‰ δ13C and 0.11‰ δ15N. All carbon and nitrogen isotope data are reported in δ notation according to the following equation: δX = [(Rsample/Rstandard) − 1] × 1000, where X is 13C or 15N and R = 13C/12C or 15N/14N (Peterson & Fry, Reference Peterson and Fry1987). Statistical analyses (ANOVA) were conducted with Statistica 6.0 software (StatSoft, Tulsa, OK) to compare δ13C and δ15N values by sex and size classes. All data were analysed for normality and homogeneity of variance requirements for parametric analyses and a α value of 0.05 was used for the analysis.
Bayesian isotope mixing model
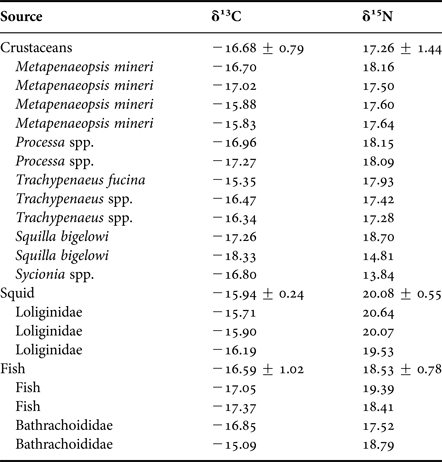
To assess the proportional contribution of prey (%) to diet, a Bayesian isotope-mixing model was performed using the package ‘SIAR’ (Parnell et al., Reference Parnell, Inger, Bearhop and Jackson2010) in the R statistical platform (R Core Team, 2012). SIAR produces posterior distributions that represent the probability densities for the relative contribution of different prey groups to the isotopic values of the guitarfish. We modelled the contribution (%) to diet for each size class. Prey isotope data were averaged into three groups with similar functional significance and isotope values: crustaceans (Metapenaeopsis, Processa, Squilla, Trachypenaeus, Sycionia); squid (Loliginidae); and fishes (Bathrachoididae and unidentified fish) (Table 1) (Phillips et al., Reference Phillips, Newsome and Gregg2005; Dodge et al., Reference Dodge, Logan and Lutcavage2011). SIAR requires diet-tissue discrimination factors (DDFs) as input to estimate the proportional contribution of prey; we used two average DDFs values reported to describe trophic web interactions: δ13C = 0.9 ± 0.3‰ and δ15N = 2.33 ± 0.2‰ (Hussey et al., Reference Hussey, Brush, McCarthy and Fisk2010); δ13C = 1 ± 0.5‰ and δ15N = 3.11 ± 0.7‰ (Vanderklift & Ponsard, Reference Vanderklift and Ponsard2003); and δ13C = 1 ± 0.5‰ and δ15N = 3.4 ± 1‰ (Post, Reference Post2002). We performed three runs each using a different DDF, and we employed 500,000 iterations per run.
Stable isotopes values of prey items in the diet of Pseudobatos productus from the upper Gulf of California.

Trophic level
Trophic level was estimated from stomach content and stable isotope analysis. From stomach content analysis, trophic level was estimated with the equation (Cortés, Reference Cortés1999):
 $${\rm TL}_k = 1 + \left( {\mathop \sum \limits_{J = 1}^k P_j \times {\rm TL}_j} \right),\; $$
where, TLk is the trophic level, P j is the proportion of each prey category in diet and TL j is the trophic level of each prey category j (Cortés, Reference Cortés1999; Ebert & Bizzarro, Reference Ebert and Bizzarro2007). For stable isotope analysis, trophic level was estimated from the equation (Post, Reference Post2002):
 $${\rm TL} = \left[ {\displaystyle{{({\rm \delta} 15{\rm N}i_i - {\rm \; \delta} 15{\rm N}_{{\rm ref}} )} \over \Delta}} \right] + {\rm \lambda}, $$
where δ15Ni is the δ15N of the guitarfish; δ15Nref is the baseline reference value. In this case, the summer particulate organic matter (POM; δ15Nref = 12‰) value for the northern Gulf of California was used (Altabet et al., Reference Altabet, Pilskaln, Thunnell, Pride, Sigman, Chavez and Francois1999) and λ is the trophic level of the baseline reference (λ = 1). Δ is the enrichment in δ15N per trophic level. We employed average reported Δ values for food web interactions. The most common value in the literature is 3.4‰ (Minagawa & Wada, Reference Minagawa and Wada1984; Post, Reference Post2002); 3.11‰ for organisms that excrete urea (Vanderklift & Ponsard, Reference Vanderklift and Ponsard2003).
RESULTS
We collected 160 guitarfish from the northern Gulf of California. Males (N = 88) ranged from 435 to 974 mm L t; females (N = 72) ranged from 460 to 1090 mm L t. Of the full catch, 60 stomachs were empty and 100 contained prey items. Fullness index indicated that most of the stomachs were empty or contained little content: category 1 (N = 47; ~50%), followed by category 3 (N = 24), category 2 (N = 18), and category 4 (N = 11). Most prey items were highly digested.
Stomach contents
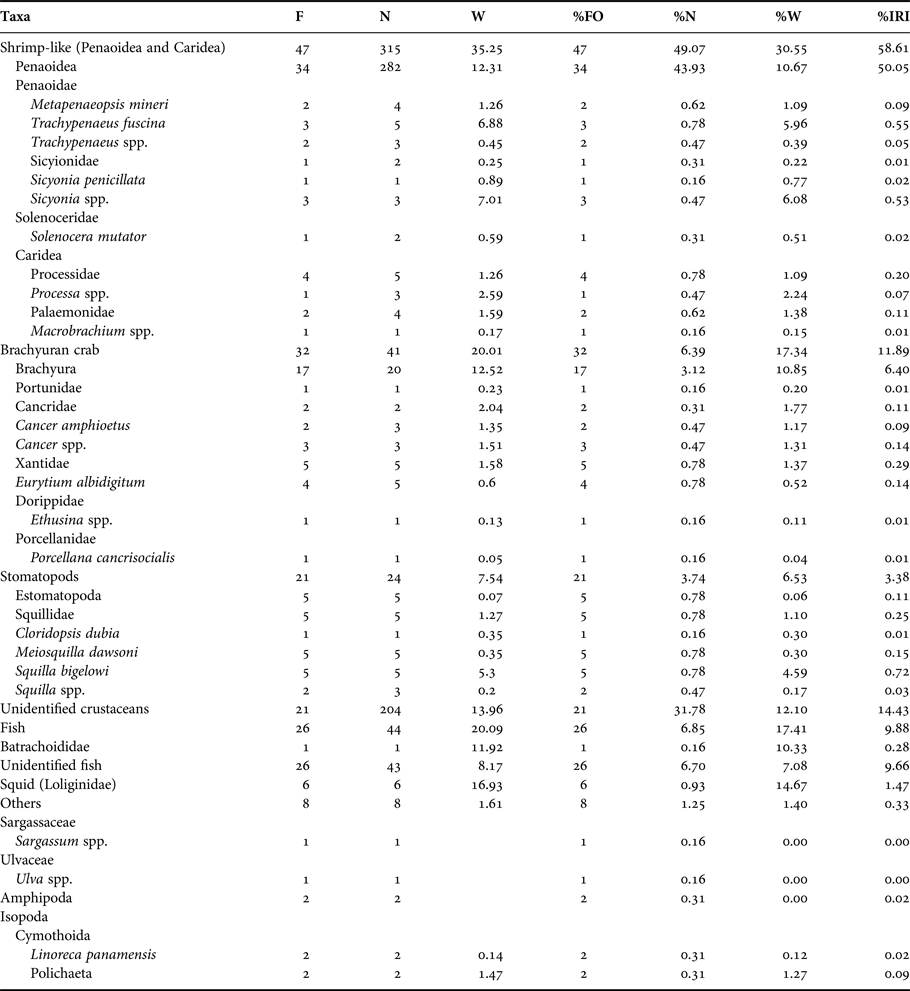
Cumulative prey diversity curves reached an asymptote with no significant deviations from zero slope (P > 0.05) except for size class III (P < 0.05) (Figure 2). General diet was mostly shrimp-like (Penaeidae and Caridea; 58.61 %IRI), followed by unidentified crustaceans (14.43 %IRI), brachyuran crabs (11.89 %IRI), fishes (9.88 %IRI), stomatopods (3.38 %IRI) and cephalopods (1.47 %IRI) (Table 2).
Curves of cumulative mean diversity and standard deviation (bars) of Shannon index within stomachs of Pseudobatos productus, as a function of sample size: (A) Overall, (B) Size class I (435–569 mm), (C) Size class II (570–831 mm) and (D) Size class III (832–1091 mm).

Composition of diet of Pseudobatos productus from the upper Gulf of California.

Per cent of frequency of occurrence (%FO), by number (%N), weight (%W) and Index of Relative Importance (%IRI).
Prey items of females and males were similar, but proportions varied, largely due to taxonomic resolution. The most important prey items for females were shrimp-like (Penaeidae and Caridea; 65.74% IRI), while unidentified crustaceans were more important for males (52.96 %IRI). Brachyuran crabs were the second more important prey for females (14.47 %IRI) and shrimp-like (Penaeidae and Caridea) prey were the second most important group (34.78 %IRI) for males. Fishes were in third position in both sexes. Loliginids squid (4.29 %IRI) were more important in the diet of females than of males (Tables S1 and S2).
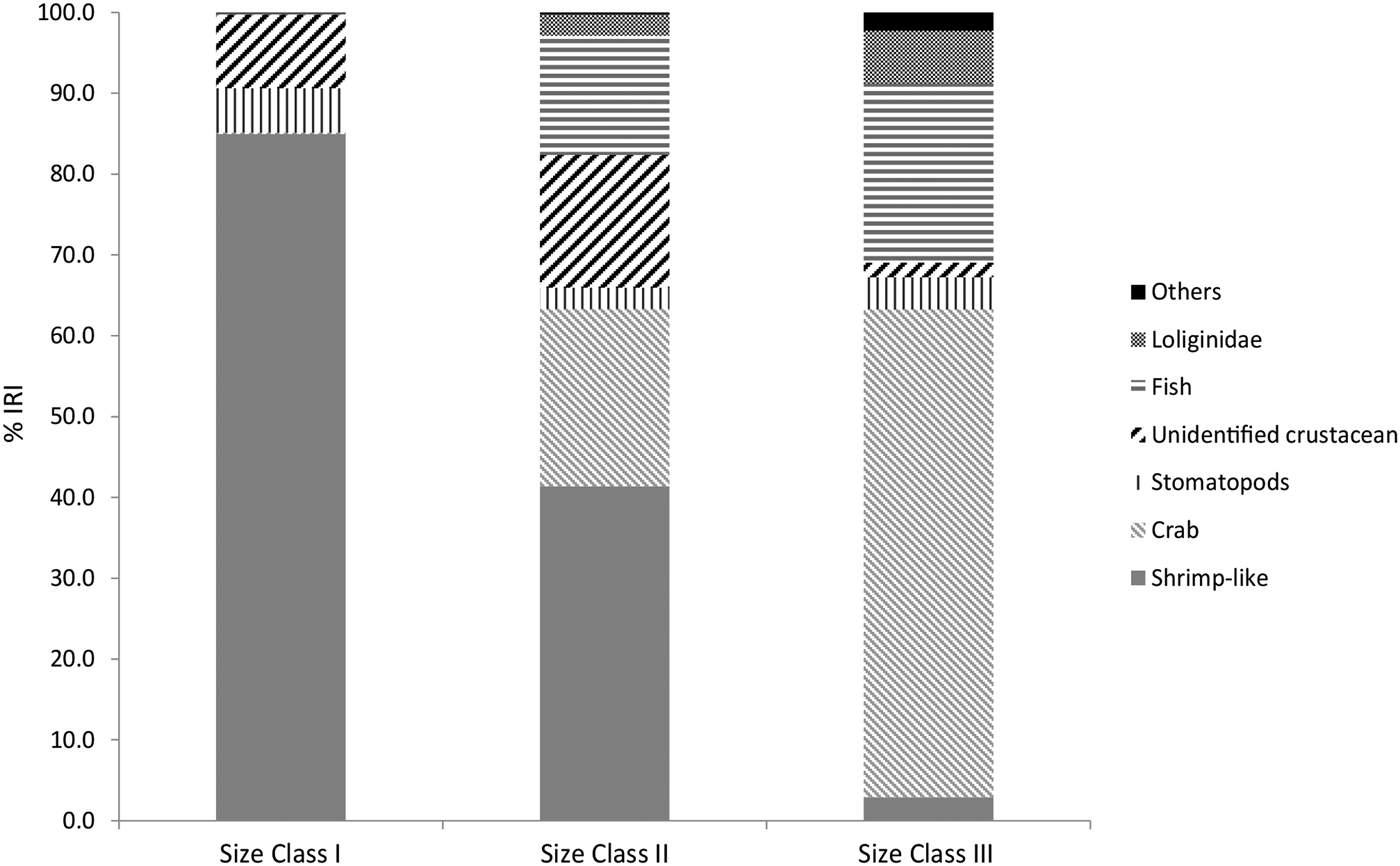
Feeding differences related to size were observed, with the general pattern being a reduction of crustaceans (shrimp-like, brachyuran crabs, stomatopods) and an increase in fishes and squid from size class I to size class III (Figure 3). Crustaceans were most common in size class I (shrimp-like, 84.94 %IRI; unidentified crustaceans, 9.16 %IRI; Stomatopods 5.46 %IRI) (Figure 3; Table S3), and in size class II (shrimp-like, 41.40 %IRI; crabs 21.94 %IRI; unidentified crustaceans, 16.43 % IRI), but in this latter size class fishes (14.76 %IRI) were also important. Also, size class II started to incorporate loliginid squid (2.65 %IRI) to the diet (Figure 3; Table S3). Brachyuran crabs (60.38 %IRI) and fishes (22.11 %IRI) were the most common prey items in size class III and loliginid squid consumption were found to increase to 6.54 %IRI (Figure 3; Table S3).
Pseudobatos productus diet composition as Index of Relative Importance (%IRI) inferred by stomach content analysis for different size classes: size class I (435–569 mm), size class II (570–831 mm) and size class III (832–1091 mm).

Ecological index
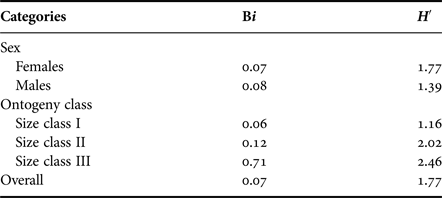
Levin's Index designates guitarfish as a specialist predator; however, this applies only for size classes I and II. For size class III, this species transforms into a more generalist predator (Table 3). Overall, guitarfish had a low prey diversity according to the Shannon Index, with an increase in prey diversity with increase in size at class III (Table 3).
Diet diversity of Pseudobatos productus, using the Levin Index (Bi) and Shannon Index (H′) by sex and size class: size class I (435–569 mm), size class II (570–831 mm) and size class III (832–1091 mm).

Stable isotopes
The C:N ratio in tissues with extracted lipids was 3.0 ± 0.11, ranging from 2.84 to 3.33, and in tissues with non-extracted lipids this ratio was 3.0 ± 0.23, ranging from 2.7 to 3.3. There was no significant difference in C:N ratios between tissues, suggesting that lipid extraction is unnecessary for stable isotope analysis in muscle of this guitarfish.
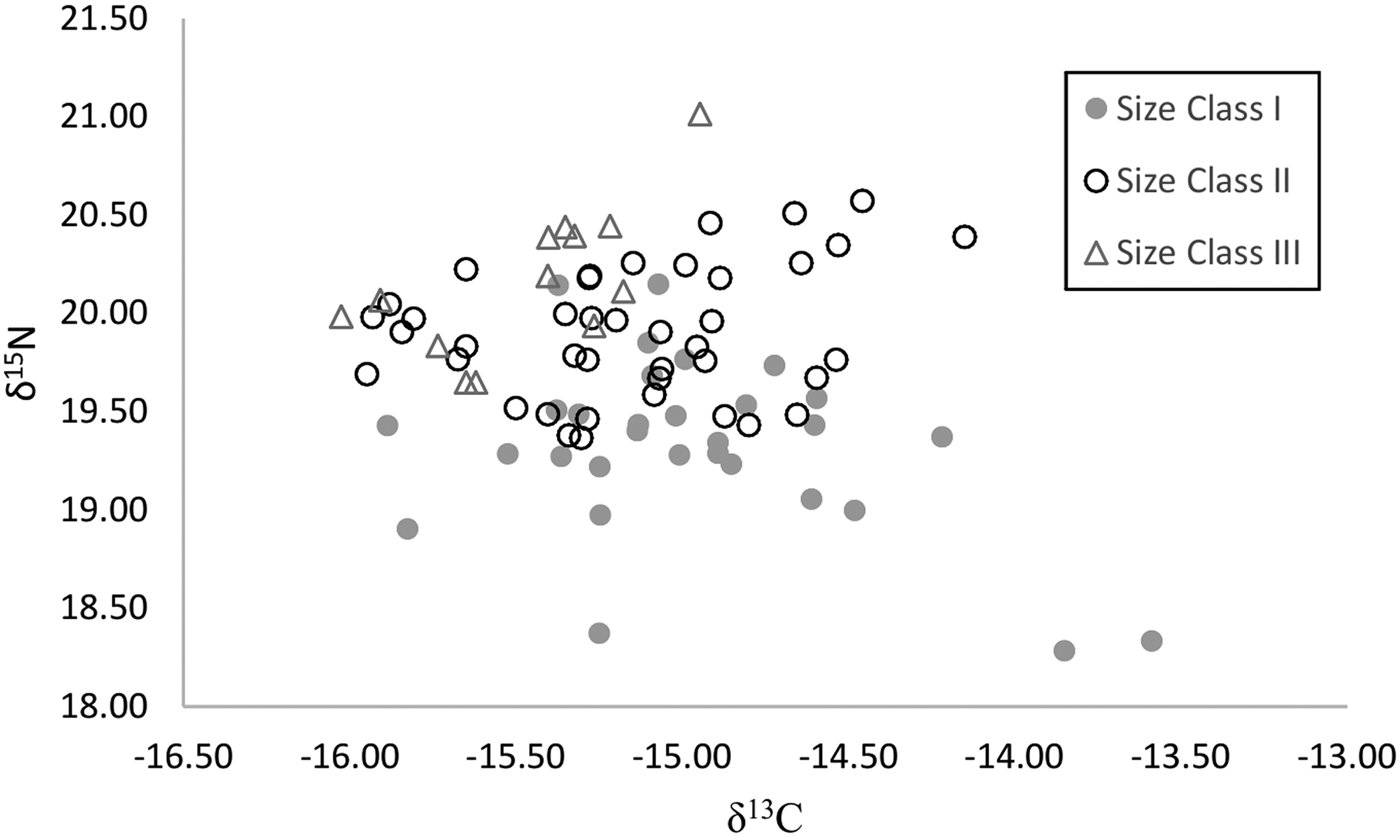
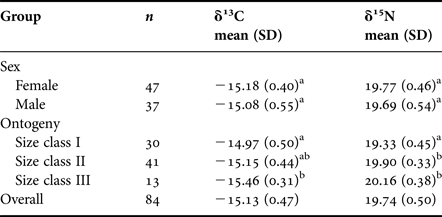
The guitarfish δ13C values ranged from −16.03 to −13.59‰, with a mean of −15.13 ± 0.47‰ (Figure 4). The δ15N values ranged from 18.28 to 21.01‰, with a mean of 19.74 ± 0.50 (Figure 4). There were no significant differences in δ13C and δ15N between females and males (P > 0.05) (Table 4). However, significant differences between size classes were found. The δ13C values of size class I were significantly greater than size class III (P < 0.001; Table 4). The δ15N values of size class I was significantly lower than size classes II and III (P < 0.001), but there were no significant differences between size classes II and III (P > 0.05) (Table 4).
Carbon and nitrogen stable isotope values of Pseudobatos productus for different size classes.

Stable isotope signatures of Pseudobatos productus by gender and size classes: size class I (435–569 mm), size class II (570–831 mm) and size class III (832–1091 mm).

a,bDifferent letters indicate significant differences at P < 0.05 between sexes or among size classes.
SIAR
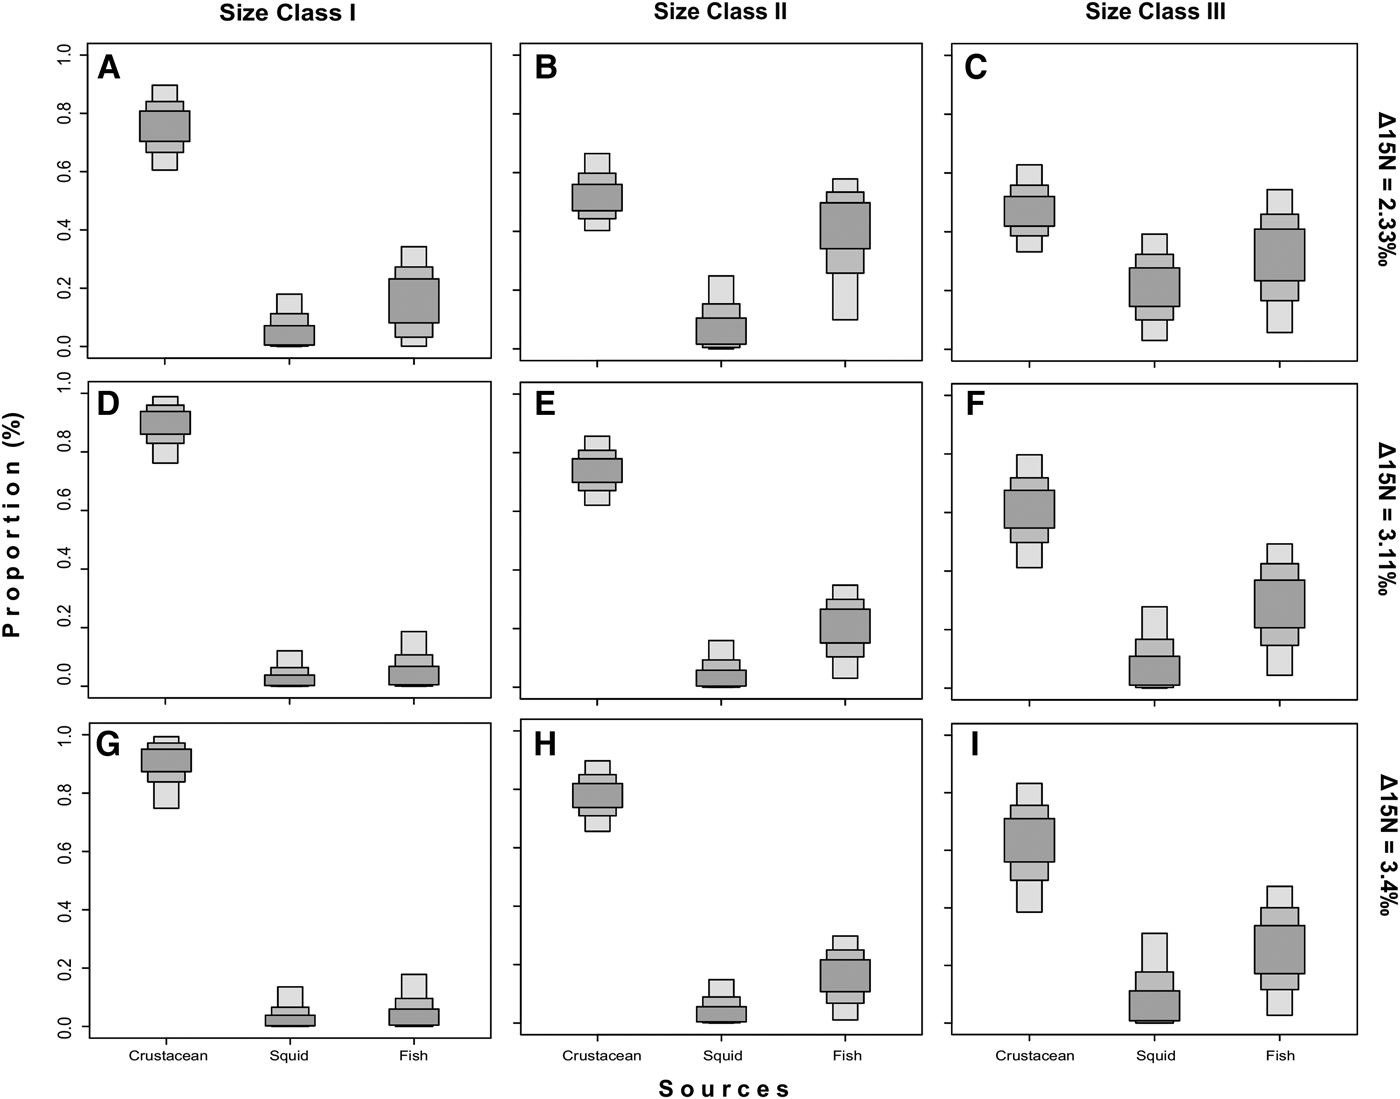
Based on the SIAR model, guitarfish fed mainly on crustaceans followed by fishes and squids (Figure 5). Despite uncertainty of the DDF values, the same changes in diet were detected among size classes. Size class I fed almost exclusively on crustaceans (76–90%) (Figure 5), size class II reduced crustaceans to ≈50–75% and incorporated fishes ≈20–40%) and squid (≈0–5%) depending of the DDF employed. Size class III reduced crustaceans to ≈65% and fishes increased to 25%, given the DDF values used in the model (Figure 5).
Boxplots of the relative contributions from potential prey sources (crustaceans, squid, and fish) to diet of different size classes: size class I (435–569 mm), size class II (570–831 mm) and size class III (832–1091 mm) of Pseudobatos productus, using SIAR mixing model with different diet-tissue discrimination factors (DDFs): (A–C) Δ15N = 2.33, (D–F) Δ15N = 3.11, (G–I) Δ15N = 3.4 (Post, Reference Post2002; Vanderklift & Ponsard, Reference Vanderklift and Ponsard2003; Hussey et al., Reference Hussey, Brush, McCarthy and Fisk2010). The proportions show the credibility intervals at 95, 75 and 25%.

Trophic level
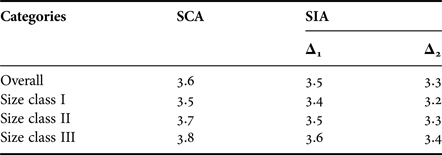
The estimate of trophic level (TL) using stomach content analysis was 3.6. There was a small increase in trophic level with increase in size (Table 5). Trophic level, using stable isotope analyses, was similar to stomach content (TL = 3.5, Δ = 3.11; TL = 3.3, Δ = 3.4) and an increase with size (Table 5). Although there were discrepancies in estimates, all of them indicate that the guitarfish is a secondary predator.
Trophic level values of the Pseudobatos productus by stomach content analysis (SCA) and stable isotope analysis (SIA) using different Δ15N values Δ1 = 3.11 (Vanderklift & Ponsard, Reference Vanderklift and Ponsard2003) and Δ2 = 3.4 (Post, Reference Post2002).

DISCUSSION
General diet analyses
SCA and SIA show that (1) the guitarfish feed on coastal benthic organisms, mainly on crustaceans, followed by fishes and cephalopods, (2) there were no differences in diet composition and isotopic values by sex, (3) contents show that smaller guitarfish are more specialized predators, almost exclusively eating crustaceans, whilst larger guitarfish become more generalist predators, still with a crustacean dominated diet but also eating fishes and squid. These results were strongly supported by the SIAR mixing model, independent of the DDF used, and (4) trophic level estimates designate the guitarfish as a second-order predator.
The guitarfish in this study feed mainly on crustaceans followed by fishes and cephalopods. Feeding studies for Rhinopristiformes species show a preference for benthic crustaceans (Capapé & Zaouali, Reference Capapé and Zaouali1979; Talent, Reference Talent1982; Abdel-Aziz et al., Reference Abdel-Aziz, Khalil and Abdel-Maguid1993; White et al., Reference White, Platell and Potter2004; Shibuya et al., Reference Shibuya, de Souza Rosa and Costa Soares2005; Dowton-Hoffman, Reference Dowton-Hoffman2007; Ismen et al., Reference Ismen, Yigin and Ismen2007; Navia et al., Reference Navia, Mejía Falla and Giraldo2007). This is because they inhabit similar coastal-benthic habitats and share morphological characteristics that determine their feeding strategies. Predation by Rhinopristiformes involves immobilization of prey on the seafloor, with a movement of its body over the prey and its mouth creates suction to chew the prey before ingestion (Wilga & Motta, Reference Wilga and Motta1998; Motta & Wilga, Reference Motta and Wilga2001). Rhinobatids are not suited to catching fast-moving fishes (White et al., Reference White, Platell and Potter2004) and cannot cut prey into pieces, which implies that they do not have the capacity to ingest prey larger than their mouth (Lucifora et al., Reference Lucifora, García, Menni, Escalante and Hozbor2009). Results of this study are in agreement with diet studies for other rhinobatid species.
Diet composition and isotopic analysis did not show significant differences between males and females. However, higher trophic level prey, such as fishes and cephalopods, were more common in females than males. Females are typically larger than males, and consequently females are able to capture more fishes and cephalopods (Dowton-Hoffman, Reference Dowton-Hoffman2007; Márquez-Farías, Reference Márquez-Farías2007). Despite the potential size differences between females and males, there were no significant differences in δ13C and δ15N values, suggesting they share the same trophic niche and feed in the same habitats and on the same prey as described below.
Carbon isotope values are used as indicators of primary production sources in food webs, because coastal environments have greater δ13C values than oceanic environments (Burton & Koch, Reference Burton and Koch1999) and benthic organisms are enriched relative to planktonic organisms (France, Reference France1995; Jennings et al., Reference Jennings, Reñonez, Morales-Nin, Polunin, Moranta and Coll1997; Pinnegar & Polunin, Reference Pinnegar and Polunin2000). In the Gulf of California, δ13C of coastal species are −10 to −15‰ and offshore species are −15 to −20‰ (Gendron et al., Reference Gendron, Aguiñiga and Carriquirry2001; Diaz-Gamboa, Reference Diaz-Gamboa2003; Stapp & Polis, Reference Stapp and Polis2003; Niño-Torres et al., Reference Niño-Torres, Gallo-Reynoso, Galván-Magaña, Escobar-Briones and Macko2006). The mean δ13C for the guitarfish was −15.13 ± 0.47‰ and it is typically found on muddy, soft bottoms along the coast; it is a common by-catch in shrimp trawling to depths of 30 m (Dowton-Hoffman, Reference Dowton-Hoffman2007; Márquez-Farías, Reference Márquez-Farías2007). Thus, the guitarfish can be considered a coastal benthic predator in the Gulf of California.
Ontogenetic shifts and trophic level
Dietary changes in diet, mainly related to size, have been reported in this species and in other Rhinopristiformes. Talent (Reference Talent1982), for example, found differences in the guitarfish feeding habits among size classes – smaller specimens consumed mainly crustaceans, while larger individuals incorporate fishes and clams in their diet. White et al. (Reference White, Platell and Potter2004) observed changes in diet proportions of Glaucostegus typus among size classes, where Penaoidae shrimp decreased while portunid crabs increased in importance with increase in size. Ismen et al. (Reference Ismen, Yigin and Ismen2007) found diet changes in R. rhinobatos, where Penaeidae and Cragonidae shrimp decreased in importance, and Squillidae became the most common. Increase in body size is an important factor in modifying predation capabilities of marine predators. Larger predators are able to feed on larger and more diverse prey because they have larger mouths and improved swimming capabilities (Sharf et al., Reference Sharf, Juanes and Rountree2000; Lucifora et al., Reference Lucifora, García, Menni, Escalante and Hozbor2009). For guitarfish, increased diversity of diet reflects the change from a specialist to a generalist predator.
This ontogenetic diet shift was reflected by small, but significant δ13C changes with increasing size. The differences in δ13C values among size class might be related to habitat characteristics with different carbon sources (Box et al., Reference Box, Deudero, Blanco, Grau and Riera2010). This has been documented for several ecosystems (France, Reference France1995; Burton & Koch, Reference Burton and Koch1999; Pinnegar & Polunin, Reference Pinnegar and Polunin2000). The δ13C values in the largest size class might indicate more time feeding further offshore (Gendron et al., Reference Gendron, Aguiñiga and Carriquirry2001; Diaz-Gamboa, Reference Diaz-Gamboa2003; Stapp & Polis, Reference Stapp and Polis2003; Niño-Torres et al., Reference Niño-Torres, Gallo-Reynoso, Galván-Magaña, Escobar-Briones and Macko2006). For δ15N values, the smallest size classes had significantly lower values than the larger two size classes, where no significant differences occurred.
Factors that can contribute to δ15N enrichment with size are physiological changes, habitat change or resource use change (Reñones et al., Reference Reñones, Polunin and Goni2002; Caut et al., Reference Caut, Angulo and Courchamp2009; Hussey et al., Reference Hussey, MacNeil, Olin, McMeans, Kinney, Chapman and Fisk2012). In this case, the increase of δ15N values with increase of size length is probably explained by the change of the trophic level of prey as the guitarfish grow. Size class I fed on shrimp that have low trophic level (~2.5) (Cortés, Reference Cortés1999; Ebert & Bizzarro, Reference Ebert and Bizzarro2007), while size class III eats prey that have a higher trophic level (fishes ~3.24 and squid ~3.2).
The change in prey proportions is in accordance with stomach content analysis and SIAR mixing model despite uncertainty in diet-tissue discrimination factors (DDFs). The DDFs showed the same pattern of ontogenetic diet changes. Thus, the change in diet with increasing size appears to be the main reason for the change in δ15N and δ13C values among size classes.
Stomach content analysis and stable isotope analysis showed that the guitarfish is a secondary consumer (trophic level >3.3), with a small increase related to size. Trophic level determined by stomach contents and stable isotopes probably differed because of uncertainty of Δ15N DDFs in the food web, which make it difficult to calculate the trophic position (Hussey et al., Reference Hussey, MacNeil, Olin, McMeans, Kinney, Chapman and Fisk2012, Reference Hussey, MacNeil, McMeans, Olin, Dudley, Cliff, Wintner, Fennessy and Fisk2014). Δ15N DDFs are influenced by taxon, tissue, environment, physiology, mode of excretion and other factors (Vanderklift & Ponsard, Reference Vanderklift and Ponsard2003; Caut et al., Reference Caut, Angulo and Courchamp2009). Due to the lack of an average DDF for marine food web in the Upper Gulf, we used reported average DDFs as a proxy to gain insights on the trophic level of the guitarfish (Minagawa & Wada, Reference Minagawa and Wada1984; Vander Zanden & Rasmussen, Reference Vander Zanden and Rasmussen2001; Post, Reference Post2002; Vanderklift & Ponsard, Reference Vanderklift and Ponsard2003). Despite the uncertainty about discrimination factors, all trophic level estimates were similar. Hence, we conclude that the guitarfish is a secondary consumer or higher.
Trophic level estimates of the guitarfish are similar to other Rhinopristiformes species (Blanco-Parra et al., Reference Blanco-Parra, Galván-Magaña, Márquez-Farías and Niño-Torres2011; Borrell et al., Reference Borrell, Cardona, Kumarran and Aguilar2011). Also, these trophic level values are similar to other secondary elasmobranch predators, such as the Rajiformes: Anacanthobatidae, Arhynchobatidae and Rajidae (3.5, 3.9, 3.8, respectively) (Ebert & Bizzarro, Reference Ebert and Bizzarro2007) and sharks, such as Triakidae (3.8), mainly the genus Mustelus, as well as families in the orders Orectolobiformes (3.6) and Heterodontiformes (3.2) and slightly less than tertiary consumers (>4) (Cortés, Reference Cortés1999).
CONCLUSIONS
Pseudobatos productus is a specialist predator that feeds on coastal benthic organisms, mainly crustaceans, followed by fishes and cephalopods. We found no difference in diet composition and isotope values by sex. However, there is a diet shift to more general prey items with increasing size. This was supported by a SIAR mixing model with a consistent pattern in diet proportions independent of the DDF employed. The trophic level of the guitarfish is therefore considered to be a second-order predator based on the findings of this study.
SUPPLEMENTARY MATERIAL
The supplementary material for this article can be found at https://doi.org/10.1017/S0025315417000832.
ACKNOWLEDGEMENTS
We thank Edgar Alcántara-Razo, Araceli Ramos-Montiel, Jesus Padilla-Serrato, Esteban Pérez-Arvizu, Demetrio Rodríguez-Félix and Polo Figueroa-Alamea for help in fieldwork. Ira Fogel of CIBNOR provided valuable editorial services. We thank Juana López-Martínez for permitting us to collect samples at the BIP XII research ship and the fishermen of the ISMAR ship to collect samples. The fisheries and chemistry laboratories of CICIMAR provided facilities for samples. Yassir Torres-Rojas provided valuable advice on processing stable isotope samples.
FINANCIAL SUPPORT
This project was funded by the Consejo Nacional de Ciencia y Tecnología (CONACYT grant 48445: ‘Bases socioeconómicas y biológicas para la explotación sustentable de los recursos pesqueros del Alto Golfo’). F.V.Q. was a recipient of a CONACYT fellowship (235142). F.G.M. is a fellow of COFAA and EDI of the Instituto Politécnico Nacional.