1. INTRODUCTION
The NTA was born in 2004 out of a wide discussion among researchers who recognized the eminent impact of population dynamics and age structure on the economy. These researchers met in Berkeley, USA, at a workshop co-chaired by professors Ronald Lee and Andrew MasonFootnote 1. It stands today as a well-established empirical tool for understanding the generational economy, with data available already for 47 countries around the globe, matching in their aggregates the widely-used System of National Accounts (SNA).
The NTA recognizes in its most basic idea that there exists a relationship between individuals who have economic resources to give and those who need them. It stems from the irrevocable finding that people incur a life cycle deficit during their youth and old age, when their consumption exceeds their labor income, and a life cycle surplus during their working years, when their labor income more than covers their consumption. This rather simple but powerful finding creates an eventual resource reallocation between generations and across time that can be consistently quantified and linked to the economic evolution of every society.
The strength of this accounting project, and indeed its theoretical niche in life cycle theory, is that it adds another more subtle dimension to how we see economic flows. Whereas classic economic theories segregate the market into supply and demand, for instance, life cycle theory looks at the economy through the lens of age: dependents who need various forms of financing to survive and thrive, and workers who finance them. The magnitude of these flows when seen through age is remarkable. In 2003, children in the USA were the recipients of a total sum of private transfers, both inter and intra household, equivalent to 9% of the country’s nominal GDP; Indian children, on the other hand, enjoyed a much larger portion, equivalent to 15% of their country’s GDP. Although the elderly in Germany, for example, continue to be net givers of private transfers, however small, they received public transfers equivalent to 10% of the country’s GDP in 2004, which is starkly different to the meager 1% received by Mexican elders. These flows, captured by the NTA in a standardized manner are emblematic of not only demographic differences between countries, but also of the varying roles of the state, the markets and of courses families, all of which influence resource reallocations.
The rest of this article is structured as follows: Section 2 gives the history and the context that lead to the eventual creation of the NTA; Section 3 shows how the flows are quantified and how the data is collected; Section 4 scans the general key findings of the work that has been done by the various teams around the world; Section 5 tackles some of the limitations and challenges facing the project, and finally; Section 6 concludes.
2. CONTEXT AND HISTORY
The impact of population dynamics on the larger economy has gained much traction during the 20th century. Despite the much earlier work by Malthus (Reference Malthus1798) on the negative and cyclical relationship between population growth and income per capita, demographers and economists of the 20th century paid closer attention to understanding the particular characteristics, determinants, and consequences of demographic change, in an attempt to draw general trends of population change and effect.
In his pioneering work, Thompson (Reference Thompson1929) argued that there exists a relationship between a country’s demographic phase, seen through birth and death rates, and its industrial (or economic) development. Countries more advanced in their industrial development, with falling fertility and mortality rates, for instance, as seen in Western Europe at the time, would face an eventual decline in their populations. Those with neither of these two rates falling, seen in Japan, India, and Russia at the time, would face a Malthusian trap. Landry (Reference Landry1934), coming not long thereafter, noted similar demographic shifts based on birth and death rates and was the first to coin the term “demographic revolution,” later known as the “demographic transition,” based on the idea that there exists a general population path that all countries experience as they move from high fertility and mortality regimes to low ones (Kirk, Reference Kirk1996).
Towards the second half of the 20th century, however, concern grew among academics and politicians about the rapid population growth rates seen and recorded worldwide. Between 1950 and the early 1970s, world population grew at an average of 2% per year reaching 3 billion inhabitants by 1960. While it took the modern world more than 1,800 years to reach its first billion inhabitants, it took it only 125 years to reach its second billion and merely 30 years to reach its third, spurring a much heated debate on the developmental consequences of such rapid growth rates, particularly for low-income countries. Thinkers of the time warned of potential food and land shortages as demand increases, of the deterioration of income per capita and capital formation, of the potential rise of unemployment, of the degradation of natural resources and the general plummet of human welfare. Coale and Hoover (Reference Coale and Hoover1958), for example, took the particular case of India at the time to warn of these consequences. The Pearson Report (1970) alluded to the effect on poverty and recommended explicit aid for low-income countries to control and stabilize their population growth rates. The Rockefeller Commission (Population and the American Future, 1972) stressed issues relating to population density and resource scarcity in the US, informing policy on the role of education, child care services and family planning.
The World Bank policies from the 1970s onwards, in fact, strongly supported this rather pessimistic view of global population growth and focused noticeably on funding and managing family planning and education programs in low-developing countries. The fear of the effect of population growth on economic development was perceived in a noticeably somber manner, despite the work of Boserup (Reference Boserup1965) in the 1960s, for instance, who argued that population growth and density rates were among the main factors of technology take-up rates and the kick-start of modern development, and despite also the much earlier work of Clark (Reference Clark1940) who argued that until a society reaches some level of population density that provoked agricultural development, civilization and economic progress would not be possible.
Indeed, the World Bank’s literature at the time seemed to have been dominated by the view that population growth control is a necessary condition to sustain human welfare and human rights (see the World Bank internal working papers published in the late 1960s and early 1970s, World Bank (1968) and Population Planning (1972)). Such world views eventually culminated in the World Population Plan of Action (1974), published following the United Nations’ World Population Conference, outlining some of the main concerns of population increase and the need for national and international policies to curb its negative consequences.
However, as the world population growth rate reached its peak in the mid-1960’s, international concerns shifted towards another issue: population aging. In the Western world in particular, old age dependency ratio increased from only 12% in 1950 to 21% in 2000 and 24% in 2010, raising pressing questions about issues such as healthcare and retirement costs.
Recognizing the influence of population growth and age structure, economic theoreticians began to incorporate demographic structure to what became classical macroeconomic models. Among the most notable of such works were those of Allais (Reference Allais1947) and Samuelson (Reference Samuelson1958) who pioneered the so-called “overlapping generations model” (OLG) where the economy was seen through the lens of several generations, and more importantly where the role of intergenerational transfers takes particular prominence.
In Samuelson (Reference Samuelson1958), for instance, the fact that agents are driven by the desire to smooth their intertemporal consumption, knowing their retirement obligation, prompts a trade (or exchange) between generations at each point of time based on the social contrivance of money, which unequivocally influences equilibrium interest rates and savings. Inspired by this approach, Diamond (Reference Diamond1965) incorporated capital into the OLG set-up and concluded that restoring consumption optimality, if not through fiat currency, can also be achieved through public debt and Pay-As-You-Go pension systems – both of which still forms of intergenerational transfers (see Weil (Reference Weil2008), and de la Croix and Michel (Reference de la Croix and Michel2002) for further details).
These macro models were, in fact, preceded years earlier by a micro-based model developed by Modigliani and Brumberg (Reference Modigliani and Brumberg1954), now widely known as “life cycle theory” who argued that individual choices of consumption and saving, based on known periods of work and retirement, influence national savings and spur the exchange between generations. This becomes particularly relevant for a growing population where the savings of the young, who are continuously larger in number, exceed the (dis)savings of the old, thus generating higher rates of economic growth (see Deaton (Reference Deaton2005) for more on the life cycle hypothesis).
Gradually, demography became an integral part of many more economic models, deliberately incorporating age and death (or survival) rates as crucial elements. Yaari (Reference Yaari1965) notably developed a life cycle model where the probability of survival is deliberately included as an uncertainty that influences a consumer’s utility, asset accumulation and optimal consumption plan. Arthur and McNicoll (Reference Arthur and McNicoll1977) incorporated for the first time detailed mathematical demography into an economic growth model in order to obtain optimal savings and fertility paths. Their work emphasized the importance of treating the population as a succession of life stages, each differing in characteristics and economic behavior. A year later, they expanded Samuelson’s model to also include this mathematical demography and showed more explicitly the effect of intergenerational transfers in offsetting the decrease of capital per person as the population grows at a constant rate (see Arthur and McNicoll (Reference Arthur and McNicoll1978)).
Given this context, Lee (Reference Lee1980) and Lee (Reference Lee1994) published a comprehensive life cycle model that looks at the aggregate consumption, savings, transfers, and government debt based on demographic tools, accounting for birth and survival rates and basing these on individuals and households as the unit of analysis. Considered today as one of the main building blocks of the NTA, Lee’s model drew a theoretical relationship between intergenerational transfers and population growth, and between the latter and overall economic growth. “If consumers are on average older than earners,” he wrote, “then more rapid growth, by ‘younging’ the population, makes more consumption possible.” From the individual’s point of view, a more rapid population growth raises the interest rate; if people on average consume later than they earn, a higher interest rate enables them to consume more. With higher population growth rates, Lee’s model dictates that society must save more to avoid further dilution of the capital-labor ratio. This theoretical framework has been expanded in a series of articles and is still developing. Willis (Reference Willis, Lee, Arthur and Rogers1988), some years later, for instance, concluded using many overlapping generations that equilibrium interest rates would always exceed population growth rates, therefore hindering the idea that money would be used as a store of value. d’Albis (Reference d’Albis2007) has also recently shown that capital dilution is not a definite consequence of population growth as it would depend on the difference between the average age of those holding capital and the average age of workers.
Economists also began to look empirically at the impact of age structure on general economic growth and economic flows. Lindh and Malmberg (Reference Lindh and Malmberg1999), for instance, tested the impact of age structure on economic growth using data from the OECD for the period 1950–1990, in an age-structure augmented neoclassical growth model with technical adjustment, and found that the expansion in size of the age group of 50–64 years old had a positive influence on overall economic growth, whereas that of the age 65 years and older had a negative effect, and the very young had an ambiguous effect that varied between countries. Bloom et al. (Reference Bloom, Canning and Malaney2000), in their series of studies on the impact of the demographic dividend on the economy, estimated that a third of the growth of the Asian “miracle” economies was due to favorable age structure; the working-age population grew significantly as fertility rates declined and as both young and old age dependency ratios decreased. A year later, Bloom et al. (Reference Bloom, Canning and Sevilla2001) further generalized the importance of age structure on economic growth (and a successful demographic dividend). They drew on a set of country experiences and emphasized the role of an appropriate policy environment to reap the benefits of favorable age structures.
Changing age structure, particularly with the looming retirement of the US baby boomers, also motivated the investigation of its impact on asset returns. Brooks (Reference Brooks2002), for instance, noted that asset returns moved with the baby boom generation, putting them in a better-off position in terms of lifetime consumption despite lower returns during their retirement age. Poterba (Reference Poterba2001, Reference Poterba2004) and Abel (Reference Abel2001) argued, that there is little theoretical and empirical evidence of asset price meltdowns as younger generations became smaller in size.
Amid this theoretical and empirical interest came the need for a relevant and encompassing database that links economic variables to past, present, and future age structures. The first of such age-structure driven databases is attributed to what came to be called “Generational Accounting,” developed by Auerbach et al. (Reference Auerbach, Gokhale and Kotlikoff1992). Driven by concerns about the coming retirement of the baby boom generation in the US and consequent population aging, the authors proposed the incorporation of generations’ present expected value of lifetime net payments to the government into public deficits, public debt, and general fiscal policy. This approach, the authors argued, would allow for a better assessment of fiscal policy’s redistributive and savings effects on each generation’s financial receipts and obligations, and therefore better estimating welfare effects.
Although the system of generational accounting has been applied to several country cases by governmental and research institutions (for example Agulnik et al. (Reference Agulnik, Cardarelli and Sefton2000), Chojnicki and Docquier (Reference Chojnicki and Docquier2007), Chojnicki and Rabesandratana (Reference Chojnicki and Rabesandratana2013), and more recently Narayana (Reference Narayana2014)), there were several limitations that halted its wider implementation. Among its key technical difficulties was the choice of the discount rate, for instance, which is a debatable subject, particularly as the analysis extends further and further into the future. Generational accounting, as noted by Kotlikoff (Reference Kotlikoff1995), also does not include general equilibrium effects of fiscal policies and therefore would offer only an approximation of true welfare effects. A third relevant critique noted by Haveman (Reference Haveman1994) emphasized the absence of individual behavioral change in response to fiscal policies, such as the change of labor supply and the choice of bequest, which thus limited the model to static effects. Neither does the system account for private intergenerational transfers that can off-set fiscal policy.
The NTA project comes into this context to quantify the allocation of economic resources between ages, in a unified and standardized manner. The NTA introduce age to the aggregate data, therefore filling the gap that exists in the SNA. It disaggregates its major components of income, consumption, and savings by age, and marks the essential role of intergenerational transfers.
These accounts, when completed, can shed light on the role of the institutions of government, family, and markets in the reallocation of resources across ages. The accounts capture both public and private age reallocations and provide real estimates of intergenerational flows – these flows that had been of interest to researchers and policy makers for many decades as alternatives or complements to public policy.
The NTA project, therefore becomes particularly useful when analyzing a wide range of issues such as social security and pension systems, human capital accumulation, intergenerational equity, and even migration, through a standardized dataset available for many countries around the world.
3. METHOD AND DATA
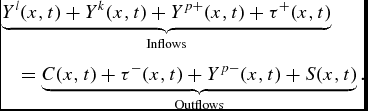
The NTA are based on an age-specific flow identity capturing economic flows at each point in time. Variables are indexed by (x, t), which respectively denotes the age of an individual and the relevant time period. This flow identity can be seen as an aggregate budget constraint for individuals of age x, as is seen in life cycle models,
 $$\begin{eqnarray}
&&\underbrace{Y^l(x,t) + Y^k(x,t) + Y^{p+}(x,t) + \tau ^+(x,t)}_{\text{Inflows}}\nonumber\\
&&\quad = \underbrace{C(x,t) + \tau ^-(x,t) + Y^{p-}(x,t) + S(x,t)}_{\text{Outflows}}.
\end{eqnarray}$$
where Yl is the value of labor income inflow received for age (or age group) x at time t, Yk is capital income inflow, Yp is property income flow, received as denoted by ( + ) and spent as donated by ( − ), τ is the flow of transfers net of paid taxesFootnote 2 also received and spent, C is consumption and finally S is savings resulting from the residual between the various types of income net of consumption. These variables are the sum of both public and private flows, capturing at the same time those that are domestic and international.
This flow identity can be re-arranged to show the economic life cycle for each age and consequently the mechanism by which resources are reallocated across these ages,
 $$\begin{equation}
\underbrace{C(x,t) - Y^l(x,t)}_{\text{Lifecycle Deficit}} = \underbrace{\underbrace{\tau ^+(x,t) - \tau ^-(x,t)}_{\text{Net Transfers}} + \underbrace{Y^A(x,t) - S(x,t)}_{\text{Asset-based Reallocations}}}_{\text{Age-Reallocations}}.
\end{equation}$$
This identity illustrates that the economic life cycle deficit (or surplus) is funded by (or distributed through) transfers and asset-based reallocations for each age at each point in time, where asset income inflow, denoted by YA, is the sum of capital and net property income.
The life cycle deficit is a key concept of the generational economy. It is the difference between consumption and labor income for every relevant age (or age group), where consumption includes households’ public and private consumption of various goods and services, of which are public and private education and healthcare for example, and where labor income encompasses employees’ earnings including fringe benefits, as well as self-employment and unpaid family workers’ incomes.
The NTA trace the dynamics of this deficit through three distinct periods of individuals’ lives: life first begins with a deficit as children do not work, thus consume more than they produce; this period is then followed by years of surplus as individuals enter working-age and begin to accumulate wealth, therefore producing more than consuming; and finally a period where individuals fall back into deficit as they enter retirement or continue to work but with earnings insufficient to cover their consumption. Working-age individuals, who enjoy life cycle surpluses, not only fund their own consumption but also provide transfers and asset-based reallocations for children and the elderly. These stages differ between countries in size and duration. Figure 1 shows the life cycle deficit for several economies around the globe, expressed as a percentage of average labor income for those aged 30–49 years oldFootnote 3.
Consumption, labor income, and life cycle deficit, as a percentage of per capita labor income of 30–49 year olds for four countries.

Transfers are defined as the flow of economic resources that are not quid pro quo, meaning without any form of expected return or exchange. They can be in whatever direction, from youth to old age or from old age to youth. Public transfers include expenditure incurred by the government on public education, healthcare services, and unfunded pension plans, whereas private transfers include private education and healthcare services for which individuals pay, in addition to various forms of bequests and donations. However, whereas most forms of transfers are captured by the NTA, bequests, and inter vivos gifts are not yet accounted for due to difficulties in measuring and quantifying them – while still acknowledging their importance as a form of inter-generational transfers.
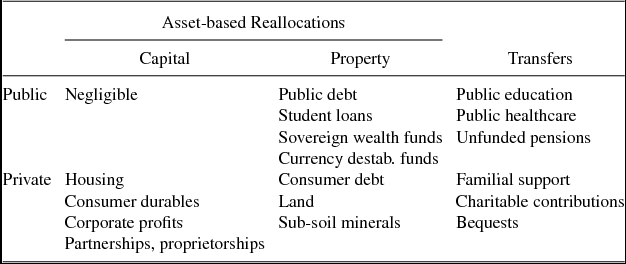
As for asset-based reallocations, the NTA defines them as economic sources that can be accumulated and dis-accumulated and can yield some income for current and future generations. These reallocations are divided into capital and property incomes. Capital income reallocations include reproducible material wealth and is achieved through investments. Public capital includes building infrastructure, for example, whereas private capital reallocations can be seen through the purchase of housing units and consumer durables, through corporate profits, and through the profits of business partnerships. These investments would have been made throughout time and their income and benefits are theoretically reaped by individuals of various ages. Capital is therefore a significant tool of reallocating resources and assets across time and various ages. People may invest during their youth and reap the profits of their investments (and dissave) during old age.
Finally, property (or Intertemporal Exchange) is associated with the trade of non-reproducible economic resources, such as natural resources and interest from these resources like rent and royalties. Public property income examples include public debt, sovereign wealth funds, and currency stabilization funds. Private property, on the other hand, includes consumer loans, land and subsoil minerals such as gold. The flow of individual savings, be them positive or negative, is part of asset-based reallocations. Table 1 shows the classification of the various variables.
To better illustrate how transfers and asset-based reallocations fund the life cycle deficit, Figure 2 shows the decomposition of this funding for every age in the US, Costa Rica, France, and India, corresponding to the life cycle deficit shown in Figure 1. The figure illustrates that while the young depend primarily on public and private transfers to fund their transfers, the elderly’s funding sources look less uniform across these countries. Whereas French elderly depend significantly on public transfers still, for example, the elderly in India barely use such a source, and those in the US utilize more asset-based reallocations. In all countries, the working-age populations are net-receivers of private asset-based reallocations to various extents.
Funding the per capita life cycle deficit in several countries.
To empirically capture the variables of the NTA flow identity, researchers rely upon a set of country data sources. Household surveys, for example, and labor force surveys in some cases, are used for the initial-level micro data. Together with an extensive reliance on administrative records, they constitute the foundation of the NTA. These surveys, often conducted consistently and representative of the overall population, provide details on individuals such as their year of birth, their consumption of private goods and services (by distinct categories), their paid taxes, the transfers that they make and receive, as well as details on sources and sums of private income like wages, property income, dividends...etc. These rather detailed surveys are used as a first step to construct consumption and income profiles by age for the whole economy.
The NTA, however, uses additional assumptions to complete these profiles. An equivalence scale, for instance, is used to allocate consumption from the household level in the survey to the individual level. The scale begins at 0.4 for children aged four years or younger, increasing linearly until the age of 20 to reach 1.0 and held constant thereafter. Public expenditure on broad non-age related areas such as defense and infrastructural projects, on the other hand, are presumed to be shared equally among all individuals in society.
The Accounts also make several assumptions relating to income. First of which is that labor earnings shown in these profiles (as well as consumption) are pre-tax. Taxes and subsidies on products and services are allocated between these components depending on the type of tax. For example, a value-added tax is a consumption tax and is therefore included in consumption, whereas a payroll tax is included in labor income.
The NTA also have to make several assumptions regarding self-employment income and the income of unpaid family workers. Often times these incomes are captured as a general household income in surveys and very commonly attributed to the household head, therefore running the risk of underestimating the incomes of the youth and possibly the elderly who have a higher likelihood of earning these types of incomes. The Accounts, therefore, assume that self-employment income (and unpaid family workers) is about two-third of mixed income as it appears in the SNA (consistent with work done by Gollin (Reference Gollin2002)), with the last one-third treated as capital income. This employment income is then allocated across those family members who report themselves as self-employed or unpaid family workers. The treatment of labor income in this sense is largely in line with the SNA.
Moreover, recognizing that some housing units are owner-occupied whereas others are rented, the NTA estimate “imputed rents” for owner-occupied units and classifies the flow of services from these units, captured through rental prices of similar properties, as consumption. These imputations, sometimes already provided in household surveys, ensure that housing unit expenditure is captured for all individuals and households, regardless of whether the individual owns or rents, and are incorporated at the same time as his/her private asset income.
To complete the picture, private savings are usually treated as a residual between the life cycle deficit and age reallocations. The treatment of remittances, as part of private transfers, on the other hand, differs based on whether the person is a resident inside or outside the country: remittances from a worker that is considered permanently abroad is included as an inflow from the rest of the world (ROW), for example, whereas remittances from a resident who is temporarily abroad is included as labor income to the household to which they belong. The distinction between the two is based on the country and depends on the length of the work contract of the person living abroad.
At the same time, recognizing that surveys do not capture the full set of age-specific flows, the NTA also relies on regression methods, especially in the estimation of private and public education and healthcare consumption. Private education expenditure, for instance, would be regressed on household member composition, ages, and dummies for enrollment in education. The coefficients of consumption could be further restrained depending on the schooling system of the country (for example if primary school is mandatory). Private healthcare expenditure, however, is a more complicated estimate because surveys often include out-of-pocket expenditure whereas the full extent of healthcare spending would require detailed information from health care providers. The NTA nevertheless use a similar method of regressing household healthcare expenditure on household member composition, ages and the number of inpatient and outpatient numbers within the household. Some other methods are also used depending on the country and the extent of available information.
For public education and healthcare, on the other hand, administrative records make the most reliable source. Public education, for instance, is calculated as the cost of school per child at each age times the enrollment rate (for more technical detail, see the NTA Manual (2013)).
The age profiles, per capita, thus, incorporate these assumptions and are then smoothed to reduce data noise. The smoothed profiles are finally adjusted using macro controls, meaning that they are essentially re-scaled with a case-based multiple so that the NTA aggregates match the aggregates of the SNA for each country.
3.1. Support Ratios and the Demographic Dividend
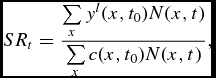
The availability of age-specific data with the NTA allows for a more acute investigation of the influence of age structure on various economic variables, compared to more general measures such as dependency ratios. The support ratio (SR), which is the ratio of the effective number of producers to the effective number consumers, weighed by labor income and consumption, respectively, is one such measure that the NTA data can quantify, and is considered a summary measure of the influence of age structure on production and consumption – while holding other potential factors constant such as effect on work effort, on interest rates, savings...etc. It essentially captures the relationship between those who are supporting the economy through production to overall consumption, and can be defined as the following,
 $$\begin{equation}
SR_t = \frac{\sum \limits _x y^l(x,t_0) N(x,t)}{\sum \limits _x c(x,t_0) N(x,t)} ,
\end{equation}$$
where yl(x, t 0) and c(x, t 0) are per capita labor income and consumption for persons of age (x) at the base year t 0. These variables, assumed time-invariant for the purpose of this ratio, depend on a multitude of factors such as physiological needs and abilities, culture, preferences, and in the case of labor also productivity. They are then weighed by the historical and projected population of the relevant age at each point of time N(x, t).
The SR can be used to determine the evolution of the demographic dividend as Mason and Lee (Reference Mason and Lee2006) illustrate. The authors argue that the first demographic dividend occurs when the growth rate of effective producers exceeds the growth rate of effective consumers, following g(SRt) = g(Ylt) − g(Ct), where Yl is the aggregate labor income, and C is the aggregate consumption, and where a rise in the ratio indicates a period of a “demographic window” during which countries have the opportunity to accrue more rapid growth. The impact of fertility decline that induces this dividend on the standards of living can be assessed using this SR, as well as other measures (Lee et al. (Reference Lee and Mason2014)).
The SR is also a determinant of income per effective consumer in the economy so that  $y_t = SR_t \bar{y}^l_t$ where
 $\bar{y}^l_t$ is income per effective worker. This is similarly applied to consumption per effective consumer so that
 $c_t = SR_t \bar{c_t}$ where
 $\bar{c_t}$ denotes consumption per effective worker. These equations can be expressed in terms of growth rates as seen above to determine the extent of consumption and income growth rates in relation to the growth rate of the SR.
The full extent of the demographic dividend, outside of these accounting effects, are often assessed through lifetime savings and wealth effects, utilizing similar equations as seen above. The second demographic dividend, which takes into account increased productivity levels in the economy, are also assessed using these wealth effects, as in Mason and Lee (Reference Mason and Lee2006) and Prskawetz and Sambt (Reference Prskawetz and Sambt2014).
4. KEY FINDINGS
The creation of the NTA as a standardized and detailed dataset spurred a number of country-specific and cross-country research that have been able to trace general trends as well as peculiarities within countries.
The main findings of the NTA support, unsurprisingly, the intuition behind the life cycle theory. That is, in all countries of the dataset the working-age populations enjoy a life cycle surplus that not only funds their own consumption and savings, but also aid, if not fully cover, the life cycle deficit of children and elderly through transfers and asset-based reallocations.
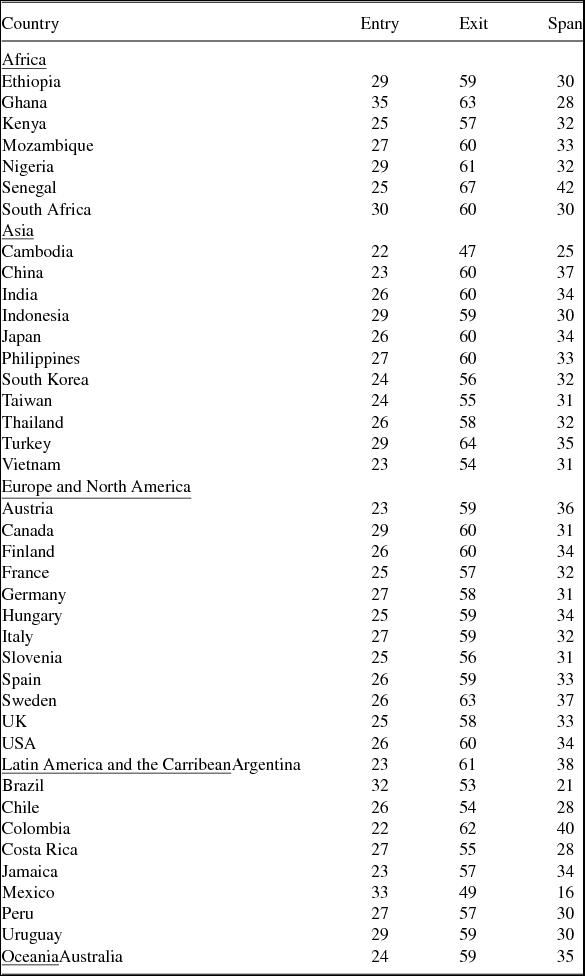
Although no country steers away from this common picture, there exist some regional trends. The duration in years in which a person enjoys a life cycle surplus, for instance, and the ages at which he/she enters into and exists from this surplus vary between countries and regions, reflecting among many things educational and labor market differences (Table A.1 shows this in detail).
An individual living in Europe and North America, for example, can expect to start accumulating a life cycle surplus for the first time in his/her life around the ages of 25–27 years old – this is usually a few years after finishing secondary and higher education. The only notable exception in the dataset for this region is that of Austria where the age of entry into the life cycle surplus is around 23 years, influenced by the country’s strong apprenticeship culture that offers an earlier opportunity into the labor force. These productive surplus years continue until individuals in these countries arrive at their late 50s, at which point they transition into an often well-established retirement program, making the duration of their suplus over 30 years in total. Outside of this norm is Sweden, where an individual exits the surplus and begins to accumulate later age deficits at the age of 63 years old, reflecting workers’ longer stay in the labor market and bringing up the total surplus span to 37 years, which is nearly half of life expectancy at birth for the country.
This picture looks markedly different for some other countries. Whereas some Latin American countries such as Peru and Uruguay have similar surplus spans to those of Western countries, Brazilians expect to produce more than they consume for the first time at the age of 32 years old – an age that is exceeded only by Ghana in the dataset – exiting this surplus at 59 and making their suplus duration no more than 21 years. Mexico marks an extreme case of the shortest surplus duration of only 16 years, where individuals re-enter into a deficit at the young age of 49 years old. Asian and African countries do not have a markedly different trend from that seen in Western countries.
However, while cut-off ages and surplus duration are critical for some age-specific policy, they are not necessarily indicative of the extent of the surplus and its size compared to the deficit for each individual during his/her lifetime (Figure 3). For instance, while Italy, the UK, and the US have similar surplus duration to other Western countries, around 30-some years, an individual in those countries can cover less than half of his/her lifetime deficit with this surplus, meaning a deficit-to-surplus ratio of more than two – whereas a German, on the hand, produces more than he consumes for a similar duration but is able to cover more than half his lifetime deficit. Similarly, while the duration of life cycle surplus is about 40 years in Colombia, one of the highest in the dataset, a Colombian still expects to make the same deficit-to-surplus ratio as that incurred by a person in the Philippines who enjoys a surplus for a smaller period of 32 years, or a person in Ethiopia who accumulates a surplus for only 30 years. China is the only country in the dataset today where a person expects to make more life cycle surplus in his/her lifetime than a deficit, noting a deficit-to-surplus ratio of 0.78 only, compared to the extreme case of Mexico where this ratio stands at 19.5. Still, the data shows a generally negative relationship between surplus span and the deficit-to-surplus ratio, meaning that adding extra years of life cycle surplus, regardless of the sum earned in those years, influences how much an individual is able to cover his/her lifetime deficit.Footnote 4
Life cycle surplus span to lifetime deficit-to-surplus ratio, by country.
The magnitudes of these life cycle deficits and surpluses are influenced by the levels and trends of labor income and consumption, both of which considerably vary between countries. Every country has its own set of labor market conditions, wages, working hours, labor productivity, retirement, education, and healthcare systems – all of which plus more determine the extent of the deficit or surplus at every age.
A particular interest to a number of researchers has been the extent to which the elderly can work, earn, and contribute to overall labor income in the country. Lee and Ogawa (Reference Lee, Ogawa, Lee and Mason2011a) found significant differences among NTA countries in the elderly’s share in total labor income for the countries. They found that while in countries like Nigeria, Indonesia, the Philippines, Mexico, and the US the elderly contribute between 7–11% of overall labor income in their countries, in most other countries and particularly European ones this share does not exceed 2%. In fact, the elderly in the Philippines show a particularly high contribution to the country’s labor income to a point of near self-sufficiency; their own labor and self-employment earnings cover 73% of their consumption (Racelis and Salas, Reference Racelis, Salas, Lee and Mason2011). The elderly in Indonesia, despite improving pension and retirement systems, also highly depend on their own labor income, both in rural and urban areas (Maliki (Reference Lee and Mason2011), Lee and Ogawa (Reference Lee, Ogawa, Lee and Mason2011b)). In India, Narayana (Reference Narayana2011) argues that the ability of the elderly to fund their own consumption through informal employment and self-employment, particularly in agricultural and service sectors, is a main contributor to the reduction of life cycle deficits of 60+ year olds. European countries, on the other hand, along with Japan and most other NTA countries, have a rather small elderly share of total labor income, influenced primarily by well-established and sometimes mandatory retirement systems, as well as tax systems that limit the extent of elderly labor force participation. Lee and Ogawa (Reference Lee, Ogawa, Lee and Mason2011a) argue in the same paper that an increase in the retirement age, even by as little as two years, can have significant effects on the life cycle deficit at later ages in life, even in developing countries with high self-employment rates.
Indeed, with increasing life expectancy in most developed and now developing countries, Mason and Lee (Reference Mason and Lee2013) argue that its effect on consumption is larger than on labor income (or labor force participation), owing to some extent to non-changing retirement ages, and in some cases early retirement options that limit the extent of labor income later in life.
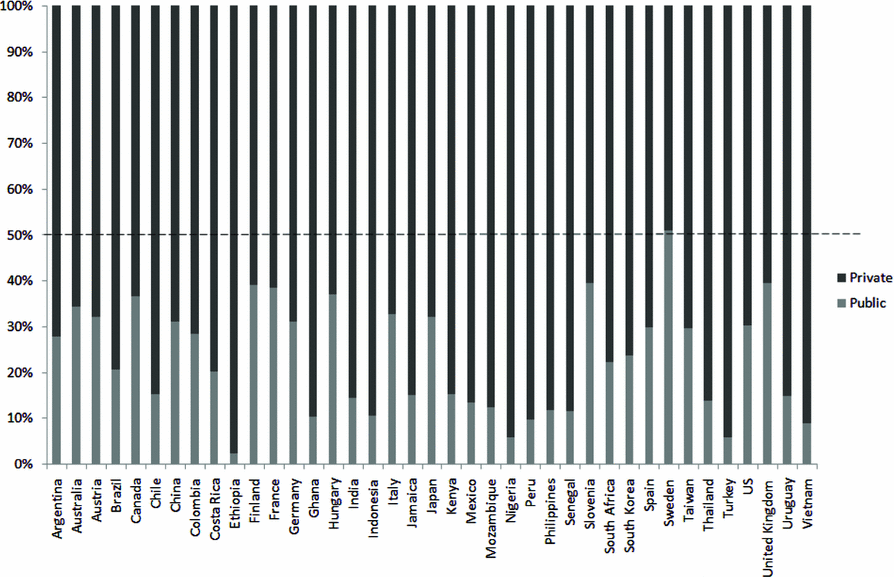
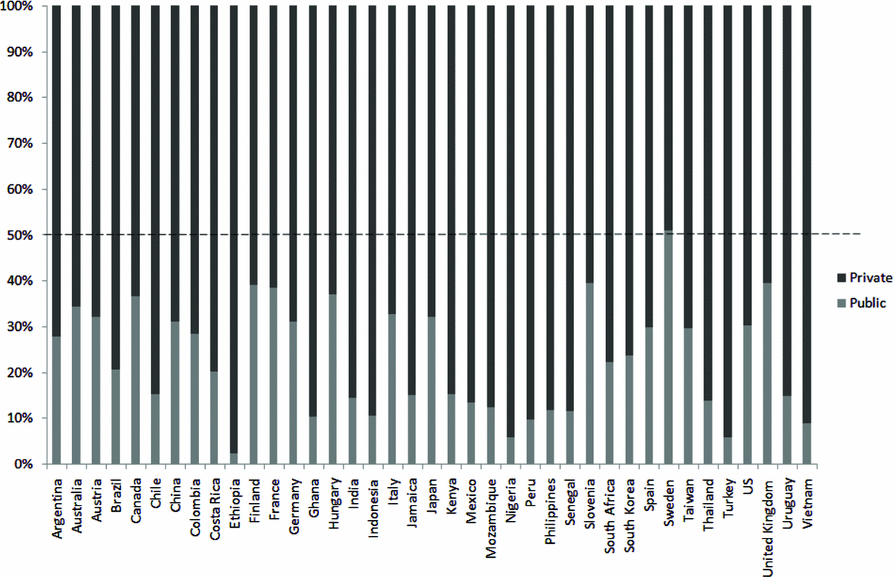
The size and type of consumption, which is the other contributor to life cycle surpluses and deficits, also differ markedly between countries and towards which age group it is mainly directed. While all age groups, for example, have more private than public consumption per capita, the extent of the sectors’ contribution to total per capita consumption varies. For children, defined as those aged 0–19 years old, the ratio of public consumption to total consumption per capita is much higher than that for the elderly or for the working-age population (Figure 4). This is influenced by spending on education and early childhood healthcare. In Austria, Finland, France, Hungary, Italy, Slovenia, and Sweden, this ratio of public-to-total per capita consumption is more than 50%, with the highest being Sweden at 65%. To the contrary, children in Ethiopia, Nigeria, Turkey, and Vietnam have less than 20% of their total consumption from the public sector.
Consumption by sector as a share of total for children (0–19 years old), by country.
The elderly, on the other hand, depend far more on private consumption than on public (Figure 5). More than a third of per capita consumption of the elderly in Australia, Canada, Finland, France, Hungary, Slovenia, and the UK come from public consumption – with Sweden’s elderly depending on the public sector for more than 65% of their consumption. Similar to the children’s age group, the elderly in Ethiopia, Nigeria, Turkey, and Vietnam barely have public consumption, with ratios less than 10% – indicating the importance of private consumption in sustaining their living.
Consumption by sector as a share of total for the elderly (65+ years old), by country.
Figures 6 and 7 show the consumption of children and elderly as a ratio of the consumption of the working-age population, in per capita terms and divided by sector for each country. Points to the left of the 45-degree diagonal line indicate that children on average consume more than the elderly, and vice-versa for points to the right of the line. Looking at the data in per capita terms is particularly useful here to minimize the influence of each country’s age structure in the comparison.
Per capita public consumption of children and elderly as a ratio of per capita consumption of the working-age population, by country.
Per capita private consumption of children and elderly as a ratio of per capita consumption of the working-age population, by country.
While many developed countries still designate a larger proportion of their public spending towards the children’s group than towards the elderly (take for example Italy and France), in Thailand and Indonesia, children’s per capita public consumption is more than twice that of the working-age, whereas their elderly consume public goods and services less than 1.5 times the average public consumption of the working-age. This is, as mentioned before, driven by investments in education that are not, as Tung (Reference Tung, Lee and Mason2011) argues, necessarily related to the income level of countries. It is noticeable also that the majority of the countries to the left of the diagonal line are generally developing nations with young populations, whereas those to the right of the line are nations characterized by relatively older populations. Countries like Nigeria, Brazil, Finland, Canada, Sweden, and to some extent Japan fall almost on the line. It is worth noting that consumption by age is reflective of the physiological differences between the age groups – the fact that per capita consumption of children is lower than that of adults, for example, is only natural.
Still, however, the elderly’s per capita private (and total) consumption as a ratio of the working-age’s is much larger than that of children (Figures 7 and 8). Note, for instance, the high average consumption of the elderly, compared to average consumption of children, in countries like Japan, the USA, Brazil and Germany. This is to a large extent a reflection of cultural and institutional norms of the countries, but also of the availability and generosity of the public healthcare system in the face of an aging population. In the case of France, d’Albis et al. (Reference d’Albis, Bonnet, Navaux, Pelletan, Toubon and Wolff2015) find that while consumption gradually increases from the beginning of life until the age of 17 years old, overall consumption has been relatively stable in the country for many years, unlike many of its European neighbors. This is particularly attributed to a change in the composition of consumption at old age from private to public, influenced by the country’s encompassing public healthcare system.
Per capita total consumption of children and elderly as a ratio of per capita consumption of the working-age population, by country.
This significant share of elderly consumption in all countries has triggered much research on the elderly’s support systems. Indeed, how the elderly finance and sustain themselves is of major concern, to both aging and currently young populations. The three common tools to support the life cycle deficit, which the NTA quantifies, are: public transfers, private (or familial) transfers and finally assets (or asset-based reallocations). Figure 9Footnote 5 shows the extent to which every country’s elderly rely upon these tools, eliminating the influence of age structure on the data and therefore allowing for a better comparison.
Sources of funding the life cycle deficit for persons 65 years and older for 21 countries, as a share of life cycle deficit.
This diagram shows that the elderly in a significant number of countries in the database are net givers of private, or familial, transfers. This includes countries like Mexico, the USA, Spain, Uruguay, Germany, Peru, and Brazil, whereas Asian countries, on the other hand, rely more on familial transfers to fund their living than others in Europe and Latin America.
Brazilian elderly, though net givers of these private transfers, depend almost exclusively on public transfers to fund their living. This is a trend also seen in Peru, Hungary, Slovenia, as well as Germany and Argentina. Public transfers as a funding source, however, is meager in countries like Thailand and the Philippines. For South Koreans, the funding sources are more equally split, with less than a third from family transfers, less than a third from public transfers and more than a third from asset-based reallocations. Argentinian and Hungarian elderly, on the other hand, are net givers of asset-based reallocations; they depend to a large extent on public transfers. Asian countries in this dataset rely more on familial transfers than do other countries in Europe and Latin America.
These support systems vary with public institutions and cultural norms within countries. Ogawa et al. (Reference Ogawa, Matsukura, Chawla, Lee and Mason2011), for instance, argue that there has been deteriorating family support in Japan over the past few decades, with decreasing three-generational co-residence. Healthcare reforms also allowed for the insurance coverage of old-age care therefore alleviating the burden on children to care for their elderly. In Taiwan, despite the significant family support system, Tung and Lai (Reference Tung, Lai, Lee and Mason2011) find that the type of support received by the elderly can vary with their residence situation. Elderly residing with children, for instance, which is the case for about 60% of the elderly in the country, depend more on intra-familial transfers, whereas those residing with their spouses or grandchildren (what they call third generation) depend on their own asset resources. Those residing alone receive the majority of their income support from the government. In India, Ladusingh and Narayana (Reference Ladusingh, Narayana, Lee and Mason2011) highlight the elderly’s role in giving intra-household transfers, and the extent to which they still depend on their own labor and asset income to support their consumption. Indian elderly, in fact, rely very little on public transfers, and are in many cases negative net public transfers recipients due to the amounts of direct and indirect taxes that they have to pay.
In the majority of countries, the elderly continue not only to save, as is in line with previous works and findings, but also to be net givers of private transfers to younger generations. In Lee and Mason (Reference Lee, Mason, Lee and Mason2011), intergenerational private transfers continue to be strongly downward (from old to young) in every society. Lee and Donehower (Reference Lee, Donehower, Lee and Mason2011) find that the majority of private transfers are inter-household transfers, with some importance given to remittances in countries like the Philippines and Chile, where the elderly share the amounts they receive while continuing to work at later stages of their lives. In Brazil, where the elderly are the largest net givers, the authors argue that some children move in with their parents and are likely to receive transfers. The size of these private transfers differs between regions: rich Western nations make private transfers that are close to 25% of GDP, whereas Southeast Asian countries transfer higher amounts, of about 40%.
The direction of public transfers, on the other hand, differs between countries and regions (Lee and Mason, Reference Lee, Mason, Lee and Mason2011). South, Southeast, and East Asia, as well as the US, all have a downward flow of public transfers, meaning from the old to the young, whereas European countries and Japan have an upward flow. However, when weighed by the age distribution of the countries, public transfers remain downward in Asian countries only. The direction of the flow, the authors argue, is related to the country’s economic development and to the type and coverage of its pension institutions as is framed by the state.
In fact, Miller (Reference Miller, Lee and Mason2011) found a rise in the role of the state when it comes to reallocating public intergenerational transfers in most of the NTA countries, with a general increase in the weight of the public sector in the economy. The author shows that there exists a strong positive correlation between public transfers given to the elderly and those given to children – which is contrary to the intuition that governments respond to changes in age structures by reallocating resources between the two dependent groups. Miller argues that this may be due to political pressure on governments to increase taxes and give more to dependent groups, particularly as those groups cooperate to combat low income levels. South Korea is the only example that the author finds where the state responded to its changing age structure by switching from the emphasis on education spending for children to healthcare spending for the elderly.
Patxot et al. (Reference Patxot, Rentería, Romero and Souto2012) marked the generosity of the Spanish public transfers for the elderly, in what they call “backward intergenerational family transfers”, despite the fact that these elderly also receive significant family transfers. This long-standing skewed government policy, the authors argue, might have contributed to lower fertility rates for Spain with the financial burden increasing on younger generations.
Mason et al. (Reference Mason, Ogawa, Chawla, Matsukura, Lee and Mason2011) point to a trade-off between transfers (particularly public transfers) and asset-based reallocations, especially for the elderly. Middle-income countries and countries with weaker social welfare systems tend to rely more on asset-based reallocations. High fertility countries, and countries with higher cost per child such as Latin American countries, also have a higher reliance on assets to fund their own consumption and to fund some transfers. The authors also argue that the level of economic growth influences the extent of these flows, so that when the ratio of asset income to savings is high in the economy, the reliance on asset-based reallocations increases.
The extent of this reliance varies between countries, however. The largest flows are seen in Mexico and Indonesia (about 2/3 of total factor income), and a little less than two-thirds for the USA and the Philippines. In Sweden and Austria, asset-based flows are almost negligible. In proportion to the average labor income of 30–49 year olds, Brazil’s asset-based reallocations are the highest, about 21 times, with 13.5 times in Latin America in general, whereas it is 6.9 times in Asian countries and only 2.8 times in Western nations.
Recognizing the tradeoff between transfers and asset-based reallocations, and recognizing in turn that these reallocations are the only source of productive flows that can induce economic growth, Sánchez-Romero et al. (Reference Sánchez-Romero, Patxot, Rentería and Souto2013) argue that the aggregate stock of capital in Spain would increase until a peak in 2040, but deplete quickly afterwards. This is due to two linked phenomena: the first is when the baby boomers use their own personal incomes and the generosity of the Spanish transfers systems to save, and the second is when the “baby bust” generation receives these savings in inter vivos transfers, but consume them rapidly. The authors argue that when individuals expect more transfers received than paid, as would be the case for the baby bust generation in Spain, the economy would see a depletion of capital as individuals lose the incentive to save.
5. LIMITATIONS AND CHALLENGES
The NTA allows economists, demographers, researchers, and public policy makers to look at economic behavior and the evolution of economic flows in relation to age structure of not only their own countries, but also an increasing set of countries. The project, though itself is relatively young, has been able to produce numerous research papers and continues to contribute to understanding the impact of aging on the broader economy. It, nevertheless, naturally faces several limitations and challenges.
A first and perhaps most clear limitation is that the NTA age profiles are a cross-sectional analysis of individuals of various ages at a certain point in time. While they can be used to construct pseudo-cohort datasets, they do not trace the same individuals throughout their lives. Over the years, these profiles change, in response to differing economic and non-economic circumstances (see, Donehower (Reference Donehower2007) for U.S. profiles from 1888 to 2003, Racelis and Salas (Reference Racelis, Salas, Lee and Mason2011) for the Philippines from 1994 to 2002, and a brief note by Lindh et al. (Reference Lindh, Oeberg and Sánchez-Romero2011) for Sweden from 1800 to 2009). This means that the cross-sectional characteristic of the profiles limits the extent by which they can be seen as forecasts of economic behavior for future generations.
The extent and availability of survey data in every country also has significant impact on the construction of these profiles. The more representative, frequent and detailed the surveys are, the more accurate the profiles would become and the less re-scaling would be required. A technical critique of the NTA includes the fact that even with relatively representative surveys the number of observations for each age is not large, therefore limiting the accuracy of the results and the extent by which they can be generalized. The move from survey outcomes to aggregate results that match the SNA is also ridden with technical assumptions. For instance, while the NTA uses a smoothing technique to construct the final age profiles (usually Friedman’s Supersmoother), the general smoothing idea can be in some cases inadvisable because the discontinuity of the variables is by itself a distinct feature of some transfers such as retirement – making it important to preserve (refer to the NTA Manual (2013) Appendix B.1. for a further discussion on the role and rules of the NTA’s smoothing technique). The NTA also uses a multiplicative factor to re-scale the results to the SNA aggregate, a method that proportionally alters the age-profiles.
Recognizing the limitation of the data, the NTA needs to make several assumptions to bridge the gap, some of which are contestable. Although some variables in the data are individually assigned, some are attributed to the household, for example. The Accounts assume that some economic flows are received and handled by the household head, especially when individually-assigned data are not available. All assets are assumed to be held, and distributed, by the household head. Although these are simplifying and sometimes necessary assumptions, they nevertheless risk biasing the data by gender and by age.
The NTA also assumes, again due to the lack of better data, a common sharing rule for the consumption of goods and services inside the household. Rarely do surveys attribute private consumption to each individual and by each age. The sharing rule that the NTA assumes applies to all goods and services, to all households, and for all countries. This may be a wry assumption. Some goods and services, for instance, favor one age group over another, other goods and services may favor one gender over the other. Some goods are exclusive to certain members and others are nonexclusive. Chiappori (Reference Chiappori1992) also argued that the sharing rule would also depend on all prices of goods and services and all incomes in the household – all of which greatly differ between countries. It is influenced by the egoistic or altruistic preferences of members of the family and how sharing goods within the households factors into their utility function.
In Browning et al. (Reference Browning, Chiappori and Lewbel2013), sharing rules can also be seen as the relative bargaining power of each member within the household, which in turn influences levels and composition of household consumption. This bargaining power is itself a product of several factors such as the marriage market and divorce legislation (see Chiappori et al. (Reference Chiappori, Fortin and Lacroix2007) and Gray (Reference Gray1998)), labor market opportunities and the structure of the welfare state (Iversen and Rosenbluth (Reference Iversen and Rosenbluth2006)), wage rates (Pollak, Reference Pollak2005) and various others, all of which are not the same across countries, nor within countries in some cases. Much research has argued, for instance, that subsidies that target women impact significantly household consumption (see Lancaster et al. (Reference Lancaster, Maitra and Ray2006) on Indian women’s bargaining power and consumption in general, Osmani (Reference Osmani2007) on the influence of microcredit for women on household consumption, Attanasio et al. (Reference Attanasio, Meghir and Santiago2012) and Schultz (Reference Schultz2004) on Mexico’s Progresa program, Gitter and Barham (Reference Gitter and Barham2008) on women’s cash transfers in Nicaragua, and Rawlings and Rubio (Reference Rawlings and Rubio2005) for general impact of subsidies on bargaining power of women within the household). Moreover, economies of scale differ between households and countries. Deaton and Paxson (Reference Deaton and Paxson1998) found that per capita demand for food decreases with household size, especially in poor countries. Countries of the NTA do not have the same residence and co-habitation situations. This influences the sharing rule and influences overall consumption and utility. All of this research prompts the need for more rigorous and country-specific sharing rules (see also Lee et al. (Reference Lee, Lee, Mason, Prskawetz, Bloom and Lutz2008) for an extended discussion on this subject).
This highlights the importance of understanding household decision-making, which consequently influences individual profiles. Schultz (Reference Schultz2009) argued, for instance, that among the conceptual difficulties of the NTA is the lack of a behavioral model of family formation, of labor supply, fertility, and consequent human capital investment, and of savings and consumption. Incorporating such a model, a challenge in itself, could better quantify the consequences and extent of phenomena such as the demographic dividend in various countries as well as the real evolution of age profiles.
Increasingly discussed today are also issues relating to the quantification of home production and time transfers – both of which are neither included in the SNA nor the NTA. Although there may be some technical difficulties of quantifying these measures, it is clear to researchers their importance in accurately depicting economic flows, particularly at older ages.
Gronau (Reference Gronau1980), for example, found that the value of American womens’ home production in 1973 exceeded 60% of the family’s money income before tax, and 70% after tax. When the woman joined the market the loss of home production was almost equal to her monetary income. Using more recent data, House et al. (Reference House, Laitner and Stolyarov2008) found that the value of foregone home production stood at about 25% of women’s earnings in the U.S. during the 1990s and early 2000s as women moved towards more labor force participation. Moreover, although Ramey (Reference Ramey2009) shows that home production hours have decreased over time, she emphasized notable difference between rural and urban areas, the category of home production itself, the age group of the women, their employment and marriage status.
The absence of home production in the NTA profiles then can seriously underestimate the age profiles, particularly for women and increasingly for the elderly. Home production, for example, has been used to explain the so-called “retirement-consumption puzzle,” where it was noted that despite the seeming drop of the elderly’s consumption post-retirement, the time that they spent at home producing food and performing various other activities within the household effectively sustained their consumption levels by relying on different sources (Aguiar and Hurst (Reference Aguiar and Hurst2004) and Hurst (Reference Hurst2008)). The absence of home production in the profiles can also blind the NTA from some of its other important consequences. Zick et al. (Reference Zick, Bryant and Srisukhumbowornchai2008) and Frazis and Stewart (Reference Frazis and Stewart2011), for example, argued that household production can decrease income equality between households. Devereux and Locay (Reference Devereux and Locay1992) argued that the absence of home production in economic growth measures biased these measures upwardsFootnote 6.
Time transfers between individuals and households, on the other hand, has also attracted much attention in the past few years, known within the NTA framework as the NTTA (National Time Transfer Accounts). Although it has been theoretically developed by Becker (Reference Becker1965) a number of decades ago, the availability of empirical tools to measure the allocation of time has been limited to infrequent time diaries and very specific surveys. Their importance, however, is increasing with the retirement of the elderly in Western countries and within communities of higher family network. Zagheni and Zannella (Reference Zagheni and Zannella2013), for example, observed a large time transfer from females to males in general and from adults to children, in the 21, mostly Western, countries of the Multinational Time Use Study (MTUS). They also noted significant differences between countries: Italian women with one or more young children, for instance, dedicate far more time to household production than French women during their 20s. Albertini et al. (Reference Albertini, Kohli and Vogel2007), using the Survey of Health, Ageing and Retirement in Europe (SHARE) for the year 2004, found a strong net downward trend of transfers from elderly in children, not only in financial transfers but also in time transfers. These transfers differed between country groups, their welfare regimes and what the authors call their “generational contract”. They also noted that “younger” elderly groups, particularly during the first years of retirement, tend to give more time and financial support to their children and grandchildren, although 70-year-olds and older remain net givers to their families.
These differences highlight the importance of incorporating time flows into the NTA. Phananiramai (Reference Phananiramai, Lee and Mason2011), indeed, attempts to incorporate time into the NTA of Thailand, and proposes a modified NTA balancing equation, associating time with a certain monetary value. She finds that women in the Thai community remain net providers of time throughout most of their lives, working mostly on household maintenance. Although 30–40 year-olds were the main net providers of household time, those between 50–68 years old were the main net providers of community service. Care for children, the author argues, constitutes about 67% of total intra-household transfers, and children are the most demanding of time. This emphasizes the role of time transfers for young populations especially, and warrants significant differences between the NTA countries.
Moreover, the NTA profiles as they stand today remain gender-neutral. Part of the challenge of segregating by gender is the need for even more assumptions and more detailed data. Still, this gender-neutrality masks part of the picture. Hammer et al. (Reference Hammer, Prskawetz and Freund2013), for example, suggest a markedly different picture of the life cycle deficits between men and women. Utilizing the NTA database and the EU Statistics on Income and Living Conditions (EU-SILC), the authors find that labor income profile for women is noticeably less than that of men, with the exception of Slovenia and to some extent Sweden, Finland, and Hungary. Female contribution to total labor income ranges from a low of 24% in Italy and the UK to about 41% in the Sweden, reflecting female labor force participation and income at various ages, in addition to family policies within each country. Female contribution in non-market goods and services, on the other hand, exceeds that of men in almost all countries. Gender segretation is, of course, possible, but remains a challenge for the project.
Mason and Lee (Reference Mason, Lee, Lee and Mason2011) also note that the NTA lacks “green accounting,” meaning that while it measures savings and asset-based reallocations, for example, it does not take into account the degradation of the environment that often comes with economic growth. This degradation influences future savings and consumption behavior, as well as labor income potential. The level of degradation also varies between countries. It is difficult, however, from a data and theoretical limitation perspective, to incorporate this in the NTA today, not to mention that this subject by itself requires further research.
A final point of contention, and still a theoretical and empirical challenge, is the incorporation of inheritance into the economic flows between individuals. Although the data for inheritance remain scant and unreliable for many countries, their magnitude in the economy is large. Piketty (Reference Piketty2011), for example, estimated the inheritance flow, which includes both bequest and inter vivos gifts, to have been about 15% of France’s national income in 2010, with a forecast of 20–25% in a few decades. Sánchez-Romero et al. (Reference Sánchez-Romero, Ogawa and Matsukura2013) estimated Japan’s inheritance flow, using a Computed General Equilibrium (CGE) model, to have been about 8–12% of GDP in 2000 with a forecast of 14–26% in the year 2100.
These works, though crucial and significant, emphasize still the scarcity of the available data for the framework of the NTA. Except for some rare cases, the estimates on inheritance often relied upon specific and short-period surveys. Menchik (Reference Menchik1980), for instance, used a specific year data drawn from the Inheritance Tax Division of the Connecticut State Department to ascertain equal bequest and inheritance between generations; Davies Davies (Reference Davies1982) based his simulations on inheritance data that were derived from the American Survey Research Center’s 1960 “Income and Welfare” survey; Bernheim et al. (Reference Bernheim, Shleifer and Summers1985), who introduced a strategic bequest model, and Hurd (Reference Hurd1987), who introduced a model of bequest motive to explain elderly income and consumption, both relied on the American Longitudinal Retirement History Survey, which was limited to the period 1969–979; and Perelman and Pestieau (Reference Perelman and Pestieau1992) used a limited 5,600 French household survey conducted by INSEE in 1986, based on yes–no questions.
However, many of the NTA challenges can be overcome with further research and more accurate surveys; research that is already being worked on and published where authors use multiple years of analysis for comparison and where even more special attention is placed on the generational economy as a whole (see for example, Patxot et al. (Reference Patxot, Lee and Mason2015) and the special edition of the Journal of the Economics of Ageing titled Exploring the Generational Economy).
6. CONCLUDING REMARKS
This article attempted to give a comprehensive picture of the NTA: the theoretical and conceptual origins upon which it relies, the key findings of the numerous teams around the world who applied the NTA methods to their own countries and allowed a larger comparative understanding of economic flows between generations, and finally the limitations and challenges that await to be delved into and improved upon.
The further development of the NTA as a powerful empirical tool to understand the generational economy depends upon continuing to build a global database that would not only enhance our knowledge of generational flows but would also be opened for researchers in all fields, stirring the type of public debate that would implement more effective public policy for current and future generations.
Ages of entry into and exit from life cycle surplus and surplus year-span, by country
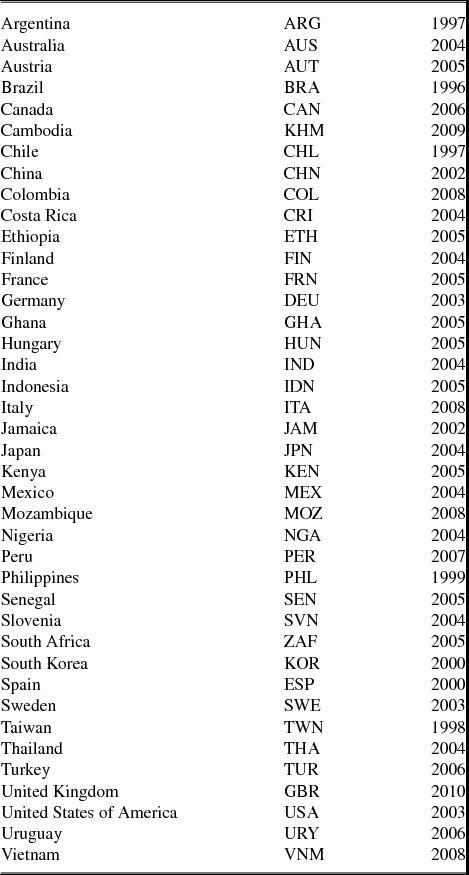
Country names, abbreviations, and year of data