INTRODUCTION
The Microlithic age, in the history of human evolution, is associated with the emergence of modern human behavior and dispersals, refined cognitive abilities, and developed language and symbolism (Foley and Lahr, Reference Foley and Lahr1997; Ambrose, Reference Ambrose1998; Klein, Reference Klein2000; McBrearty and Brooks, Reference McBrearty and Brooks2000; Wadley, Reference Wadley2001; Marean et al., Reference Marean, Bar-Matthews, Fisher, Goldberg, Herries, Jacobs and Jerardino2007; Henshilwood and d'Errico, Reference Henshilwood and d'Errico2011; Henshilwood, Reference Henshilwood2014). Numerous Microlithic archaeological sites in India and Sri Lanka contain well-preserved, continuous human occupation records from the Late Paleolithic to the Iron Age (e.g., Mehtakheri [Madhya Pradesh], Jwalapuram [Andhra Pradesh], Kana, and Mahadebbera [West Bengal] in India and Batadomba-Lena, Fa-Hien-Lena, Kitulgala Beli-Lena, and Bellanbandi Palassa in Sri Lanka). The oldest antiquities/fossil remains recovered at Mehtakheri, Jwalapuram, Kana, and Mahadebbera in India have been dated to ~44, 35, 42, and 25 ka, respectively (Clarkson et al., Reference Clarkson, Petraglia, Korisettar, Haslam, Boivin, Crowther and Ditchfield2009, Reference Clarkson, Jones and Harris2012, Reference Clarkson, Petraglia, Harris, Shipton, Norman, Robinson and Sellet2018; Basak et al., Reference Basak, Srivastava, Dasgupta, Kumar and Rajaguru2014; Basak and Srivastava, Reference Basak and Srivastava2017), whereas antiquities/fossil remains at Fa-Hien-Lena and Kitulgala Beli-Lena in Sri Lanka have been dated to 45 ka (Wedage et al., Reference Wedage, Amano, Langley, Doueka, Blinkhorn, Crowther and Deraayanigala2019a, Reference Wedage, Picin, Blinkhorn, Douka, Deraniyagala, Kourampas and Pererab, Reference Wedage, Roberts, Faulkner, Crowther, Douka, Picin and Blinkhorn2020). The archaeological records of human habitat from these sites are associated with specialized adaptations to tropical rainforest environments between 48–45 ka and 3 ka. These records are also critical for investigating anatomically modern human dispersal and cultural evolution in the Indian subcontinent.
The microlithic antiquities recovered from Indian and Sri Lankan sites revealed remarkable similarities in their traditions (Clarkson et al., Reference Clarkson, Petraglia, Korisettar, Haslam, Boivin, Crowther and Ditchfield2009; Petraglia et al., Reference Petraglia, Clarkson, Boivin, Haslam, Korisettar, Chaubey and Ditchfield2009; Haslam et al., Reference Haslam, Clarkson, Petraglia, Korisettar, Jones, Shipton, Ditchfield and Ambrose2010, Reference Haslam, Harris, Clarkson, Pal, Shipton, Crowther and Koshy2012; Perera et al., Reference Perera, Kourampas, Simpson, Deraniyagala, Bulbeck, Kamminga, Perera, Fuller, Katherine and Oliveira2011, Reference Perera, Roberts, Petraglia and Langley2015; Mishra et al., Reference Mishra, Chauhan and Singhvi2013; Roberts et al., Reference Roberts, Boivin and Petraglia2015). These traditions were unique and did not match with contemporary microlithic traditions of Africa and Europe (Lewis et al., Reference Lewis, Perera and Petraglia2014). For example, osseous toolkits and evidence of ornamentation found at the Batadomba-Lena (Sri Lanka) and Jwalapuram (India) rock shelter sites show unique similarities (Perera et al., Reference Perera, Kourampas, Simpson, Deraniyagala, Bulbeck, Kamminga, Perera, Fuller, Katherine and Oliveira2011, Reference Perera, Roberts, Petraglia and Langley2015; Roberts et al., Reference Roberts, Boivin and Petraglia2015). Typical traditions of Ochre, symbolic beads, and osseous technology observed in Sri Lankan sites have no link to Africa or Europe (Conard, Reference Conard2010), but do have a link with India (Perera et al., Reference Perera, Kourampas, Simpson, Deraniyagala, Bulbeck, Kamminga, Perera, Fuller, Katherine and Oliveira2011, Reference Perera, Roberts, Petraglia and Langley2015). The uniqueness of the Indo-Sri Lankan microlithic tradition indicates regional evolution of customs under the influence of climatic variation (Perera et al., Reference Perera, Kourampas, Simpson, Deraniyagala, Bulbeck, Kamminga, Perera, Fuller, Katherine and Oliveira2011, Reference Perera, Roberts, Petraglia and Langley2015; Roberts et al., Reference Roberts, Boivin and Petraglia2015). Simultaneously, similarities in these traditions suggest unceasing long-distance contacts and frequent cultural assimilation among mainland foragers of India and Sri Lanka.
Palk Strait separates Sri Lanka from the Indian landmass. As per existing human dispersal theories, H. sapiens (anatomically modern humans) first came to India and reached Sri Lanka during the late Pleistocene through island hopping (Haslam et al., Reference Haslam, Clarkson, Petraglia, Korisettar, Jones, Shipton, Ditchfield and Ambrose2010, Reference Haslam, Roberts, Shipton, Pal, Fenwick, Ditchfield, Boivin, Dubey, Gupta and Petraglia2011; Mellars et al., Reference Mellars, Goric, Carr, Soares and Richards2013; Groucutt et al., Reference Groucutt, Scerri, Lewis, Clark-Balzan, Blinkhorn, Jennings, Parton and Petraglia2015). It is interesting to note that during the same period (late Pleistocene) sea level lowered to ~120 m below the present and rose again to the present level (Waelbroeck et al., Reference Waelbroeck, Labeyrie, Michel, Duplessy, McManus, Lambeck, Balbon and Labracherie2002; Siddall et al., Reference Siddall, Rohling, Almogi-Labin, Hemleben, Meischner, Schmelzer and Smeed2003; Rehak et al., Reference Rehak, Niedermann, Preusser, Strecker and Echtler2010). The sea-level variation of this amplitude causes significant geomorphological changes on continental and island coastlines. Human colonization and animal dispersals, especially of mammals unable to swim, are intricately linked to the morphological variations of the coast and the occurrence of favorable conditions for colonization.
India and Sri Lanka currently are entirely separated, with no sign of any land link. However, several epigraphical records and ancient religious texts assert a land link between India and Sri Lanka in the historical age. For example, an epigraph at Hampi refers to the presence of a manmade bridge, the “Ramasetu,” between India and Sri Lanka. Similarly, in Ramayana, one of the most revered Hindu scriptures, Shri Ramchandra, with his army, built the “Ramasetu” over the sea connecting India and Sri Lanka using stones and forest wood in five days (Ramayana, Yuddhakand, 22.55–22.73; Sharma Janaki Nath, Reference Nath2003). Archaeological investigations around Pamban Island in India and Mannar Island in Sri Lanka revealed early historic (third century BC to fourth century AD) and early iron age (first millennium BC) settlements, respectively (Shinde, Reference Shinde1987). These early historic archaeological shreds of evidence at these sites in India and Sri Lanka also indicate the Ramasetu region's importance in human dispersal, colonization, and cultural assimilation between these two land masses.
Currently, the Ramasetu bridge refers to the southwestern shallowly submerged region between Rameshwaram (India) and Mannar (Sri Lanka) islands in the Palk Strait. The role of the Ramasetu region and nearby coastal geomorphological features, which might have evolved under extreme sea-level and climatic variations, has not been investigated yet. Investigating subsurface geomorphology and stratigraphy of the region may reveal vital information. It may uncover the history of geomorphological changes in the past and how these changes might have constrained human dispersal and long-distance contacts.
High-resolution shallow seismic (HRSS) sections produce a reliable picture of a sedimentary basin's buried geomorphologic and stratigraphic features. These features in seismic sections are better interpreted in chronological order of their formation by ground-truthing stratigraphy with the help of long-core sediment data. Some geomorphologic features, such as channel incisions, due to their inherent properties, can reveal paleoenvironmental conditions (Bahr et al., Reference Bahr, Wong, Yim, Huang, Lüdmann, Chan and Ridley Thomas2005; Nordfjord et al., Reference Nordfjord, Goff, Austin and Sommerfield2005; Liu et al., Reference Liu, Goff and Austin2017; Dubey et al., Reference Dubey, Chaubey, Mahale and Karisiddaiah2019; Prasad and Loveson, Reference Prasad and Loveson2020) and can be easily correlated with the available sea-level curve (Dubey et al., Reference Dubey, Chaubey, Mahale and Karisiddaiah2019).
The present study is mainly based on high-resolution shallow seismic data. In the study, stratigraphic and geomorphologic records from the Ramasetu region have been analyzed. The geomorphologic features are further investigated for their response to varying sea levels and climatic conditions. The study illuminates whether and when the Ramasetu region was a direct link between Dhanushkodi in India and Mannar in Sri Lanka. If it was not a direct link, what might have been possible modes of dispersal of H. sapiens between the late Pleistocene to mid-Holocene, and how the geomorphologic changes around this region might have contributed to the evolution of the transport system across the two landmasses.
STUDY AREA
Geological and geomorphological settings
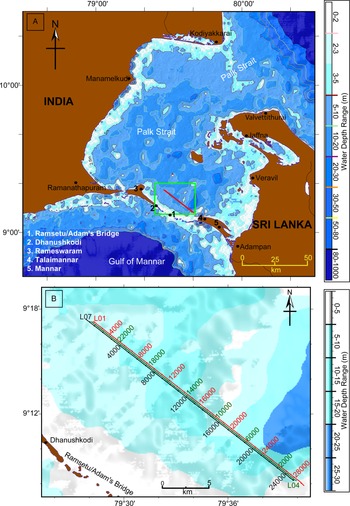
The Palk Strait, a ~15,000 km2 large area between India and Sri Lanka, is bounded by the coastal region of Tamilnadu (India) in the north and the Northern Province of Sri Lanka in the south (Fig. 1). The southwestern part of the Palk Strait is partially bounded by two protruding islands, Pamban (Rameswaram) Island in India and Mannar Island in Sri Lanka, and the shallow patches between these islands (Fig. 1). The Palk Strait connects the Arabian Sea with the Bay of Bengal through these shallow patches, traditionally known as Ramasetu or Adams Bridge. Ramasetu consists of several parallel ledges of conglomerate and sandstone that are hard at the surface and become coarser and soft as they rest on the sand bank (Bahuguna et al., Reference Bahuguna, Nayak and Deshmukh2003; Kumaraguru et al., Reference Kumaraguru, Edwin Joseph, Rajee and Balsubramanian2008). The bathymetry of the Palk Strait varies from 0 m to ~35 m. The available bathymetry data reveals the existence of shallow patches, with a depth range from ~0–5 m, in northeastern Palk Strait between Kodiyakkarai (India) and Valvettithurai (Sri Lanka). Water depth along the Ramasetu between Dhanushkodi (India) and Thaliamannar (Sri Lanka) varies from 1–3 m (Subba Rao et al., Reference Subba Rao, Srinivasa Rao, Iyer and Chittibabu2008). The central region of the Strait has a general water depth of ~20 m, reaching up to a maximum depth of ~35 m, with several small islands (Fig. 1).
(A) Map depicting Palk Strait, Gulf of Mannar, and surrounding land regions. The bathymetry of the Palk Strait and Gulf of Mannar is plotted using GEBCO grid data (GEBCO Compilation Group, 2019). Solid red line in the green box shows the surveyed shallow seismic tracklines near Ramasetu. (B) Enlarged part of the survey area depicting seismic survey tracklines with respective shot numbers.
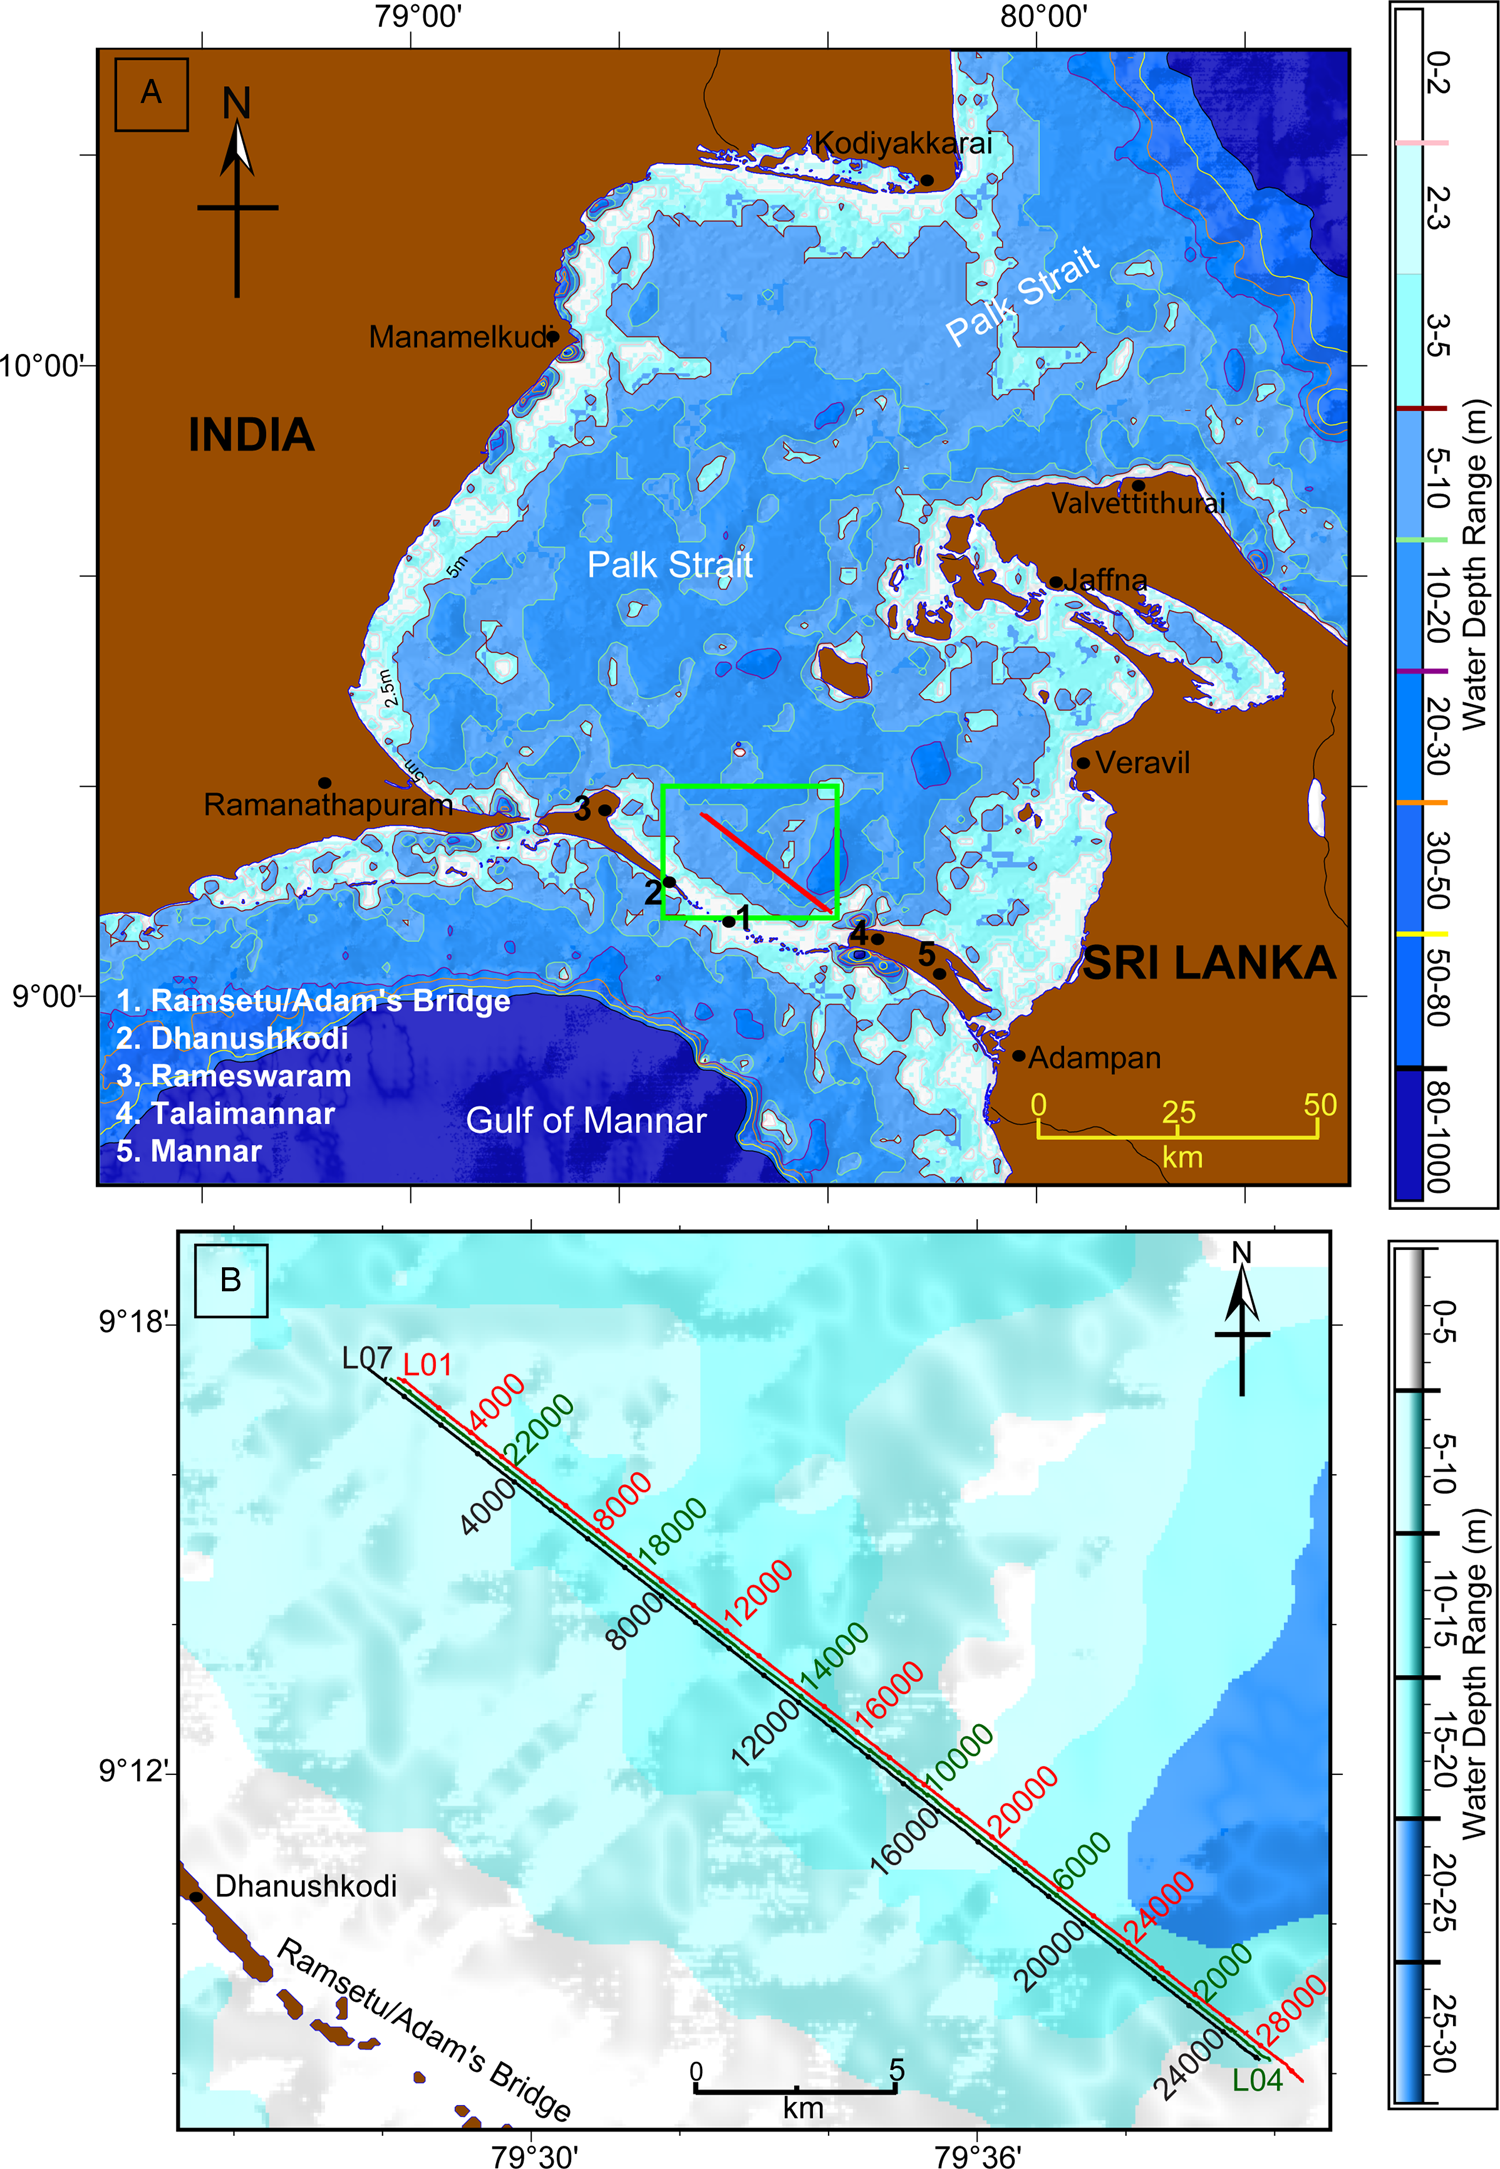
The Palk Strait is considered one of the largest sinks for sediments debouched from hinterlands. The Strait receives riverine input through several small rivers and streams from India and Sri Lanka, and the Vaigai River is a major source from the Indian side. The surf currents further transport the sediments as littoral drift before settling in the region's permanent, semi-permanent, or temporary sinks (Chandramohan et al., Reference Chandramohan, Jena and Sanil Kumar2001). The geographical location and geomorphological properties of the Ramasetu make it a temporary sediment sink. The unstable Sand Cays, made up of loose coral sand and beach rocks at the Ramasetu, continually change their spatial distribution and orientation (Bahuguna et al., Reference Bahuguna, Nayak and Deshmukh2003). Bay of Bengal water significantly influences the hydrographic conditions of the Palk Strait, while the Gulf of Mannar waters only affect it to a minor extent (Murty and Varma, Reference Murty and Varma1964). The study area lies in the Palk Strait along Ramasetu (Fig. 1b) and is part of a shallow basin northeast of the Ramasetu (Adam's bridge). The water depths in the study area vary from 3–14 m.
Archaeology of the region
During an onshore exploration of Pamban Island, an archaeological site was noticed on the island's northeast coast near Ariyagundur village (Tamilnadu). The ancient site spread along the coast and was totally destroyed by the sea waves. Many scattered potsherds were recovered within the upper 2.5 m of strata. The surface habitation appears to be from about the eleventh to thirteenth centuries AD. Discovery of Chinese sherds from the site indicates active participation in overseas trade relations (Gaur and Sundaresh, Reference Gaur, Sundaresh and Reddy2006). The site's location suggests it could have served as a safe harbor. The stratigraphically lowest habitation might have been away from the shore. Presently, the sea touches the section of the archaeological site during high tide, suggesting landward shoreline advancement in this case.
Algankulam, an early historic site, is situated near the river mouth of Vaigai, north of the present study area. Schoff (Reference Schoff1912) noted that the Periplus of the Erythraean Sea referred to the place as ‘Argaru,’ which could be identified with present Alagankulam, rather than Uraiyur, which is far inland, as proposed by Sastri (Reference Sastri1972) and Athiyaman (Reference Athiyaman2013). In five seasons, this site was excavated by the State Department of Archaeology of Tamil Nadu during the 1990s (Sridhar, Reference Sridhar2005). It yielded a cultural sequence of four periods, ranging from the fifth century BC to the twelfth century AD. The site probably lost its importance due to the port's emergence at Periyapattinam during this period. The site has yielded antiquities of indigenous and western origin, such as terracotta dice, spindle whorls, and measuring weights. A remarkable piece of Red Roulette ware, dated to the first to second centuries AD, was unearthed with the symbol of ships with oars identified as depicting a Roman vessel by Lionel Casson (Sridhar, Reference Sridhar2005). Roman coins of the fourth to fifth centuries AD were also unearthed. These antiquities signify the active role of this port during its early history and early medieval periods.
Periyapattinam, one of the late medieval ports, lies in the Gulf of Mannar region, 15 km south of Alagankulam, India. During excavations conducted by Tamil University with Noboru Karashima in 1987, many Chinese wares were unearthed and studied for their provenance and possible dating (Karashima, Reference Karashima and Karashima2004). Periyapattinam flourished during the thirteenth to fourteenth century AD. Periyapattinam was mentioned in a Chinese source as ‘Dabadan,’ and Ibn Battuta described it as ‘Fattan’ (Karashima, Reference Karashima1989, Reference Karashima and Karashima2004).
On the Sri Lankan coast, an ancient settlement at Tirukketisvaram in Mantai is known as the ancient port of Mahatittha (Pali), Matota (Singhalese), or Mantottan (Tamil). Mantai lies in the Mannar district of the northwestern province of Sri Lanka. The settlement is ~6 km to the southeast of Mannar town and nearly 300 m away from the seacoast. The oldest habitation records at this place date back to 4.2 ka and have been assigned to the Mesolithic age (Deraniyagala, Reference Deraniyagala1992). However, Mantai took center stage during the early historic period when habitation expanded significantly, and was a bustling port until the late medieval period (Carswell, Reference Carswell1983).
GEOPHYSICAL DATA
The present study is based on high-resolution shallow seismic (HRSS) data acquired onboard coastal research vessel Sagar Sukti and mechanized vessel Srinivasa in 2011. The HRSS data acquisition system comprises energy source CSP D700, multi-tips squid spark array, data acquisition unit Octopus 760, and a 20-element streamer with 0.25 m hydrophone spacing. The data were acquired along three parallel tracklines in a 300 m wide corridor with a line spacing of 150 m (Fig. 1b). The data were recorded in a 250–3000 Hz frequency band, using 200–300 joule source energy at a sampling frequency of 24 kHz with a vessel speed of ~4.0 knots. The data were stored in SEG-Y format at a record length of 500 ms. A differential global positioning system (DGPS) manufactured by Trimble (Model 4000 SE) along with differential beacons (operating in 283.5–325 kHz band) were used for positioning and navigation during the survey.
Acquired data were processed using seismic data processing software package SeisSpace®ProMAX® of Landmark solutions. The data were demultiplexed, resampled at 0.1 ms intervals, and stored in SeisSpace®ProMAX® format. Resampling was done to reduce the data size for better handling and further processing. Later, the data were subjected to trace editing and top muting. Trace editing was conducted to remove erroneous seismic traces, and top muting was performed to remove direct arrivals and noise from the water column. In addition, the data were subjected to bandpass filtering, deconvolution, and gain corrections to improve seismic reflectors. For two-way travel time to depth conversion, a P-wave velocity of 1500 m/s for the water column and 1583 m/s (Krishna et al., Reference Krishna, Rao, Murty and Ramana1989) for sedimentary layers were used. The navigation data were extracted from the SEG-Y header of each trace, representing a shot point, for generating a seismic track plot.
The processed seismic sections provide a clear picture of 40–50 ms thick sedimentary strata for stratigraphic sequence analysis and constrain the interpretation limit in the geological time domain. A strip-back methodology was used to identify and correlate identified sequence stratigraphic features with the sea-level curve.
RESULTS
Sedimentary architecture of the study area
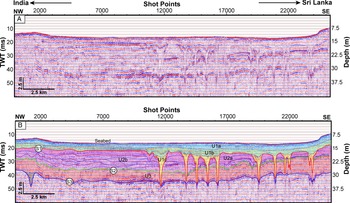
HRSS sections revealed that the seabed in the study area lies between ~10–15 ms, corresponding to a water depth of 7.5–11.3 m (Fig. 2) below the sea surface. Parallel to sub-parallel reflectors indicate characteristic sedimentary units in the study area and reveal three comparatively stronger reflectors at ~20, 30, and 40 ms below the seabed (Fig. 2). These three reflectors contain channel-incision signatures. Therefore, these reflectors represent a surface of non-deposition and erosion and are marked as subaerial unconformities, namely S1, S2, and S3 (Fig. 2). All three subaerial unconformities are parallel to the seabed (Fig. 2).
(A) Uninterpreted processed seismic section along trackline L-07. (B) Corresponding interpreted seismic section shows identified seismic units U1a, U1b, U1c, U2a, U2b, and U3, and identified subaerial unconformities S1, S2, and S3. The location map of the trackline is shown in Figure 1B. TWT = two-way travel/time (milliseconds).

Based on these identified bounding surfaces and the reflection patterns, the entire seismic section can be divided into three sedimentary units, namely U1, U2, and U3 (Fig. 2). U3 is the oldest and is bounded by the unconformities S3, below, and S2, above, whereas the youngest sedimentary unit, U1, is bounded by the seabed and youngest subaerial unconformity S1. Unit U2 is bounded by subaerial unconformities S1, above, and S2, below.
Sedimentary unit U3 contains low-amplitude, continuous, and parallel reflectors. The continuous and parallel reflectors in seismic unit U3 suggest a relatively stable, low-energy depositional environment and accommodation space. The reflection pattern in sedimentary unit U2 is not consistent. It contains alternating medium to high amplitude, sub-parallel, and randomly discordant reflectors on the Indian side, suggesting sediment deposition under highly variable energy and accommodation space conditions. Seismic unit U2 on the Sri Lankan side shows low-amplitude sub-parallel reflectors, suggesting sediment deposition under low energy conditions. Based on these observed seismic attributes, seismic unit U2 can be further divided into two subunits, U2a and U2b (Fig. 2). Their stratigraphic correlation reveals that U2b is older than U2a. It also suggests that sedimentary unit U2 was deposited under drastic climatic changes, which is supported by minor base level changes in the region. Alternating medium- to high-amplitude, sub-parallel, and randomly discordant reflectors in U2b indicate a depositional environment in which the base level and sediment supply were highly variable. Although it can be inferred that U2b might have been deposited in a very shallow marine or lacustrine environment, it more likely was deposited in a lacustrine depositional environment because sea level was at a much lower level during the time (Fig. 4). U1 contains low- to medium-amplitude reflectors, which can be sub-divided into U1a, U1b, and U1c. U1a resides on top of U1b and contains low-amplitude parallel reflectors (Fig. 2). On the correlation with sea-level curves, this unit (U1a) has been interpreted as a highstand system tract (HST) (i.e., sediment deposited in highstand sea-level conditions). In contrast, U1b contains low- to medium-amplitude lenticular to sub-parallel reflectors associated with tidal to estuarine channel incision and deposition. U1c consists of lenticular reflectors and is interpreted to have been deposited in fluvial conditions during base-level rise.
Channel geomorphology
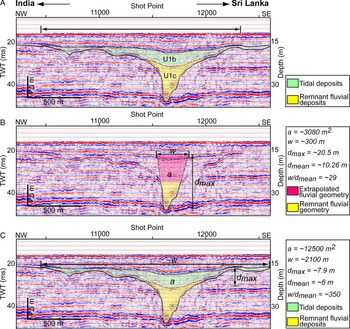
Incision signatures associated with subaerial unconformity S1 have complex channel geometries that generally are V-shaped with symmetrical flanks between the bottom of the incision to ~25 ms. The channels become U-shaped progressively upward (Figs. 2, 3). The lower part (U1c, V-shaped portion) consists of a nearly reflection-free zone. The upper part (lenticular part of U1b, U-shaped part) of the channel incision signatures show continuous and comparatively stronger reflections than the bottom part. The infill signatures of the lower part of the incisions indicate homogenous, lower energy deposition. In comparison, continuous and comparatively stronger reflections of U1b indicate its variable, high-energy burial environment.
(A) Interpreted seismic section along trackline L-07 between shot points 10300 and 12560 showing channel incision signature. (B) Geometric parameters of the fluvial incision signature to compute aspect ratios of the channel in the formative stage. (C) Geometric parameters of the channel incision signature to compute aspect ratios of the estuarine stage. a = cross-sectional area of the channel; w = width of the channel; dmax = maximum depth of the channel; dmean = mean depth of the channel; w/dmean = aspect ratio of the channel. TWT = two-way travel/time (milliseconds). The channel's mean depth is the channel's cross-sectional area divided by the channel width.

The width of these paleochannels varies from 354.8–2399.3 m, while the mean depth (i.e., [area of incision cross-section]/[width of incision]) varies between ~3.0 m and ~16.0 m (Table 1). Aspect ratios (width of the incision/mean depth) of the initial stage channels vary between 15–35 (Table 1). In contrast, aspect ratios of the final stage channel incision vary between 92–410. However, Rosgen's (Reference Rosgen1994) river classification scheme is not entirely applicable for remnant river channel signatures. Still, due to the lack of similar studies for buried channels, it can provide some guidance for the geomorphologic and hydraulic conditions of buried channels. As per the river classification scheme of Rosgen (Reference Rosgen1994), lower values of aspect ratios for initial stage incisions suggest that incisions started in extremely high-energy fluvial conditions, which require high-gradient longitudinal profiles of the incised channels and sufficient water supply. At the same time, the higher aspect ratios for the final stage incisions suggest that the buried river channels in their final stage were flowing in estuarine energy conditions very close to the base level.
Morphometric parameters and paleo-flow estimates of channel incision signatures in the study area.

The combined geometric parameters and infill seismic reflector analysis of these incision signatures suggest that the incisions started in extremely high-energy fluvial conditions and matured at a later stage. Later, these channels became wider (U1b) in response to the effect of base-level/sea-level rise and finally were buried in tidal conditions (Fig. 3).
The symmetrical flanks of the incision signatures reveal that the water through these channels was flowing on a straight course almost perpendicular to the seismic tracklines (i.e., NE-SW) (Dubey et al., Reference Dubey, Chaubey, Mahale and Karisiddaiah2019). The low aspect ratios of the initial stage incisions also indicate that the mapped incision signatures are the signatures of the upper reaches of the rivers’ longitudinal profiles. The HRSS data also revealed V-shaped channel incisions, which suggest a very high energy setting and the availability of a highly sloping gradient during the initial stages.
A river channel, in general, flows from the highland to lowland to achieve ultimate base level (i.e., sea level). Present-day bathymetry variation of Palk Strait indicated the existence of an inconsistent and low-gradient topographic surface toward the Bay of Bengal during lowered sea-level conditions. Surfaces with low-gradient topographic variations can never provide the required energy for the observed V-shaped incisions.
On the other hand, there was a low-gradient topographic surface toward the Gulf of Mannar until the Ramasetu during lowered sea level. However, after Ramasetu, a very high gradient topographic surface was available. Such a high gradient topographic profile, supported by a vast water reservoir, will always be capable of providing the required energy for the incisions.
Therefore, we interpret the observed buried channels to have originated from the Palk Strait region and were debouched in the Gulf of Mannar, crossing the Ramasetu bridge region. Later, the widening of incision signatures and burial of channels in tidal conditions supports debouching of these channels into the Gulf of Mannar.
The remnant incision signatures on S2 are also V-shaped. Maximum entrenchments of these incisions are ~10 ms (~7–8 m).
DISCUSSION
Sea level and Geomorphology of Palk Strait
Sea level has fluctuated several times in the geological past due to extreme climatic variations (glacial and interglacial). These climate-driven sea-level fluctuations were high amplitude (~120 m) and had a cycle of ~80–100 ka (Waelbroeck et al., Reference Waelbroeck, Labeyrie, Michel, Duplessy, McManus, Lambeck, Balbon and Labracherie2002; Siddall et al., Reference Siddall, Rohling, Almogi-Labin, Hemleben, Meischner, Schmelzer and Smeed2003; Rehak et al., Reference Rehak, Niedermann, Preusser, Strecker and Echtler2010). During the last glacial maximum (LGM), ~20 ka ago, the sea level was ~120 m below the present sea level (Fig. 4). The geomorphological configuration of the Palk Strait region (Fig. 1) suggests that the northeast and southwest boundaries of the Palk Strait should have been entirely exposed at ~20 ka during the last glacial period. The present-day Palk Strait region, with a maximum depth of ~35 m, was a multi-centered basin in the recent geological past, which might have functioned as a large water reservoir during the initial sea level fall at ~120 ka. With an area of ~15,000 km2, the basin is comparable to the world's 15th largest existing natural lake. Several ancestral rivers and rivulets from hinterlands (India and Sri Lanka) might have been its primary water source. Therefore, the Palk Strait region might have continued to act as a sizeable freshwater reservoir at least during the monsoon intensified phases of the last glacial period. Seismic attributes for sedimentary unit U2 also point to a lacustrine depositional environment. Furthermore, analysis of seismic data of this study reveals the presence of channel-incision signatures near the Ramasetu flowing towards the Gulf of Mannar. The existing reservoir might have supplied water to these buried channels, which linked the freshwater reservoir in the Palk Strait and the Gulf of Mannar during the lowered sea level.
Sea-level curve of the last 450 ka (Rehak et al., Reference Rehak, Niedermann, Preusser, Strecker and Echtler2010). Marine Isotopic Stages (MIS) have been added following Lisiecki and Raymo (Reference Lisiecki and Raymo2005).

Formation and burial of incisions
The youngest subaerial unconformity S1 lies beneath the seafloor and has an overload sediment thickness of ~3–4 m. Further, HRSS data also revealed that the sedimentary sequence above S1 does not show any erosion signature. The absence of erosion signatures indicates that the area was never exposed again for fluvial/tidal erosion processes. However, elevated regions, such as Ramasetu (Adam's Bridge), might have been exposed during minor sea-level fluctuations in the recent past. Because the study area lies within an enclosed region (Fig. 1), sea level might not have been the only controlling factor in the base-level changes. Apart from sea level, freshwater level in the reservoir also might have played a lead role in the base-level variation. Observed channel incisions on S1 are ~16–22 m deep. As per the base-level concept of channel incision (Dubey et al., Reference Dubey, Chaubey, Mahale and Karisiddaiah2019), the base level must be at least ~36 m below the present sea level (~22 m of maximum entrenchment and ~16 m of current water depth) to form the observed channel system (Fig. 3). Analysis of the incision signatures suggests that the buried channels originated from the large water reservoir and debouched in the Gulf of Mannar. The observed incision signatures also represent incision conditions at the upper reaches of the longitudinal profile of the paleoriver channel.
Further, the lower part of the remnant channel geometry suggests that these channels were initially formed in very high-energy fluvial conditions. This situation indicates that the sea level must be far below 36 m. The available sea-level curve for the late Pleistocene–Holocene (Rehak et al., Reference Rehak, Niedermann, Preusser, Strecker and Echtler2010) shows that sea levels lower than ~36 m occurred between ~110–10 ka (Fig. 4), which means that the incision on S1 took place during the last glacial period and 10 ka in appropriate climatic conditions. Again, the upper part of the remnant channel geometry and its infill signatures suggest that the channel widened due to base-level rise in tidal conditions when the sea level rose to ca. 22 m below the present level. Available Holocene sea-level curves (Fig. 5) indicate that such sea level rise (below ~22 m from present sea level) took place at ~8.5 ka, implying that marine transgression from the Gulf of Mannar to this part of the Palk Strait occurred through the incised channels during the mid-Holocene. The incised channels were finally buried when sea level reached ≤15 m below the present sea level and fully engulfed this area at ~7.5 ka. It also implies that sediment deposition above the subaerial unconformity S1 took place within the last ~7.5 ka.
Holocene Sea-level curves of (A) Loveson and Nigam, Reference Loveson and Nigam2019, and (B) Hashimi et al., Reference Hashimi, Nigam, Nair and Rajagopalan1995.

Similarly, the observed incision signatures on S2 were developed during lowered sea-level conditions, were modified, and later buried due to rising sea levels. The incision signature on S2 lies at ~13 m below the seabed (~25 m below the present sea level) and is ~8 m deep. For such incisions, the base level initially must have been at least ~33 m below the present sea level and should have risen to a level that was at least ~25 m below the present sea level. For this to happen, the sea level must have been far below 33 m from the present sea level. Correlation with the available sea-level curve for the late Pleistocene–Holocene (Fig. 4) reveals that such sea level variation occurred between ~130–120 ka, and that incisions on S2 took place earlier than ~130 ka. S2 was buried during sea-level rise (~130–120 ka). Additional sea-level fluctuations and climatic variations between ~120–75 ka affected sediment deposition corresponding to seismic unit U2. Between ~120–75 ka, two rises and two falls in sea level, coupled with climatic changes, might have played a critical role in depositing sedimentary unit U2.
Therefore, we suggest that channel formation on S1 started at ~75 ka (during MIS 4) in fluvial conditions. MIS 4 was a cold and dry phase, during which time the Indian summer monsoon was weak. Therefore, enhanced monsoon conditions and additional sea-level fall during MIS 3 caused deeper, higher-energy incisions on S1, which finally was filled when the area was under tidal conditions due to sea-level transgression in the mid-Holocene.
Ramasetu and dispersal of H. sapiens between India and Sri Lanka
Geomorphological configuration of the Palk Strait suggests that the Ramasetu was the shortest and the most viable route for movement of H. sapiens between Pamban/Rameshwaram (India) and Talaimannar (Sri Lanka). As discussed above, the geomorphology of the Palk Strait has responded dynamically to variations in sea-level and climatic conditions since ~130 ka. Subaerial unconformities revealed that the Ramasetu emerged above sea level, sometimes resulting in a direct land link between India and Sri Lanka, and sometimes incised by river channels at various stages in the late Pleistocene.
With both fresh and saline water biota close by, the Ramasetu region was a potential zone for a habitation of migrating H. sapiens between the two land masses until the early Holocene (~8.5 ka). Later, in the mid-Holocene (~7.5 ka), seawater ingression into the Palk Strait from the Gulf of Mannar through the incised channels marked a significant environmental change around the Ramasetu. Due to seawater ingression, the freshwater reservoir in the Palk Strait started to become saline. The region's decreasing availability of fresh water progressively changed this area into a zone with low potential for migrating H. sapiens habitation in the mid-Holocene. Therefore, to sustain continuous contacts and cultural exchanges across these two land masses, it was necessary to evolve different exchange modes, and probably habitation/settlement, in the Ramasetu region during the last glacial period. The fact that the observed channel incisions were crossing the Ramasetu region before finally debouching in the Gulf of Mannar allows investigation of the role of the Ramasetu region's geomorphological variations with sea level in the dispersal of migrating H. sapiens.
Dispersal during Microlithic and end of Pleistocene
The oldest fossil record of the H. sapiens in Sri Lanka dates back to the late MIS 3 (~38 ka), suggesting the appearance of the H. sapiens in Sri Lanka during MIS 3. During the last glacial period (~120–12 ka), strengthening and weakening of several Indian summer monsoons across millennial scales have been reported (Rostek et al., Reference Rostek, Ruhland, Bassinot, Muller, Labeyrle, Lancelot and Bard1993; Thamban et al., Reference Thamban, Rao and Schneider2002, Reference Thamban, Kawahata and Rao2007; Patnaik et al., Reference Patnaik, Gupta, Naidu, Yadav, Bhattacharyya and Kumar2012; Marzin et al., Reference Marzin, Kallel, Kageyama, Duplessy and Braconnot2013; Saraswat et al., Reference Saraswat, Lea, Nigam, Mackensen and Naik2013; Dutt et al., Reference Dutt, Gupta, Clemens, Cheng, Singh, Kathayat and Edwards2015; Kathayat et al., Reference Kathayat, Cheng, Sinha, Spötl, Edwards, Zhang and Li2016; Kaushal et al., Reference Kaushal, Breitenbach, Lechleitner, Sinha, Tewari, Ahmad and Berkelhammer2018; Yadav et al., Reference Yadav, Naik and Narvekar2021). The mid–late MIS 3 (~35 ka) is known to have had intensified summer monsoon conditions. During this time, sea level was ~80 m below the present sea level (Rehak et al., Reference Rehak, Niedermann, Preusser, Strecker and Echtler2010). These two factors (i.e., lowered sea level and intensified monsoon) imply an active phase of channel incisions in the Ramasetu region. To move along the Ramasetu region, foragers needed to cross these high-energy fluvial channels. Later, during MIS 2 (~29–12 ka), sea level lowered further and reached the minimum level (~120 m below the present sea level). The LGM was reported to be the driest period of the last glacial period. Due to the diminished supply of fresh water to the Palk Strait reservoir in the prevailing dry climate conditions, even though the incised channels were not buried, a walkable land link between the two landmasses still should have been expected. After the LGM, the Indian summer monsoon again intensified with the start of deglaciation, with concomitant sea-level rise. Due to intense monsoon conditions during this time (except for a few short dry phases), older fluvial channels in this region reactivated. Therefore, foragers must have crossed these fluvial channels to move across the two land masses. Crossing fluvial channels was only possible using floaters/rafts, except during the dry phases of the year. Considering a stretch of ~45 km of the Ramasetu and the availability of both fresh and saline water biota, we hypothesize the existence of at least a few temporary settlements of migratory foragers in the islands of the Ramasetu during this period.
Dispersal during Early to mid-Holocene
During the Early to mid-Holocene (~11–7 ka), sea level rose ~45 m to the present sea level (Fig. 5). During this time, continuous sea-level rise caused further aggradation of fluvial channels, which first merged into wider and shallower estuaries and were later buried entirely. Sedimentary unit U1b formed in these varying depositional environment changes. Seawater ingression into Palk Strait reduced the fresh water supply, making this region a low potential zone for H. sapiens habitation. Until the ingression of seawater, H. sapiens needed to cross the fluvial channels to move between the two land masses through a direct link in the dry season, and had to use floaters/rafts, etc., for the rest of the year. After sea water ingression, until complete submergence of the area, islands in the Ramasetu region were still partially exposed. Small patches of the tide-dominated area between islands were shallowly buried. Coastal geomorphological features (e.g., sand bars, beaches, and coral reefs) at suitable locations around islands might have commenced during the Early to mid-Holocene. In this situation, the foragers required floaters/rafts or manmade structures (such as bandh/bridge) to cross these shallow, low-energy estuarine patches of the Ramasetu. The establishment of manmade structures across shallow patches of the region emphasizes two aspects: (1) the presence of human population across the islands of the Ramasetu for frequent interaction, and (2) their capability of human populations to build bandh-/bridge-like structures. Considering archaeological evidence found at Mehrgarh, Baluchistan (Jarrige, Reference Jarrige2008), and a few places in eastern Uttar Pradesh, India (such as Jhunsi, Lahuradeva, Koldihwa, and Mahagarha, etc.) (Pal, Reference Pal2008), the possibility of establishing manmade structures such as bandh-/bridge-like systems across shallow patches of the Ramasetu region cannot be ruled out completely. The study warrants an intensive investigation of the area to confirm human habitation around the paleo-islands of the Ramasetu.
Dispersal from mid-Holocene to Anthropocene
The HRSS sections revealed that sedimentary unit U1a, above the buried tidal/estuarine channels, does not show any erosion signature. It indicated the absence of sea-level fluctuation capable of exposing the region to any fluvial or tidal erosion after submergence.
According to available Holocene sea-level curves, sea level reached the present level at ~7 ka (Fig. 5). It mostly remained above the present level until the early millennium BC (Hashimi et al., Reference Hashimi, Nigam, Nair and Rajagopalan1995; Banerjee, Reference Banerjee2000; Ranasinghe et al., Reference Ranasinghe, Ortiz, Moore, McAdoo, Wells, Siriwardana and Wijesundara2013: Loveson and Nigam, Reference Loveson and Nigam2019). Coastal archaeological records from the west coast of India also provide similar evidence of minor sea-level fluctuations after the reported highstand. Sea level was higher by ~2–6 m at ~5000 yr (Merh, Reference Merh1992), as indicated by several Harappan ports that were functioning along the Gujarat and Makran coast (Gaur and Vora, Reference Gaur and Vora1999). Similarly, early historical sites traced in shallow waters or intertidal zones from both the Indian coasts, such as Poompuhar in Tamilnadu (Sundaresh et al., Reference Sundaresh, Gaur and Nair1997), Dwarka, and Bet Dwarka in Gujarat (Gaur et al., Reference Gaur, Vora and Sundaresh2007), suggest a sudden fall (ca. 2500 yr) and subsequent rise of sea level. Thus, a few minor fluctuations have occurred during the last 5000 yr when shallow features of the Ramasetu region may have been exposed and submerged again.
Ramasetu islands were completely submerged during high sea levels of this time. Therefore, a manmade structure to cross the Ramasetu region was not possible. People might have used floaters/rafts/boats instead. Archaeological records from Southeast Asia also substantiate this possibility (Gupta, Reference Gupta2018, and references therein). As revealed by sedimentary unit U1a, sediment deposition during sea-level highstand facilitated a narrow, partially emerged zone during minor sea-level falls between 5 ka and present. It was logical and convincing to construct a walkable footbridge through this zone between India and Sri Lanka. An epigraph further supports this inference at Hampi, which refers to the presence of a manmade bridge, the “Ramasetu,” between India and Sri Lanka.
CONCLUSIONS
Several significant conclusions are drawn from the current study in light of available information on climate variability and climate-driven sea-level variations during the Late Pleistocene and Holocene, along with the evidence provided by HRSS data. (1) The Palk Strait evolved as a multi-centered large freshwater reservoir due to sea-level fall at ~120 ka. It remained a freshwater reservoir until ~8.5 ka. The Ramasetu, a wide land link, bordered the reservoir on the western side. (2) HRSS data reveal three subaerial unconformities, S1, S2, and S3. These subaerial unconformities contain signatures of buried channels. (3) Channel formation on the youngest subaerial unconformity started during MIS 4. The channels were most active during the wet periods of MIS 3 and finally were buried in the mid-Holocene (~7.5 ka). These channels originated in the Palk Strait and debouched in the Gulf of Mannar. (4) Considering a stretch of ~45 km of the Ramasetu and the availability of both fresh and saline water biota nearby, a few temporary settlements of migratory foragers on the islands of the Ramasetu can be hypothesized. (5) River channels and island configurations in the Ramasetu region imposed constraints for human dispersal and cultural exchanges between India and Sri Lanka. (6) During wet periods of Microlithic and terminal Pleistocene, high-energy fluvial channels flowed through the Ramasetu region, and foragers needed floaters/rafts to cross these fluvial channels to move between India and Sri Lanka. During dry phases, a walkable land link between India and Sri Lanka was to be expected. (7) During Early to mid-Holocene, high-energy fluvial channels changed to estuarine channels due to environmental and ecological changes. New coastal morphologic features evolved around the Ramasetu region. Foragers required floaters/rafts or manmade structures (such as bandh/bridge) to cross these shallow, low-energy estuarine patches of the Ramasetu. During this time, construction of a bridge-like facility cannot be completely ruled out. (8) The entire Ramasetu region was submerged for most of the mid-Holocene to Anthropocene, and the region was not crossable without boats/ships. A narrow area of this region was periodically available for a direct link between India and Sri Lanka during minor decreases of sea level.
Acknowledgments
The authors are thankful to Prof. Sunil Kumar Singh, Director, CSIR-NIO, and Dr. V.J. Loveson, Head, Geological Oceanography, for their encouragement and support in publishing the paper. We are also thankful to the entire scientific and technical team and crew onboard Coastal Research Vessel Sagar Sukti and MV Srinivasa for their support during data acquisition. The authors are very grateful to the two editors, Derek B. Booth and John Dodson, and two anonymous reviewers for their critical comments and suggestions to improve the manuscript. This is CSIR NIO contribution No. 6947.