
I. INTRODUCTION
It is well-known that the reported problems of materials or structures failure are basically caused by fatigue. Reference Mutoh, Korda, Miyashita and Sadasue1 The fatigue crack growth life is predominant in the total life of materials or components with unavoidable notches. Therefore it is of paramount significance to assess the fatigue performance of the materials before putting them into service. The purpose of this work is to examine and evaluate the fatigue crack propagation behavior of Ni–17Mo–7Cr base superalloy. This kind of alloy exhibits a strong resistance to a wide variety of chemical environments, including strong oxidizers and acids. Reference Hashim, Babu, Duraiselvam and Natu2 The Ni–17Mo–7Cr superalloy under investigation is a typical Ni base solid solution strengthened alloy, specifically for use in molten fluoride nuclear reactors. Reference Xu, Jiang, Dong, Li and Zhou3 Currently the alloy series have been receiving a great deal of attention not only from the nuclear industries, but also aerospace, chemical processing, oil, and gas industries. Reference Abuzaid, Sehitoglu and Lambros4
As for the Ni–17Mo–7Cr base alloys, previous researches Reference McCoy5,Reference Briggs6 usually tried to build the relationship between microstructural evolution with their high-temperature strengths, creep performances, and so on. The preceding tests indicated that a eutectic-like structure will occur near the fusion line, when the alloy is welded. By using Gleeble simulator, the critical temperature at which the eutectic-like structure occurs is around 1300 °C. Reference He, Yang, Chen and Gao7 However, limited descriptions are available on the FCG characteristics of the alloy with such typical structures. The microstructural effects on fatigue properties have drawn increasing attention in recent years. Reference Sutton, Yang, Reynolds and Yan8 One point of view Reference Mutoh, Korda, Miyashita and Sadasue1,Reference Ewalds and Wanhill9 considered that the FCG behavior is affected by the microstructural factors in near-threshold region, whereas in Paris regime, the microstructure has less influence. Others believed that the fatigue performances both in the near-threshold region and Paris regime will be affected by microstructural variation. Reference Wang, Wang, Song, Liu and Xu10,Reference Korda, Miyashita, Mutoh and Sadasue11 Based on this the FCG tests were performed on the original and aged Ni–17Mo–7Cr alloy with eutectic-like structures. The aim of this work is to study the influence of microstructure on FCG characteristics in the Paris regime and to correlate the microstructural evolution with FCG behaviors.
II. MATERIALS AND METHODS
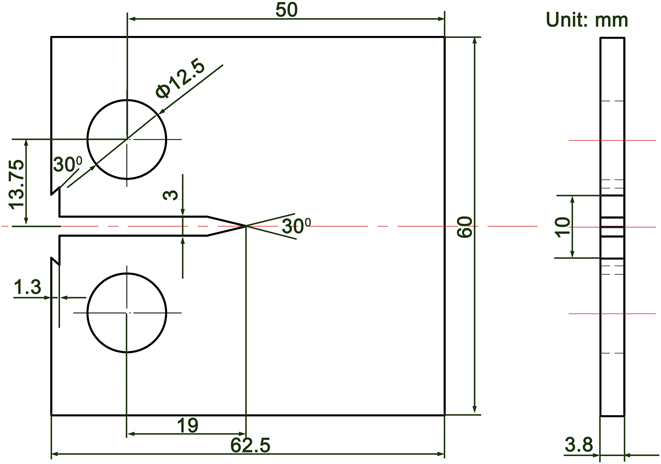
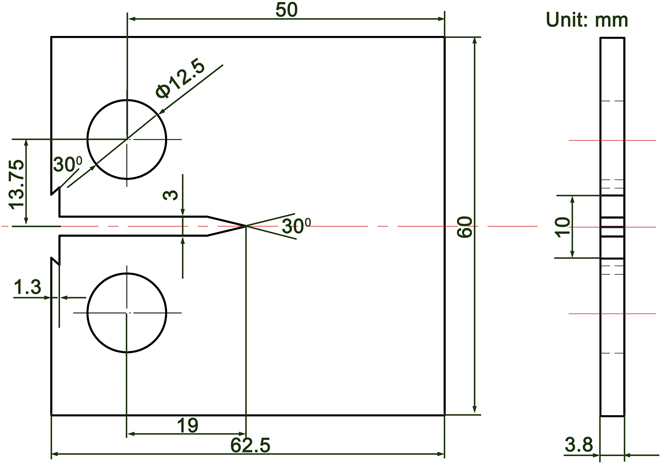
The composition of Ni–17Mo–7Cr base alloy used in the experiments is present in Table I. The casting alloys were first prepared by vacuum induction melting, followed by vacuum arc melting. The ingots obtained were hot rolled into sheets with a thickness of 4 mm. To obtain full eutectic-like structures, the alloy was thermally exposed at 1350 °C for 0.5 h. All the FCG experiments were performed using a uniaxial servo-hydraulic load frame in the ambient air (Instron 8872, Instron Corporation, Norwood, Massachusetts). The compact tension samples were used with the geometry shown in Fig. 1. During the tests, a sinusoidal waveform with a constant load amplitude and a frequency of 20 Hz were applied. The stress intensity factor (SIF) ranges ΔK for the CT samples can be derived from the following equation Reference Zheng, Yu and Jiang12 :
 $$\!\Delta K =\; {{\Delta P} \over {B\sqrt W }}{{\left( {2 + \alpha } \right)} \over {{{\left( {1 - \alpha } \right)}^{{3 \mathord{\left/ {\vphantom {3 2}} \right. \kern-\nulldelimiterspace} 2}}}}}\left( {0.886 + 4.64\alpha - 13.32{\alpha ^2} + 14.72{\alpha ^3} - 5.6{\alpha ^4}} \right)\quad ,$$
where W is the sample width, α = a/W (a is the crack length), ΔP is the applied loading range, and B is the sample thickness. The crack length was monitored and measured by a traveling long-distance microscope QM100 (attached on the Instron tester; Questar Corporation, New Hope, Pennsylvania) having an image capture resolution of 1 μm. The scanning electron microscopy (SEM; FEI Quanta 200F, FEI Company, Hillsboro, Oregon) was used to characterize the microstructure in the alloy before and after thermal exposure. The fatigue crack propagation paths and fracture surfaces were also examined. The transmission electron microscope (TEM) foils were prepared for the aged alloy and observed using a FEI Tecnai G2 F30 (FEI Company).
Composition of Ni–17Mo–7Cr base superalloy used in the experiments.

Samples geometry of FCG tests (in mm).
III. RESULTS
A. Microstructure of the Ni–17Mo–7Cr alloy before and after thermal exposure
The SEM studies indicate that the microstructure in the original alloy basically consists of the matrix and blocky particles. As shown in Fig. 2(a), some particles agglomerate at the grain boundaries. The back-scattered electron (BSE) image shows that the particles are present in the form of white phases [Fig. 2(b)]. The matrix is actually the Ni-base solid solution, in which Mo, Cr, and Fe are dissolved. The particles are primarily composed of Mo, Ni, Si, and C (55 wt% Mo, 32 wt% Ni, 6 wt% C, 4 wt% Si, 2 wt% Cr, 1 wt% Fe). Coupled with previous research, Reference He, Yang, Chen and Gao7 they are essentially the MoC. The thermally exposed microstructure is described in Fig. 3. The grains grow remarkably. Moreover, a eutectic-like structure appears at grain boundaries and in grain interiors, but the grain boundaries have the priority [Fig. 3(a)]. At high magnification [Figs. 3(b) and 3(c)], it was observed that many tiny particles are embedded in the structures. The BSE image in Fig. 3(d) shows that the dispersive particles and neighboring matrix are present in the form of eutectic structure. The EDS analysis shows that the tiny particles are made up of 43 wt% Mo, 41 wt% Ni, 8 wt% C, 5 wt% Si, 2 wt% Cr, and 1 wt% Fe, similar to that of the original MoC. It can thus be inferred that they may also be the MoC.
(a) SE and (b) BSE images of original Ni–17Mo–7Cr alloy.

SEM images of Ni–17Mo–7Cr alloy after thermal exposure: (a) SE image of the alloy, (b) SE image of eutectic–like structure, (c) magnified SE image of the eutectic–like structure, and (d) BSE image of the eutectic–like structure.

Figure 4 describes the TEM images of the aged alloy. In the typical structure, the selected-area diffraction pattern (SADP) for the matrix is indexed, as shown in Fig. 4(a), and they are identified to be the hexagonal Ni. The [0–10] zone axis SADP for the particles is obtained and they are determined to be the hexagonal MoC. The HRTEM and corresponding FFT results also indicate that the structure consists of the Ni and MoC [Figs. 4(d) and 4(e)].
Bright–field TEM micrographs of the aged alloy: (a) TEM micrograph of Ni and MoC, (b) TEM micrograph of the Ni, (c) TEM micrograph of the MoC, (d) HRTEM result of (b), and (e) HRTEM result of (c).

As above mentioned, the original alloy used basically consists of Ni matrix and MoC particles. The melting points of the Ni and MoC are 1455 °C and 2692 °C, respectively. Note that the peak temperature during thermal exposure is only 1350 °C. So the eutectic-like structures can't be introduced due to sole melting behavior of the Ni or MoC. Three ways may be possible to produce the particular structures in the aged alloy. The first is the decomposition of original MoC particles. High-temperature thermal exposure can make some phases breaking, granulating, and coarsening, as reported in Ref. Reference Lu and Wang13. Spheroidization of decomposition products usually occur in such a case since it will keep the system's free energy lowest. It can be seen from Fig. 3(c) that most of tiny MoC within the eutectic-like structures are present with lamellar shape. Compared with original MoC particles (2–10 μm), the eutectic-like structures (≫10 μm) are apparently larger. It can be therefore deduced that the structures can't be produced from the decomposition of original MoC. The second is that the structures may be formed through a eutectoid reaction, which belongs to a solid-state diffusion process. A eutectoid reaction is a three-phase reaction by which, on cooling, a solid transforms into two other solid phases at the same time, both with compositions and structures differing from the original. Note that the tiny MoC within the eutectic-like structures has same composition and structure with that of the original MoC particles. So they can't be originated from the eutectoid reaction. At last, the eutectic-like structures may also be produced through the melting of MoC particles with circumambient Ni matrix that share a eutectic composition. Floreen Reference Floreen, Fuchs, Yang and Loria14 described that carbide liquation can occur in the heat-affected zones of alloy 625 weldment. The Ni–17Mo–7Cr base alloy was measured by DSC in our previous research. Reference He, Yang, Chen and Gao7 A small endothermic peak can be found at around 1300 °C, which should be related to the phase transition behavior or melting of the phases with a lower melting point. We thus proposed that the small peak was formed through the melting behavior of eutectic structure between the MoC and adjacent Ni matrix. In addition, the MoC and Ni matrix in the eutectic-like structures are exhibited with lamellar morphologies, as shown in Figs. 3(c) and 3(d), similar to a typical eutectic structure. Localized melting to generate eutectic-like structures was also reported in Ref. Reference Briggs6. Based on the above analysis, formation mechanism of the eutectic-like structures was given:
When the heating temperature reaches 1300 °C during thermal exposure, the MoC particles and circumambient Ni matrix with local eutectic composition start to melt, forming localized molten zones. In the subsequent aging process more Ni matrix adjoining to the molten zones will be dissolved due to compositional gradient at the contact interface, enlarging the molten zones. Moreover, some individual molten zones can also link together to form a larger zone owing to localized segregation of MoC particles in original alloy. It should be mentioned that excessive Ni dissolution will also make the melt deviate from the eutectic composition. Upon cooling the bulk Ni are first solidified, followed by the eutectic of Ni and tiny MoC. As verified in Fig. 3(d), blocky Ni can be inspected in the structures. The eutectic temperature between the Ni and MoC is determined to be 1300 °C based on the DSC analysis, but the eutectic composition is hard to be obtained due to absence of MoC–Ni pseudo-binary diagram.
B. FCG behavior of original Ni–17Mo–7Cr alloy
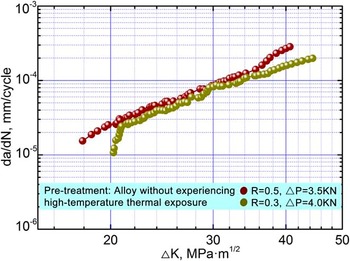
In fatigue experiments, the FCG process can be roughly divided into three regions: slow expanding region I, steady expanding region II, and rapid expanding region III. More attention should be paid to the region II, namely Paris regime, since it can be used to predict the fatigue life of materials or structures. Figure 5 plots the curves of FCG rate, da/dN, versus SIF range, ΔK, obtained for the Ni–17Mo–7Cr alloy under stress ratio R (the minimum load over the maximum load in a loading cycle) of 0.3 and 0.5. As described, the relationship of the ΔK and da/dN is approximately linear in the double logarithmic coordinates. The stress ratio will affect the FCG rate, and samples with a higher stress ratio usually lead to a higher FCG rate under the same SIF range. Reference Zheng, Yu and Jiang12 For a given ΔK, a higher da/dN is obtained when introducing the higher stress ratio. The FCG rate in the linear region is known to be related to ΔK by the Paris equation Reference Song, He, Ma and Xu15 :
 $${{{\rm{d}}a} \over {{\rm{d}}N}} = C{\left( {\Delta K} \right)^m}\quad ,$$
where Paris exponent m is the curve slope in the linear region, while Paris constant C is determined by extending the straight line to ΔK = 1.0 MPa m1/2.
FCG behavior of the Ni–17Mo–7Cr alloy under stress ratios of 0.3 and 0.5.

Figure 6 depicts the typical crack growth paths in the Paris regime obtained for the Ni–17Mo–7Cr alloy under stress ratio of 0.3. It can be seen from Fig. 6(a) that the trans-granular crack predominates during the tests. When the crack approaches the MoC particles in its propagation, as shown in Figs. 6(b) and 6(c), the normal propagation path is blocked and these particles will be bypassed. Since hard MoC particles were difficult to cut, circumventing them would consume less energy. The crack deflection or meandering was thus produced, resulting in a tortuous crack growth path. The phenomenon is quite common in alloys containing precipitates or composites. Reference Guan and Yu16–Reference Chen, Chaturvedi, Goel and Richards19 The crack deflections will reduce the SIF range experienced by the crack and then decrease the driving force of FCG. Besides, a higher degree of roughness of crack surface could also be produced in such a case, promoting roughness-induced crack closure. Since a certain amount of applied force is spent to re-open the mating faces in contact near the crack tip, a higher closure means less force will be acting on the crack tip. As illustrated in Fig. 6(b), some particles cluster around the crack. Hard particle agglomeration in front of the crack will offer a continuous barrier to crack propagation. Reference Korda, Mutoh, Miyashita, Sadasue and Mannan20 At last, large-angle crack deflections almost of the order of 90° can also be found in the propagation paths [Figs. 6(d) and 7]. They might have arisen due to the crack encountering of the particles or alteration of slip bands' direction. In ductile metals, it has been well established that the FCG is actually an evolving process of intense localized deformation in slip bands near the crack tip. The dislocation slip is usually along the close-packed planes, such as the {111} planes for most of Ni-base alloys. Reference Wang, Wang, Song, Liu and Xu10 Since the crack propagates along the slip bands with close-packed planes, its growth paths will deflect when the slip along one group of close-packed planes changes to another or enters into another grain. It was observed from Fig. 7 that direction alteration of slip bands can be evidently seen. In fact, the large-angle crack deflection can also improve the roughness of crack surface, limiting the maximum crack-tip SIF. Reference Suresh21 On the basis of above analysis, the FCG rate da/dN increases smoothly with increasing the ΔK.
A typical example of FCG paths in the Paris regime obtained for the Ni–17Mo–7Cr alloy under stress ratio of 0.3: (a–c) SEM micrographs showing the crack deflection when it encounters the particles, and (d) large–angle crack deflection.

SEM image showing the typical FCG paths, the slip bands appear coupled with the penetrating crack.

C. FCG behavior of Ni–17Mo–7Cr alloy after thermal exposure
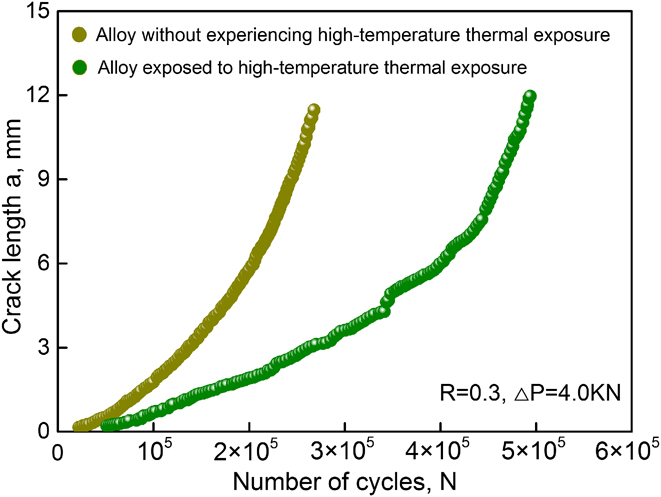
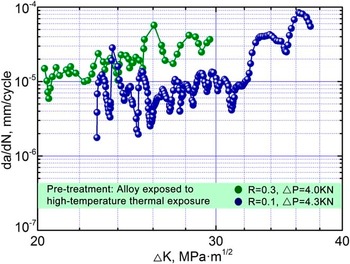
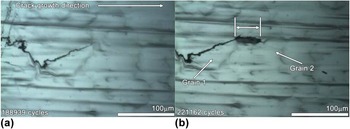
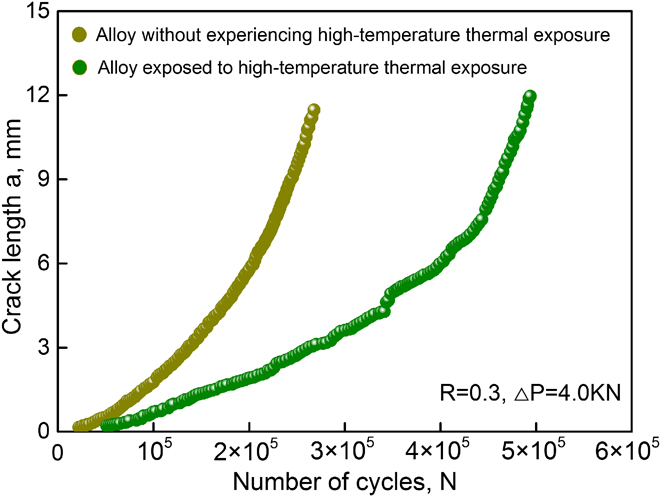
The N–a plots for the case of R = 0.3 are described in Fig. 8. It can be seen from the figure that for the original and aged alloy, the cracks propagate slowly after initiation and then quickly at the later stage of fatigue life. At a given loading cycle, the crack propagates at a higher speed in the original alloy indicated by a steeped slope in the curve. The FCG characteristic of the aged Ni–17Mo–7Cr alloy with stress ratio of 0.1 and 0.3 is shown in Fig. 9. A common linear relationship between the da/dN and ΔK is not found. Particularly, the FCG rate is waving with increasing the SIF range for both two stress ratios. In-situ optical microscope images during FCG tests are described in Fig. 10. When the crack tip passes through grain 1 to enter grain 2, a region with a length of 50 μm needs to be crossed. Nearly 32,223 fatigue cycles are expended, resulting in a lower FCG rate in the region. The undulation in Fig. 9 should be correlated with the crack tip encountering such unique regions. The morphologies of typical FCG paths are exemplified in Fig. 11. Figure 11(a) shows that the transgranular crack is still the primary crack growth mode. As has been noted, the eutectic-like structures will emerge in the aged alloy. When the crack encounters these structures, Fig. 11(b) indicates that it will cut through them rather than bypass them. Note that the structures have a substantial number of tiny carbides inside. As shown in Fig. 11(c), the tiny particles maintain their morphologies without breaking. This fact gives a hint that the crack bypasses the tiny particles when cutting through such structures, creating wavy and tortuous morphologies. The undulation in Fig. 9 is elucidated: the crack initiates and propagates in the matrix while applying fatigue load. The da/dN increases with increasing the ΔK. When the crack approaches the eutectic-like structures, it will cut through them but bypass tiny particles within the structures. Note that the distance between each particle is less than 0.5 μm. Bypassing so many tiny particles will create substantial crack deflections. A higher degree of roughness-induced closure effect is therefore produced, retarding the FCG rate. When the crack traverses the structures and enters the matrix, the FCG rate starts to increase. As the alloy has the eutectic-like structures scattering evenly, the waved da/dN–ΔK curve is therefore coming into being.
Crack length as a function of fatigue cycles in the alloy before and after thermal exposure.
FCG behavior of the aged Ni–17Mo–7Cr alloy under two stress ratios of 0.1 and 0.3.

In–situ observation of the crack growth paths under different fatigue cycles. (a) 188939 cycles and (b) 221162 cycles.

Typical FCG paths in the Paris regime obtained for the aged Ni–17Mo–7Cr alloy under stress ratios of 0.3: (a–c) SEM images showing the crack cutting through the eutectic–like structures, and (d) large–angle crack deflection.

D. Fatigue fractography analysis
Figure 12 shows the typical fracture surfaces in the Ni–17Mo–7Cr alloy before and after thermal exposure. As can be seen from Figs. 12(a) and 12(c), the quasicleavage fracture in company with plastic tearing ridges can be observed in the near threshold region. The Paris regimes are primarily characterized by typical parallel fatigue striations [Figs. 12(b) and 12(d)]. Generally fatigue striations are prone to occur in ductile materials. It should be noted that the eutectic-like structures appear in the aged alloy. Occurrence of fatigue striations in the aged alloy signifies that it still maintains ductility.
Morphologies of fatigue fracture surface obtained for the Ni–17Mo–7Cr alloy before and after thermal exposure: (a) in near threshold region (before thermal exposure), (b) in Paris regime, (c) in the near threshold region (after thermal exposure), and (d) in the Paris regime.

IV. DISCUSSION
Comparing Fig. 5 with Fig. 9, it is noteworthy that the Ni–17Mo–7Cr alloy before and after thermal exposure exhibit diverse FCG behaviors. The relation of the da/dN and ΔK is almost linear for the original alloy, being consistent with most materials reported. Reference Li, Pan, Wang and Shi17–Reference Korda, Mutoh, Miyashita, Sadasue and Mannan20 When the alloy was thermally exposed, however, the waved da/dN–ΔK curve is exhibited. For a given ΔK, the FCG rate in the aged alloy is always lower than that in the original alloy, suggesting its superior FCG resistance. The following factors were believed to slow down the FCG rate in the aged alloy:
Firstly, it was observed that the microstructure of original alloy is typical of a particulate-reinforced metal matrix composite (MMC), in which the Ni is matrix and MoC particles act as reinforcements. It can be seen from Fig. 2(a) that volume fraction of MoC particles with approximate round shape is about 3.2% and particle size ranges from 2 to 10 μm. When the crack encounters the particles during FCG tests, Fig. 6 demonstrates that it will bypass them, creating crack deflections. That is to say, the crack propagates constantly in the matrix during the whole tests. It should be mentioned that even the particle size is 2 μm, as shown in Figs. 6(b) and 6(c), particle cracking can seldom be observed. Note that particle fracture can lead to cycling softening of the matrix and increase the plastic strain, being adverse to fatigue life. Circumventing particles, however, are encouraging, since it will be beneficial to the fatigue life owing to crack deflections.
The high-temperature thermal exposure brings diverse microstructure in the alloy. During the process the MoC particles melted with circumambient Ni matrix, generating eutectic-like structures. That is to say, the aged alloy is mainly made up of the Ni matrix and eutectic-like structures. The SEM and TEM analysis show that the eutectic-like structures are actually the mixture of Ni matrix and tiny MoC particles. It can be seen from Figs. 3(c) and 3(d) that most of MoC within the structures have irregular shapes and the mean particle size is less than 1 μm. Note that the eutectic-like structures were produced from the MoC particles in the original alloy. In comparison with the amount of original MoC particles, quantity of eutectic-like structures should be lower in consideration of the combination of localized molten zones during thermal exposure. In the aged alloy volume fraction of eutectic-like structures can arrive at roughly 2.7%. When the crack approaches the particular structures, it will enter the structures but bypass the tiny MoC particles within them. Note that the tiny MoC has the mean particle size less than 1 μm. In such a case particle fracture may occur under the dual action of cyclic loading and stresses raised by the sharp corners of particles. This phenomenon, however, did not occur. During crack expanding the tiny MoC in fact maintain integrity due to high hardness. We have reported that the nano-scale hardness of MoC can reach 22.3 MPa. Reference He, Yang, Fu, Wang and Gao22 Note that the MoC particles are scattered densely in the eutectic-like structures, as demonstrated in Fig. 11(b). Circumventing so many tiny MoC will produce substantial crack deflections, retarding the FCG rate greatly. In this way a higher degree of roughness-induced crack closure would be produced, improving the FCG resistance.
Secondly, occurrence of a reversed plastic zone ahead of a crack tip has long been recognized during FCG tests. It is a continuous procedure of crack passing through the plastic zone that promotes the fatigue crack propagation. The size of cyclic plastic zone (r c) can be estimated from the following equation Reference Ma, Qian, Meng, Liu and Zhang18 :
 $${r_{\rm{c}}} = {1 \over \pi }{\left( {{{\Delta K} \over {2{\sigma _{{\rm{ys}}}}}}} \right)^2}\quad ,$$
where
 ${\sigma _{{\rm{ys}}}}$
is the yielding strength. Note that the eutectic-like structures are essentially a mixture of the Ni matrix and tiny MoC particles. In comparison with the Ni, the eutectic-like structures should have a higher yielding strength. Based on this a smaller r
c would be produced in the eutectic-like structures under the same ΔK. At a given ΔK, smaller is the size of plastic zone, lower will be the FCG rate. In this work constraint of plastic deformation in the eutectic-like structures contributed to a significant plasticity-induced crack closure. The plastic zones described in Fig. 13 can be observed around the crack tip, which are defined as the regions with visible slip bands. Massive slip bands can be found beside the penetrating crack in the original alloy [Fig. 13(a)]. After thermal exposure, they still occur in the Ni matrix [Fig. 13(b)]. In the eutectic-like structures, however, less slip bands can be inspected [Figs. 13(c) and 13(d)].
Observed plastic zones along the crack paths in the alloy before and after thermal exposure: (a) original alloy, (b–c) aged alloy, and (d) magnified image of white rectangle in (c).

Thirdly, crack branching will affect the FCG rate. Reference Wang, Wang, Song, Liu and Xu10,Reference Korda, Miyashita, Mutoh and Sadasue11 In the original alloy, as illustrated in Fig. 7, the crack branching only occurs together with the large-angle crack deflections. In the aged alloy, however, they can be frequently observed along the crack paths. Figures 14(a)–14(c) show that they always appear after passage of the crack tip cutting through the eutectic-like structures. Besides, several secondary cracks can still be found beside the large-angle crack deflections [Fig. 14(d)]. The crack branching will modify the crack-tip stress field and produce a shielding effect in the overlapping segments. The driving force of mode I crack is hence reduced and energy of crack tip is also dissipated. That is to say, frequent occurrence of crack branching in the aged alloy would also retard the crack propagation.
Secondary cracks in the aged alloy: (a–c) SEM images showing the crack branching when it cuts through the eutectic–like structures, and (d) secondary cracks near the large–angle crack deflection.

In general, the FCG rates are actually governed by the crack–tip effective SIF range ΔK eff, rather than the crack-tip SIF range ΔK max. Other factors, like closure effect and crack branching, can also affect the FCG rates. From this consideration the ΔK eff can be given below Reference Mutoh, Korda, Miyashita and Sadasue1 :
 $$\Delta {K_{{\rm{eff}}}} = {K_{\max }} - {K_{{\rm{closure}}}} - {K_{{\rm{shielding}}}}\quad ,$$
where the SIF arising from the crack closure and crack–tip stress shielding are expressed by K closure and K shielding. In this work the K closure is related to roughness-induced closure and plasticity-induced closure, while the K shielding corresponds to crack branching. As mentioned above, the K closure and K shielding in the eutectic–like structures are larger than that in the matrix under the same condition. In this respect the ΔK eff would decrease when the crack passed through the particular structures. Decreasing ΔK eff means that less applied force would be actually acting on the crack tip, improving the resistance of crack growth. Therefore a lower FCG rate was produced in the aged alloy at a given ΔK.
Comparing Fig. 2 with Fig. 3, it is obvious that the grains grow when the alloy was aged. Effect of grain size on FCG rates has been extensively studied. Reference Jeong, Choi, Goto, Lee and Kim23 It is accepted that the grain size has two contradictory intrinsic effects on the FCG behavior of metals. Reference Jiang, Karpasitis, Gao and Reed24 On one hand, a fine-grained material has more grain boundaries acting as the barriers to dislocation motion or crack growth, exhibiting a good crack growth resistance. On the other hand, degree of slip planarity and reversibility will increase in the metals with a larger grain size, improving the strain localization of plastic zones. Reference Jiang, Karpasitis, Gao and Reed24 The localized slip deformation will reduce damage accumulation ahead of a crack tip and finally decrease the FCG rates. In this work, the crystallographic facets or steps can be clearly seen on the fracture surfaces in near threshold region both in the original and aged alloy [Figs. 12(a) and 12(c)]. This fact means that enhanced slip reversibility occurred, and the FCG rates were hence governed by a crystallographic cleavage mechanism. While in Paris regime, occurrence of fatigue striations [Figs. 12(b) and 12(d)] signifies that the FCG rates were controlled by a classical trans-granular ductile striation mechanism, in which the crack would propagate by a continuous crack blunting and sharpening model. In this way influence of grain size on the FCG rates was negligible.
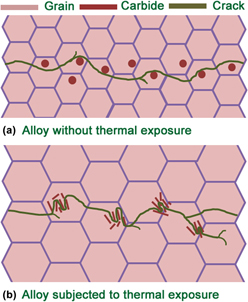
Figure 15 shows the schematic drawings to unveil the crack growth mechanisms in the Ni–17Mo–7Cr alloy before and after thermal exposure. As for the original alloy, the crack expands in the matrix with a trans-granular mode. When it encounters the carbide particles in its growth paths, the crack will bypass them and induce crack deflections [Fig. 15(a)]. After thermal exposure, the trans-granular crack is still the main crack growth mode [Fig. 15(b)]. When the crack approaches the eutectic-like structures in the aged alloy, it will cut through them but bypass tiny particles within the structures. A higher degree of crack growth resistance is then produced based on followings: intense crack deflection; severe plasticity–induced closure effect and extensive crack branching.
Schematic illustrations of crack growth paths in the Ni–17Mo–7Cr alloy (a) before and (b) after thermal exposure.

V. CONCLUSIONS
The high-temperature thermal exposure brings the eutectic-like structure in the Ni–17Mo–7Cr alloy, which is actually the mixture of Ni matrix and dispersive tiny MoC. The typical structure is produced through localized melting of the MoC and neighboring matrix that share a local eutectic composition.
As for the original alloy, the relationship between the da/dN and ΔK is linear in the Paris regime. The crack propagates in the matrix with a trans-granular mode. When it encounters the MoC particles scattered, the crack will circumvent them and lead to crack deflections.
The relationship between the da/dN and ΔK is waved in the aged alloy. When the crack approaches the eutectic-like structures, it will cut through them but bypass tiny particles within the structures. The following factors are considered to contribute to the higher degree of crack growth resistance in the aged alloy: intense crack deflection; severe plasticity-induced closure effect; extensive crack branching.
ACKNOWLEDGMENTS
The financial support of National Natural Science Foundation of China under Grant Nos. 51405439 and 51475426 is highly acknowledged.