I. INTRODUCTION
Nickel oxide (NiOx), a wide band gap (>3.0 eV) semiconductor, has a stable cubic structure (NaCl type) with octahedral Ni(II) and O2− sites having lattice constant, a = 4.177 Å.Reference Fasaki, Giannoudakos, Stamataki, Kompitsas, György, Mihailescu, Roubani-Kalantzopoulou, Lagoyannis and Harissopulos 1 – Reference Liu, Zheng, Yan and Feng 3 NiOx is a potential candidate for transparent electronics, next-generation blue- and UV-light emitting and lasing devices, bio-sensors, antiferromagnetic layers, electrochromic devices, supercapacitor, etc.Reference Fasaki, Giannoudakos, Stamataki, Kompitsas, György, Mihailescu, Roubani-Kalantzopoulou, Lagoyannis and Harissopulos 1 – Reference Chen, Wu, Smith and Ignatiev 5 Nowadays, NiO attracts great attention because of its powerful application in organic photovoltaics by serving as the hole-transporting/electron-blocking interfacial layer to minimize interfacial power losses and hence suppression of the dark current owing to its high work function.Reference Irwin, Buchholz, Hains, Chang and Marks 6 – Reference Dutta, Gupta, Gupta and Narayan 8 NiO in bulk form is classified as a Mott–Hubbard insulator with very low conductivity (∼10−11 Ω−1 m−1) at room temperature.Reference Irwin, Buchholz, Hains, Chang and Marks 6 – Reference Dutta, Gupta, Gupta and Narayan 8 The conductivity of NiO can be increased by controlling the processing conditions or by doping of monovalent impurities such as lithium.Reference Dutta, Gupta, Gupta and Narayan 9 NiO is synthesized in general with p-type conductivity by hole transport originated from nickel vacancies and oxygen interstitials.Reference Alders, Voogt, Hibma and Sawatzky 10
To fabricate p-n junctions, which is critical for the realization of next-generation oxide electronics, p-type NiO and doped n-type zinc oxide (ZnO) semiconductors have been exploited.Reference Chen, Ruan, Wu and Bao 11 However, these heterojunctions showed unsatisfactory rectifying characteristics, i.e., large reverse-bias leakage current due to the presence of interface states or defects between two different oxide layers. Improved rectification in these heterojunctions has been demonstrated using sandwiched intrinsic layer of ZnO but at the cost of increased complexities and higher cost.Reference Dutta, Gupta, Gupta and Narayan 9 , Reference Long, Fang, Huang, Mo, Xia, Dong, Meng and Zhao 12 To overcome these problems there is an emerging interest in the research community to realize both p-type and n-type system using the same oxide material, so that interface states and traps associated with misfit dislocations could be minimized.Reference Chu, Wang, Zhou, Lin, Chernyak, Zhao, Kong, Li, Ren and Liu 13 – Reference Chen, Lu, Wu, Song, Lee, Lu, Chang, Chou, Wang and Chen 15 Fabrication of a wide band gap (WBG) oxide material with tunable conductivity of p-type as well as n-type is a challenging task, where only ZnO is reported to exhibit both type of conductivities.Reference Chu, Wang, Zhou, Lin, Chernyak, Zhao, Kong, Li, Ren and Liu 13 , Reference Lu, Song, Lu, Chen, Gao, Chen and Wang 14 Unfortunately, reliability and reproducibility of p-type ZnO thin films are questionable because of high ionization energy of acceptor impurities, low solubility of dopants, and self-compensation effect.Reference Chen, Lu, Wu, Song, Lee, Lu, Chang, Chou, Wang and Chen 15 Hence, efforts are continuing worldwide toward search of other possible WBG oxide materials whose electrical property could be tailored with both n-type and p-type conductivities while maintaining good optical transmission.
Thin films of NiOx have been deposited using sputtering, oxidation of nickel at high temperatures, chemical vapor deposition, spray pyrolysis, sol–gel route, electron beam evaporation and pulse laser deposition.Reference Irwin, Buchholz, Hains, Chang and Marks 6 – Reference Dutta, Gupta, Gupta and Narayan 8 , Reference Wu and Yang 16 – Reference Stamataki, Tsamakis, Brilis, Fasaki, Giannoudakos and Kompitsas 18 Among all of them, sputtering is identified to be the most suitable technique because of its better control over reproducible stoichiometry and deposition of uniform thin film necessary for device applications. There are very few reports on the growth of n-type or electron doped NiOx.Reference Reinert, Steiner, Hiifner, Schmitt, Fink, Knupfer, Sand and Bertel 19 The electron doping in NiO has been carried out by the postdeposition annealing treatment in the reducing ambient (vacuum annealing).Reference Reinert, Steiner, Hiifner, Schmitt, Fink, Knupfer, Sand and Bertel 19 Recently, there has been a feasibility report on the transformation of electrical conductivity of NiO thin films grown by pulsed laser deposition (PLD).Reference Gupta, Dutta, Mal and Narayan 20 The conductivity was transformed from p-type to n-type after irradiating NiO thin films with high power UV laser followed by a thermal annealing treatment at 573 K, which increases the processing complexities and the cost of manufacturing n-type NiO becomes extremely high.Reference Gupta, Dutta, Mal and Narayan 20 Furthermore, irradiation with a large number of laser pulses (about 10) is expected to degrade the sample surface and crystalline quality of the prepared samples. The optical transmission also becomes poor in the visible region, which limits the use of NiO thin films for transparent electronic applications.Reference Gupta, Dutta, Mal and Narayan 20 Therefore, an appropriate approach to achieve the tunable conductivity with both n and p types in NiO thin films is essentially required without degrading its optical and structural properties.
In the present work, we have demonstrated successfully the reproducible growth of NiO thin films with tunable electrical conductivity (both n-type and p-type) using radio frequency (RF) sputtering technique under the influence of postdeposition annealing. The obtained results are encouraging and will pave way for the fabrication of NiOx thin film-based p-n homojunction for low-cost short wave length transparent electronic devices.
II. EXPERIMENTAL
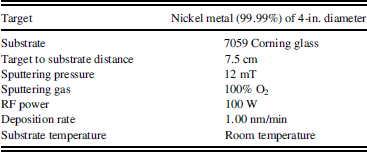
Nickel oxide (NiOx) thin films were deposited on a 7059 Corning glass substrate using a 4-in. diameter nickel (Ni) metal target (99.99% pure) by RF sputtering technique. The thin films were deposited without any substrate heating under 100% oxygen ambient. The typical deposition conditions are listed in Table I. The film thickness was measured using a surface profiler (Dektak 150A, Tucson, AZ) and was kept fixed at around 110 nm in the present work. After deposition of NiO thin film the substrate was sectioned into six small pieces (1 × 1 cm) for postdeposition annealing treatment and further characterization. This was adopted to minimize the influence of any changes in the properties of as-deposited NiOx thin film caused by the plasma variations at different positions in the sputtering system or the slight variation in processing conditions during different runs. The deposited films were annealed in a temperature-controlled tube furnace at different temperatures (373, 473, 573, 673, and 773 K) for 2 h in atmospheric air.
Deposition parameters for NiOX thin film.

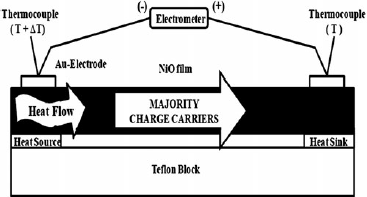
The structural and optical properties of the thin films were investigated using x-ray diffractometer (Bruker D8 Discover, Billerica, MA) and a double beam UV-Visible spectrophotometer (Perkin Elmer, Lambda 35, Waltham, MA), respectively. Thickness and surface roughness of the NiOx thin films were examined using a surface profiler (Dektak 150). The electrical properties (conductivity, carrier concentration, and mobility) of the NiOx thin films were measured by the Hall measurement system using van der Pauw method at room temperature in a magnetic field of 0.3 T. Experimental errors arising from geometrical effects of the films were minimized by placing silver contacts at the corners of a 1 × 1 cm2 sample deposited on a Corning glass substrate (7059). A specially designed thermoelectric power (TEP) measurement setup as shown in Fig. 1 has been used to confirm the type of conduction in the as-grown and annealed NiOx thin films. The setup consists of a copper heat sink, maintained at a constant low temperature (300 K), which is in good contact with one end of the thin film known as cold end. The other end of the thin film is attached to a mini copper heat source (hot end), which could be heated resistively up to a temperature of 400 K using a variable DC power supply and precise temperature controller. Two thermocouples (Chromel alumel) were used to measure the temperature gradient (∆T) between the two ends (hot and cold ends) of the thin film (Fig. 1). The entire setup is enclosed in a sample cell whose temperature (surrounding temperature) could also be varied. The induced thermo electromotive force (thermo-emf) in the NiOx thin film samples was measured using an electrometer (Keithley Instruments, Inc., Cleveland, OH) by changing the temperature of the hot end of the NiOx thin film samples and keeping the cold end at a fixed temperature of 300 K (Fig. 1). For electrical measurements, gold (Au) parallel electrodes were deposited over the surface of NiO thin films using RF sputtering using a shadow mask. The Au was found to give an ohmic contact with the NiO thin films and therefore was selected for electrical contacts to carry out the Hall effect and thermo-emf measurements.
Setup for the measurement of Thermo-emf in NiOx thin film.

III. RESULT AND DISCUSSION
A. Structural properties
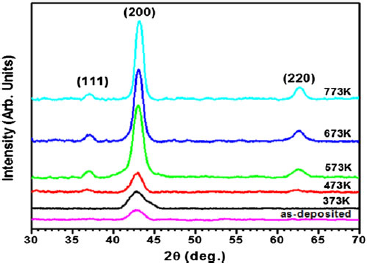
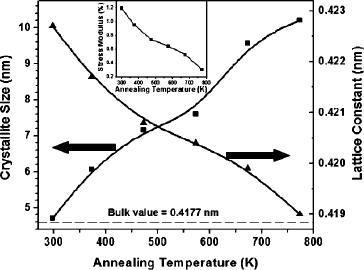
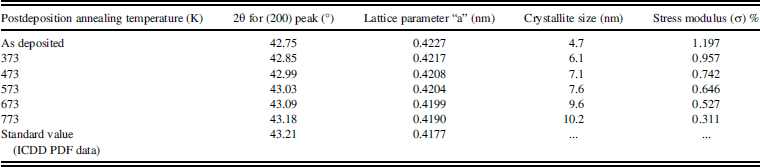
Figure 2 shows the x-ray diffraction (XRD) spectra of the as-deposited and postdeposition annealed NiOx thin films. The as-deposited NiOx thin film shows the presence of a weak and broad XRD peak at around 2θ ∼ 42.75°, which corresponds to the (200) plane of the cubic (fcc) NiO phase. It can be seen from Fig. 2 that the crystallinity of the NiOx thin film improved with the postdeposition annealing treatment and may be attributed to decrease in native defects in the NiOx film with increase in annealing temperature.Reference Sato, Minami, Takata and Yamada 21 A preferred oriented and sharp diffraction peak corresponding to (200) plane along with weak peaks corresponding to (111) and (220) planes are observed in the NiOx thin films (Fig. 2) annealed at higher temperatures (≥473 K), indicating improved crystallinity. This is due to the fact that postdeposition annealing provides sufficient thermal energy to the atomic species enhancing their mobility. Hence, they have a higher probability to reach the equilibrium position, and NiOx thin films show preferred orientation, having most of the crystallites oriented along (200) the crystallite plane, which have minimum surface energy. Table II summarizes the values of 2θ corresponding to (200) XRD peak with the lattice parameter “a” for as-grown and NiOx thin films annealed at different temperatures (373–773 K). The XRD peak corresponding to (200) plane for the as-grown NiOx thin film was found to be at about 2θ ∼ 42.75°, which is slightly lower than the corresponding value (43.21°) reported for bulk NiO.Reference Ryu, Choi, Lee and Park 17 , Reference Reinert, Steiner, Hiifner, Schmitt, Fink, Knupfer, Sand and Bertel 19 The lowering of the 2θ value from the bulk value may be associated with the corresponding increase in the lattice parameter “a” (Table II) and the presence of strain in the as-deposited NiO thin film. The crystallite size of the as-grown and postdeposition annealed NiOx thin films is evaluated using the Scherrer’s relation for the dominant (200) reflection peakReference Cullity 22 and is listed in Table II. All as-grown and postdeposition annealed NiOx thin films were found to be nano-crystalline (Table II). The estimated value of crystalline size was found to increase slowly from about 4.7–10.2 nm with increase in annealing temperatures up to 773 K (Fig. 3), which is due to activation of grain growth and coalescence process with thermal energy.Reference Maniv, Westwood and Colombini 23 , Reference Chen, Lu and Hwang 24
X-ray diffraction patterns of NiOx thin film annealed at different temperatures.

Variation in the crystallite size and lattice constant for NiOx thin films as a function of postdeposition annealing temperature. Inset: effect of annealing temperature on the stress modulus of NiOx thin films.

Influence of postdeposition annealing on the structural parameters of NiOx thin films.

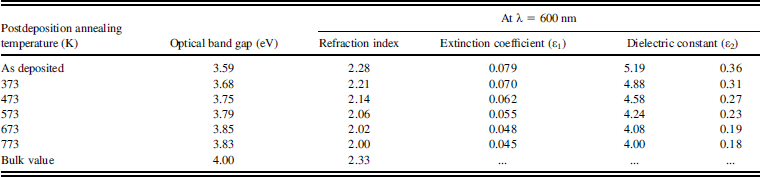
Optical constants of NiOx thin films annealed at different temperatures.

Various electrical parameters obtained by Hall effect measurements for NiOx thin films annealed at different temperatures.

Variation in the estimated value of lattice constant “a” for as-grown and postdeposition annealed NiO thin film as a function of annealing temperature is shown in Fig. 3. The value of lattice parameter “a” (0.4227 nm) obtained for as-grown NiOx thin film was much higher in comparison to the corresponding value reported for bulk NiO.Reference Irwin, Buchholz, Hains, Chang and Marks 6 – Reference Dutta, Gupta, Gupta and Narayan 8 The much higher value of lattice constant for as-grown NiOx thin films indicates that the unit cell is expanded along the growth direction (a-axis) having large amount of stress and may be due to the presence of defects in the NiOx lattice. The values of 2θ and hence the lattice parameter “a” of NiO thin film are found to be approaching the corresponding bulk value reported for fcc NiO phase with increase in annealing temperature (Table II), showing the relaxation of unit cell and therefore presence of the minimal stress. The estimated value of lattice parameter “a” is also used to evaluate the modulus of stress or average uniform strain (σ) present in the lattice of NiOx for (200) plane using the relation,Reference Sato, Minami, Takata and Yamada 21 , Reference Maniv, Westwood and Colombini 23
 $$\sigma = {{a - a_0 } \over {a_0 }}\quad,$$
where a is the lattice constant obtained from the strong (200) reflection in the x-ray pattern and a 0 is the corresponding lattice constant for bulk NiO. Plot of stress modulus (%) obtained for NiOx thin films as a function of postdeposition annealing temperature is shown in the inset of Fig. 3. The average value of uniform strain present in the lattice of NiOx thin film was found to decrease from 1.20 to 0.31 with increase in the annealing temperature (inset of Fig. 3). The obtained results depict that the lattice having tensile strain in the as-grown NiOx thin film is relaxing with the postdeposition annealing treatment at higher temperatures and is attributed to the annealing out the defects present in the as-grown NiOx thin films.
B. Surface analysis
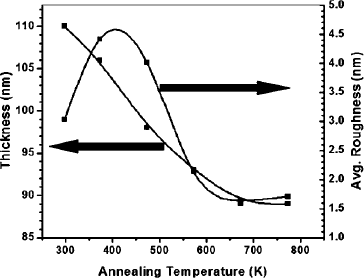
Figure 4 shows the variation in the average surface roughness of NiOx thin films as a function of postdeposition annealing temperature. The average surface roughness of all as-grown and annealed NiOx thin films is relatively small (<5 nm) indicating the growth of good quality films. The surface roughness of NiOx thin films is found to remain almost the same (3–4 nm) with increase in annealing temperature up to 473 K (Fig. 4). However, a slight decrease (<2 nm) in surface roughness in NiOx thin film is observed with further increase in the annealing temperature (≥573 K). Texture of NiOx thin film depends on the nucleation centers and the presence of native defects, which in turn depends on the annealing temperature.Reference Chen, Lu and Hwang 24 , Reference Puspharajah, Radhakrishna and Aroif 25 It is known that the atomic species tend to crystallize along the energetically favored crystalline planes having lowest energy; hence, the random stacking on room temperature substrate leads to a rough surface morphology.Reference Chen, Lu and Hwang 24 , Reference Puspharajah, Radhakrishna and Aroif 25 The NiOx thin film is known to have a large number of native defects especially related to oxygen vacancies or nickel interstitials. However, with postdeposition annealing temperature (≥573 K), the defects are expected to be annealed out, and the atomic species get sufficient thermal energy to settle down at the energetically stable sites, thereby resulting in growth of NiOx thin film with reduced surface roughness and denser morphology. It is also interesting to note that the thickness of NiOx thin film decreases slightly from 110 to 89 nm with increase in annealing temperature up to 673 K and thereafter becomes constant (Fig. 4). The observed decrease in film thickness is attributed to the possible decrease in porosity of the film due to increase in size of crystallites and denser morphology with postdeposition annealing.
Variation in average surface roughness and thickness of NiOx thin film as a function of annealing temperature.

C. Optical properties
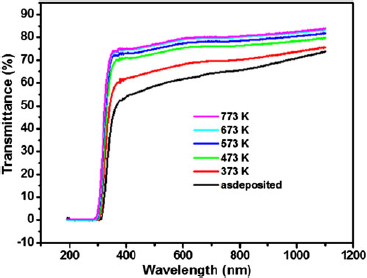
The transmission spectrum of the as-deposited and annealed NiOx thin films as a function of wave length (190–1100 nm) is shown in Fig. 5. The as-deposited NiOx thin film exhibits a relatively low transmission (∼65%) in the visible region. The optical transmission was found to increase continuously with increase in the postdeposition annealing temperature (373–673 K) and saturates at a maximum value of about 85% for NiOx thin film annealed at 673 K (Fig. 5). The observed increase in optical transmission of NiOx thin film is attributed to the reduction in the native defects and improved crystallinity of the film with the postdeposition annealing treatment. The scattering centers, which are responsible for reduction in transmitted light, are reduced due to decrease in native defects in NiOx thin film with annealing temperature, thereby resulting in higher transmission. The higher value of optical transmission (Fig. 4) observed in the entire wave length range for annealed NiOx thin films is technologically important specifically for energy efficient device applications. The transmission spectrum of the as-grown NiOx thin film shows the onset of a sharp fundamental absorption edge at around 320 nm (Fig. 5). The fundamental absorption edge was found to shift toward the lower wave length with increase in the annealing temperature (Fig. 5). The variation in optical absorption edge is related to the lattice imperfections or defect states of the thin film, which in the present case may be associated with the decrease in nickel- or oxygen-related point defects with postdeposition annealing.Reference Maniv, Westwood and Colombini 23 , Reference Subrahamanyam 26 From the XRD analysis also, it is found that the crystallinity of NiOx thin film improves due to reduction in native defects with annealing temperature.
Influence of postdeposition annealing on the transmission spectra of NiOx thin film.

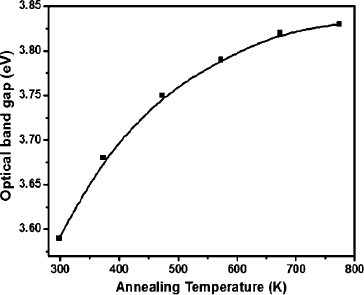
Optical band gap (Eg ) of the NiOx thin films was estimated from the Tauc plot of (αhν)2 versus photon energy (hν), where α is the absorption coefficient and ν is the optical frequency. The estimated value of band gap for as-grown NiOx thin film was about 3.59 eV. The variation of band gap of NiOx thin film as a function of annealing temperature is shown in Fig. 6. The value of band gap was found to increase from 3.59 to 3.83 eV with increasing the annealing temperature up to 773 K (Fig. 6). The obtained values of band gap of NiOx thin film annealed at different temperatures are well within the range reported by various workers for NiO thin films.Reference Sato, Minami, Takata and Yamada 21 , Reference Puspharajah, Radhakrishna and Aroif 25 The observed increase in value of band gap with annealing temperature is associated with the conversion of unsaturated bonds between Ni and O into saturated ones, thereby decreasing the density of localized states in the band structure. The value of refractive index n(λ) of the as-grown and annealed NiOx thin films was determined at different wave lengths from the transmittance and reflectance data using the following relation,Reference Mendoza-Galván, Vidales-Hurtado and López-Beltrán 27
 $$n(\lambda ) = \bigg({{1 + R} \over {1 - R}}\bigg) + \sqrt {{{4R} \over {(1 - R)^2 }} - k^2 } \quad,$$
Effect of postdeposition annealing on the optical band gap of NiOx thin film.

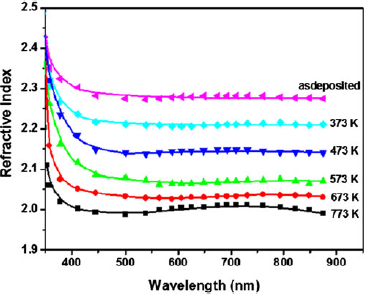
where R is the reflectance and k (k = αλ/4π) is the extinction coefficient. The estimated values of refractive index and extinction coefficient (k) for as-deposited NiOx thin film were about 2.28 and 0.079, respectively, at λ = 600 nm. The value of refractive index is close to the corresponding value reported by other workers for NiO thin films.Reference Puspharajah, Radhakrishna and Aroif 25 , Reference Moss, Burrell and Ellis 28 Variation of refractive index, n(λ), for NiOx thin films annealed at different temperatures is shown in Fig. 7 as a function of the wave length. The refractive index of NiOx thin film over the entire measured wave length is found to decrease with increase in postdeposition annealing temperature (Fig. 7). The decrease in n(λ) with postdeposition annealing is attributed to change in stoichiometry of the NiOx thin film due to variation in the defect profile. The value of n(λ) and extinction coefficient obtained at λ = 600 nm for as-grown and annealed NiOx thin films are listed in Table III. The value of extinction coefficient for all the samples was relatively low (∼10−2) and also found to decrease with increase in annealing temperature (Table III). The extinction coefficient is related to the total optical losses due to absorption and scattering, and the observed lower values of k in the present study indicates a smooth surface and good optical quality of the annealed NiOx thin films.Reference Maniv, Westwood and Colombini 23 , Reference Chen, Lu and Hwang 24 The lowering in k (Table III) is in accordance with the observed decrease in scattering centers and surface roughness of NiOx thin films (Fig. 4) with the annealing temperature. A dispersion in the value of n(λ) was observed with wave length above the interband absorption edge (Fig. 7). The dispersion was found to be strong at lower wave lengths (Fig. 7) and becomes small at higher wave lengths (>500 nm). The value of n(λ) for all thin film samples increases slowly with decrease in the wave length in higher wave length region (500–900 nm). However, significant increase in n(λ) was observed with reducing wave length below 500 nm (Fig. 7). The complex dielectric constant (ε* = ε1−iε2) of the NiOx thin films is related to the refractive index [n(λ)] and extinction coefficient (k) of the respective sample by the relations,Reference Nakahata, Miida, Kamiya, Fortmann and Shimizu 29
 $$\varepsilon _1 = n(\lambda )^2 - k^2 \quad,$$
 $$\varepsilon _2 = 2n(\lambda )k\quad,$$
Variation in the refractive index of NiOx thin films as a function of wave length obtained at different postdeposition annealing temperature.

where ε 1, the real part of the dielectric constant is related to dispersion, while the imaginary part (ε2) provides a measure to the dissipative rate of the wave in the medium. Estimated values of the real and imaginary parts of the dielectric constant (at λ = 600 nm) of as-grown and annealed NiOx thin films are summarized in Table III. The dielectric constant (ε1) of the as-grown NiOx thin film was about 5.19 at optical frequency (λ = 600 nm) and found to decrease from 5.19 to 4.00 with increase in the annealing temperature up to 773 K (Table III). The observed variation in ε1 with the annealing temperature at a fixed wave length may be due to the difference in local symmetry in the NiOx thin films obtained after postdeposition annealing treatment at various temperatures. The value of dielectric loss (ε2) is found to be lower (<0.4) for all as-grown and annealed NiO thin film (Table III).
D. Electrical properties
1. Hall effect measurement
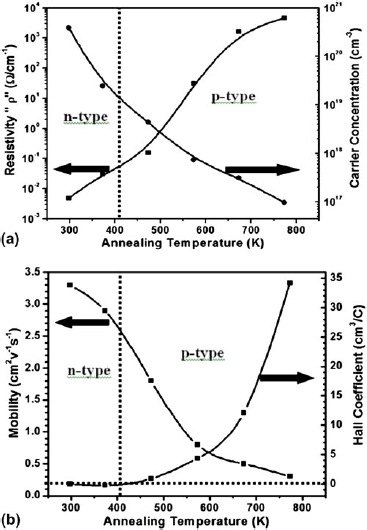
Electrical conductivity, carrier concentration, and mobility of the as-deposited and annealed NiOx thin films are determined using the Hall effect and four probe measurement setup. The uncertainties in the measured values of conductivity and carrier concentration are about ±0.1%, whereas the uncertainty in the measured values of mobility is about ±0.2%. The variation in room temperature values of resistivity and carrier concentration of NiOx thin film is shown in Fig. 8(a) as a function of annealing temperature. The measured value of resistivity for as-deposited NiOx thin film is about 4.8 × 10⁻³ Ω-cm, which is much lower as compared to the corresponding values reported for NiOx thin films.Reference Fasaki, Giannoudakos, Stamataki, Kompitsas, György, Mihailescu, Roubani-Kalantzopoulou, Lagoyannis and Harissopulos 1 , Reference Sato, Minami, Takata and Yamada 21 The obtained lower value of resistivity indicates the growth of metal rich films and may be attributed to the presence of defects related to oxygen vacancies or Ni interstitials. The high electrical conductivity and good optical transmission of as-deposited NiOx thin films are advantageous for transparent electronic device application. The resistivity of NiOx thin film was found to increase from 4.80 × 10⁻³ to 4.61 × 10³ Ω-cm with increase in the postdeposition annealing temperature up to 773 K [Fig. 8(a)]. The obtained value of resistivity, carrier concentration and mobility for as-grown and all annealed thin films are listed in Table IV. The carrier concentration in as-grown NiOx thin film is about 3.90 × 1020 cm−3 and found to decrease (up to 9.73 × 10¹⁶) with increase in annealing temperature (up to 773 K). Although carrier concentration in wide band gap oxide semiconductor is influenced by the presence of native defects, the observed decrease in carrier concentration [Fig. 8(a)] indicates that the native defects are reducing in the deposited NiO thin films with postdeposition annealing. The carrier mobility of as-deposited NiOx thin film is about 3.3 cm−2 V−1 S−1 (Table IV). The value of mobility was also found to decrease with increase in annealing temperature [Fig. 8(b)]. The mobility of charge carriers depends on the grain size of the deposited thin films.Reference Cutler, Leavy and Fitzpatrick 30 Decrease in the value of mobility of the NiOx thin films with increase in annealing temperature [Fig. 8(b)] is attributed to the increase in grain size (Table II). The Hall coefficient of the as-deposited NiOx thin film was −3.38 × 10⁻² cm3/C. The negative sign of the Hall coefficient indicates that the NiOx thin film deposited on a corning glass substrate at room temperature is an n-type semiconductor having electrons as the majority charge carriers. Surprisingly the sign of hall coefficient (RH = 8.89 × 10⁻¹ cm3/C) changes to positive after annealing the NiOx thin films at moderate temperature (≥473 K), indicating a transition in the electronic conduction from n-type to p-type. Therefore, NiOx thin films annealed at temperature ≥473 K exhibits p-type conductivity with holes as the majority charge carrier (Table IV). The electrical results are repeated by depositing the NiOx thin films under similar processing conditions in different batches and subjected to postdeposition annealing treatments at same temperatures. Similar results of transition from n-type semiconducting behavior to p-type conductivity in NiOx thin films are observed in all prepared samples with postdeposition annealing at 473 K. The obtained results in the present study are encouraging, and simple postdeposition annealing of NiOx thin film at a relatively low temperature of 473 K could be used for the realization of p-n homojunction for short wave length transparent electronic devices.
Hall effect measurement of NiOx thin films: (a) resistivity and carrier concentration (b) mobility and hall coefficient variation as a function of annealing temperature.

2. Thermo-emf measurement
Thermo-emf measurement has been used to confirm the transition in electrical property of NiOx thin film from n-type to p-type behavior by determining the nature of majority charge carriers. Thermo-emf produced in the NiOx thin film sample is measured as a function of temperature (ΔT) of its hot end with respect to the cold end (Fig. 1). All the measurements were carried out at room temperature, and the sign of induced emf is recorded. The sign of induced emf indicates the nature of majority charge carriers present in the deposited thin film, that is, the thermally excited majority charge carriers translated within the semiconductor (NiOx) thin film from hot end to the cold end. Thus, the hot end surrounding zone in the thin film becomes charged with minority carriers and the cold end remains neutral.Reference Li, Fang, Zhou, Liu, Zhao and Jiang 31
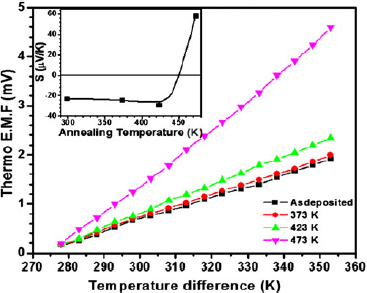
The variation of induced thermo-emf as a function of temperature difference (∆T) between the hot end and cold end for the as-deposited and annealed NiOx thin films is shown in Fig. 9. It may be noted from Fig. 9 that the magnitude of induced thermo-emf in all NiOx thin films increases linearly with increasing temperature difference (∆T) between its hot end and cold end. The observed increase in thermo-emf is attributed to the increase in mobility and concentration of charge carrier with rise in the temperature difference. The room temperature value of TEP of the sample is also obtained from the slope of the plot between thermo-emf versus temperature difference (∆T) and is shown in the inset of Fig. 9 as a function of annealing temperature. It may be seen from the inset of Fig. 9 that the as-deposited NiOx thin film has a negative value of TEP (metal rich films). The values of TEP(S) remain negative for NiOx thin film annealed at lower temperatures (≤423 K). However, the TEP becomes positive for the NiOx films annealed at moderate temperature (≥473 K). The obtained results on thermoelectric studies confirm that the as-grown NiOx thin films and even films annealed at low temperature (<423 K) show n-type conductivity (negative TEP), whereas postdeposition annealing of NiOx thin film at moderate temperature (≥473 K) results in p-type conductivity. The thermoelectric studies of all as-grown and annealed NiOx thin films are in good agreement with the Hall effect studies. The obtained results clearly shows that the conductivity of NiOx thin film could be tuned either to n-type or p-type by a simple postdeposition annealing treatment, and subsequently homojunction could be realized at moderate processing temperature.
Variation of thermo-emf for NiOx thin films as a function of annealing temperature. Inset shows the effect of annealing temperature on the thermoelectric power of NiOx thin films.

The power factor given by S 2/ρ, representing the electrical contribution to the overall thermoelectric performance of the prepared thin film samples, is an essential parameter to be determined. The power factor of as-grown NiOx thin film (n-type) is about 11.1 μW m−1 K−2 and found to decrease from 11.1 to 2.1 μW m−1 K−2 with increase in the postdeposition annealing temperature from as-grown to 473 K (p-type). To the best of our knowledge, there is no report on the TEP studies of sputtered NiO thin films, and the results obtained in the present work for NiOx thin films are found to be comparable to the one obtained for the sputtered Al:ZnO films by other workers.Reference Li, Fang, Zhou, Liu, Zhao and Jiang 31
3. X-ray photoelectron spectroscopy (XPS) study
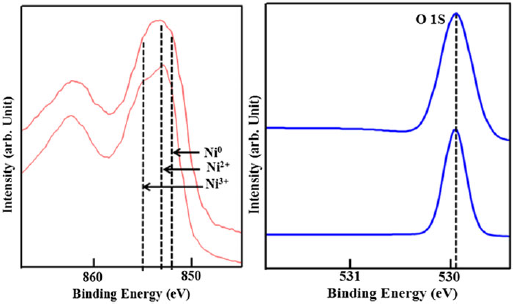
The electrical conductivity of NiO thin films depends on microstructural defects and could be correlated with the valence state of nickel. The XPS spectra of the O1S and Ni 2p3/2 states in the NiO thin films are quite significant to discuss the tenability of conductivity with both n-type and p-type and are shown in Fig. 10.
XPS spectra of (a) NiOx thin film postannealed at 437 K (b) NiOx thin film deposited at room temperature. Inset shows the O1S peak for NiOx thin film postannealed at 437 K and NiOx thin film deposited at room temperature, respectively.

The NiO thin films treated at an annealing temperature of 473 K consists of two XPS peaks in the region 853–857 eV in addition to the electron loss peak with binding energy above 860 eV [Fig. 10(a)]. Conventionally the signal peaks at around 853 and 856 eV correspond to Ni2+ (2p3/2) and Ni3+ (2p3/2) electronic states, where Ni is assumed to take multiple +2 and +3 oxidation states.Reference Ryu, Choi, Lee and Park 17 It may be noted that the above interpretation is limited to p-type NiOx thin film,Reference Ryu, Choi, Lee and Park 17 as also observed in our case for NiO thin film having p-type conductivity. However, an additional peak at around 852 eV appeared in the XPS spectra of NiO thin film deposited at room temperature and was associated with the nickel (Ni0) state.Reference Tyagi, Tomar and Gupta 32 The presence of Ni0 state in the room temperature deposited sample indicates that the growth parameter plays an important role in creating the Ni0 defect in NiO thin films. The presence of Ni0 state was accompanied by a decrease in the intensity of O1S peak observed at around 530 eV, indicating the possibility of oxygen vacancies in room temperature deposited NiO thin film. Therefore, we can summarize that a minimum amount of surface energy (annealing temperature ≥473 K) is desired to deposit good quality NiO thin films, and films deposited at room temperature possess several defects such as electrons trapped at oxygen vacancy sites or delocalized over neighboring Ni2+ ions giving rise to Ni0 state in NiO thin films and are related to the n-type conductivity.Reference Tyagi, Tomar and Gupta 32
4. Conduction mechanism in NiOx films
The p-type conductivity in NiOx thin films is due to the defects related to excess oxygen present at the interstitial sites or Ni vacancies. The presence of interstitial oxygen acts as a trap center for an electron, thus giving rise to p-type conductivity.Reference Chu, Wang, Zhou, Lin, Chernyak, Zhao, Kong, Li, Ren and Liu 13 , Reference Puspharajah, Radhakrishna and Aroif 25 On the other hand, n-type conductivity occurs because of the presence of defects associated with the oxygen vacancies or cationic nickel species at interstitial sites. In the present work, n-type conductivity is observed in the as-grown NiOx thin film, which is expected due to the presence of oxygen vacancies and Ni interstitials. These defects act as a donor level in the forbidden energy gap, and the presence of uncompensated electrons as the majority charge carriers give rise to n-type conductivity. With the postdeposition annealing treatment of the NiOx thin films in the air ambient at 373 K, conductivity of the film is still n-type with lower electrical conductivity. Due to annealing in the air ambient, the thin film absorbs oxygen molecules from the atmosphere and thereby reduces the oxygen vacancies and Ni interstitials. The absorbed oxygen molecules are insufficient to compensate for the defects responsible for the n-type conductivity, and hence the NiOx thin films are still n-type with low concentration of charge carriers after the postdeposition annealing at 373 K. However, optical transparency increases due to decrease in the scattering centers (reduction in Ni interstitials). With further increase in the postdeposition annealing temperature to 473 K, a transition in the semiconducting nature of the NiOx thin films from n-type to p-type is observed. The transition in conductivity is probably due to the excess absorption of oxygen from the atmosphere on the surface of NiO thin film under thermal treatment at moderate temperature,Reference Chowdhuri, Singh, Sreenivas and Gupta 33 which gives rise to the defects related to oxygen interstitial. The presence of oxygen interstitials will lead to p-type conductivity in NiOx thin film annealed at 473 K. As the annealing temperature increases further from 473 to 773 K, the resistivity of the p-type NiO thin film [Fig. 8(a)] increases. The observed increase in resistivity of NiOx thin film at higher annealing temperature (>473 K) may be due to the grain growth. The contribution of oxygen interstitials toward resistivity may not be ruled out. The annealing out of interstitial oxygen defects from NiO thin film at higher annealing temperature follows the reaction NiOx→NiO + O2, and the film becomes stoichiometric. The resistivity of the p-type NiO thin films increases with increasing annealing temperature. Therefore, the NiOx thin film with tunable conductivity from n-type to p-type could be obtained by a simple postdeposition annealing treatment at moderate temperature of about 473 K.
IV. CONCLUSIONS
The (200) preferred oriented NiOx thin film with n-type conductivity has been deposited by RF sputtering on room temperature substrate. The crystallinity and roughness of the as-deposited film improved significantly with postdeposition annealing (373–773 K). All as-grown and annealed NiOx thin films are found to be highly transparent in the visible region. The Hall studies and thermoelectric measurements confirm a transition in electrical conductivity from n-type to p-type at a moderate annealing temperature of 473 K. The resistivity, carrier concentration, and Hall mobility of as-grown NiOx thin film (n-type) is about 4.80 × 10⁻³ Ω-cm, 3.90 × 1020 cm−3, and 3.3 cm2 V−1 s−1, respectively, with high optical transmission of 65%. The p-type NiOx film (annealed at 473 K) exhibits resistivity, carrier concentration, and Hall mobility of about 1.54 × 10⁻¹ Ω-cm, 4.45 × 1018 cm−3, and 1.8 cm2 V−1 s−1, respectively. The results obtained in the present work on tunable electrical conductivity (n-type to p-type) with high optical transmission are very encouraging indicating that NiOx thin film could be realized for short wave length optoelectronic devices besides energy efficient device applications.
ACKNOWLEDGMENTS
The authors are thankful to Department of Science and Technology, Government of India, for the financial support to carry out this research work. One of the authors (MT) is thankful to CSIR and University of Delhi for the research fellowship.