Knowledge of a gene's regulation and extent of expression is central to the understanding of the activity and biological role of its encoded protein. Efficient methods such as Northern blots, RT-PCR, subtractive hybridization, DNA-micro/macro-arrays (Ferguson et al. Reference Ferguson, Boles, Adams and Walt1996; Bowtell, Reference Bowtell1999) and differential display (DD) RT-PCR (Liang & Pardee, Reference Liang and Pardee1992) are used to study gene expression at the RNA-level (transcriptome). One of these technologies, DDRT-PCR is a relatively fast and sensitive technique suitable for small amounts of RNA; therefore, it is widely used to detect differentially expressed genes among different types of samples (Stein & Liang, Reference Stein and Liang2002); however, it should be mentioned that DDRT-PCR does have its limitations, including false-positive results and the inability to confirm differential expression (Sturtevant, Reference Sturtevant2000). Therefore, this technology needs another assay such as real-time PCR to validate the DDRT-PCR result (Kim et al. Reference Kim, Cho, Jung, Kim, Heo, Lee, Lim, Cho, Park and Yoon2009), which is highly sequence-specific, needs little to no post-amplification processing, and is amenable to increasing sample throughput.
The world's 188·3 million water buffalo comprise 12·0% of the world's bovid population; however, more people depend on the water buffalo than on any other domesticated species in the world (FAO, 2011). Buffalo milk contributes around 55% of the annual milk production in India. It is preferred by the Indian consumer for its richness and sensory attributes, and buffaloes are more economically viable than cows in that country. Moreover, water buffalo has leaner meat which contains less fat and cholesterol than beef, while having a comparable taste (Michelizzi et al. Reference Michelizzi, Dodson, Pan, Amaral, Michal, McLean, Womack and Jiang2010). In recent years, genome analysis of water buffalo has been taken up by the scientific community, and considerable information is available on genome resources in terms of cytogenetic characterization (Amaral et al. Reference Amaral, Grant, Riggs, Stafuzza, Filho, Goldammer, Weikard, Brunner, Kochan, Greco, Jeong, Cai, Lin, Prasad, Kumar, Saradhi, Mathew, Kumar, Miziara, Mariani, Caetano, Galvao, Tantia, Vijh, Mishra, Kumar, Pelai, Santana, Fornitano, Jones, Tonhati, Moore, Stothard and Womack2008) and whole genome mapping and next generation sequencing (NCBI Project ID_ 40113; Tantia et al. Reference Tantia, Vijh, Bhasin, Sikka, Vij, Kataria, Mishra, Yadav, Pandey, Sethi, Joshi, Gupta and Pathak2011). However, there is a further need to understand the relationship between genotype and phenotype.
Milk production is a complex phenomenon involving many physiological systems and varied gene expression pattern during different lactation stages. The complexity also lies in the involvement of many proteins, which are still to be evaluated completely for their specific role in milk synthesis. The growth-promoting effects of somatotropin, mediated by IGF-I, have been well documented in a variety of species (Schwarz et al. Reference Schwarz, Schams, Ropket, Kirchgessner, Kogel and Matzke1993; Peterson et al. Reference Peterson, Waldbieser and Bilodeau2005; Villanueva-García et al. Reference Villanueva-García, Olmos-Hernández, Mota-Rojas, González-Lozano, Trujillo-Ortega, Acosta, Reyes, Ramírez and Alonso-Spilsbury2006). It is one of the several exogenous factors which affect milk production, and it has been established that somatotropin administration enhances milk yield in dairy animals (Bauman, Reference Bauman1999). However, most of the studies reported in the literature describing the molecular basis of somatotropin actions are on B. taurus (Knight et al. Reference Knight, Hillerton, Kerr, Teverson, Turvey and Wilde1992; Etherton & Bauman, Reference Etherton and Bauman1998; Peterson et al. Reference Peterson, Waldbieser and Bilodeau2005; Capper et al. Reference Capper, Castaneda-Gutierrez, Cady and Bauman2008; Abdelrahman et al. Reference Abdelrahman, Khalil, EL-Hamamsy and Ezzo2010).
This study was undertaken to understand the molecular basis underlying the increase in milk production and to validate the differentially expressed transcripts in buffalo mammary tissue during a rbST-treatment regime.
Materials and Methods
Experimental material and total-RNA extraction
Mammary gland tissue samples were collected from three Surti buffaloes (mean live weight of 300±18 kg) reared at Livestock Research Station, Anand Agricultural University, Anand, just after the period of peak yield (90 d after calving). Samples were collected before rbST administration (0 h), 48 h post rbST (1000 mg, Posilac-Monsanto, USA) treatment, followed by 48 h post second injection of rbST (500 mg), respectively (Fig. 1). Permission from the committee for the purpose of control and supervision of experiments on animals (CPCSEA) was obtained prior to initiation of the study.
rbST treatment regime and sample collection schedule followed during the experiment. rbST (Posilac) was available as 500 mg/syringe.

Gene screening by differential display
Total RNA was extracted from each sample (100 mg) using Trizol reagent (Sigma) according to the manufacturer's instructions. The quality and quantity was checked on 1% formaldehyde agarose gel electrophoresis and ND1000 spectrophotometer (NanoDrop).
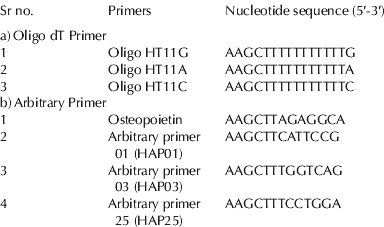
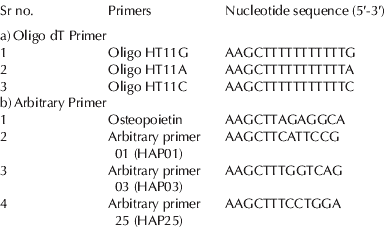
DDRT-PCR was carried out as described by Liang & Pardee (Reference Liang and Pardee1992) with some modifications, using a combination of three single-base anchored antisense primers and four arbitrary sense primers (Table 1). Total RNA was treated with DNAse I enzyme (Fermentas) to remove possible genomic DNA contamination followed by first strand cDNA synthesis using Omniscript Reverse Transcriptase Kit (Qiagen) in a final volume of 20 μl having 1X RT buffer, 50 μm of each dNTP, 10U RNase inhibitor Ribolock™ (Fermentas), 4 μm-oligo(dT) anchored primers and 4 U Reverse Transcriptase enzyme. The reaction mixture was incubated at 37°C for 1 h followed by denaturation at 93°C for 5 min. Further, PCR was carried out in a 20-μl final volume, having 2 μl first strand cDNA, 4 μm-oligo(dT) anchored primers, 4 μm arbitrary primers (Table 1), 1X Taq DNA polymerase buffer, 400 μm of each dNTP and 2 U Taq DNA polymerase. Thermal cycling condition comprised 40 cycles of denaturation at 95°C for 30 s, primer annealing at 40°C for 2 min and extension at 72°C for 60 s with final extension at 72°C for 5 min. Amplified cDNA fragments were resolved on a 6% denaturing polyacrylamide/urea gel, and visualized by conventional silver staining. The fragments of interest were excised from the gel, extracted (‘crush and soak’ method), and re-amplified for further analysis.
Anchored Oligo(dT) and arbitrary primers used to generate first strand cDNA and PCR amplifications
Cloning and sequencing of PCR products
Differentially expressed purified fragments were cloned into pTZ57R vector (InsT/Aclone™, Fermentas). The vector-containing inserts were propagated in Escherichia coli DH5-α following manufacturer's instructions, and colonies were selected by blue white screening. The recombinant plasmids, carrying the desired insert, were isolated from the representative clone using QIAprep® Spin Miniprep kit (QIAGEN), and subjected to BigDye® Terminator v3.1 Cycle Sequencing reaction (Applied Biosystems). These purified products were resolved on automated ABI PRISM® 310 Genetic Analyzer (Applied Biosystems), and the sequences were analysed using Sequencing Analysis Software v5.2 (Applied Biosystems). The similarity was looked up in the non-redundant database of GenBank with BLAST algorithms (http://www.ncbi.nlm.nih.gov/BLAST/).
Confirmation of differentially expressed genes by Quantitative real-time PCR
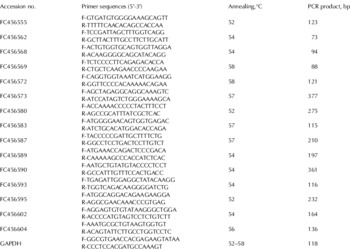
The mRNA expression levels of differentially expressed target genes were quantified by quantitative real-time PCR analysis on ABI PRISM 7500 real-time PCR system (Applied Biosystems). Total RNA extraction and cDNA preparation of respective samples was performed as mentioned earlier with oligo(dT), not anchored primers. Gene specific primers were designed from the sequenced ESTs using Primer 3 software (http://frodo.wi.mit.edu/primer3/) (Table 2). All PCR reactions were performed in triplicate with glyceraldehyde 3-phosphate dehydrogenase (GAPDH) as an internal control. Amplification was carried out in a 20-μl final reaction volume containing 1X Power SYBR Green PCR master mix, 10 pmol of each EST specific forward and reverse primer, 2 μl cDNA template and remaining nuclease-free water. Thermal cycling condition comprised initial denaturation at 95°C for 5 min followed by 45 cycles of denaturation at 95°C for 30 s, primer annealing at 52–58°C for 40 s, extension at 72°C for 40 s, and the final extension at 72°C for 5 min. At the end of each run, a melting-curve analysis (95°C for 15 s, 60°C for 1 min, and an increment of 0·5 degrees per 5 s until 95°C) was performed to assess the specificity of the amplification.
Primers, nucleotide sequence, annealing temperature and amplicon length for the analysed ESTs

Relative quantification
Quantified data were analysed using Sequence Detection System (SDS) software v1.3.1 (Applied Biosystems) by comparative CT method. The CT for the target gene and the endogenous control were determined for respective samples. The expression of the selected gene was calibrated by that of the endogenous control, GAPDH, at each time and converted to the relative expression (fold of expression), as follows:

where
ΔΔCT=Average ΔCT of target sample − Average ΔCT of calibrator sample (0 h)
ΔCT=Average CT of target gene − Average CT of endogenous control (GAPDH)
Results
Gene screening by differential display
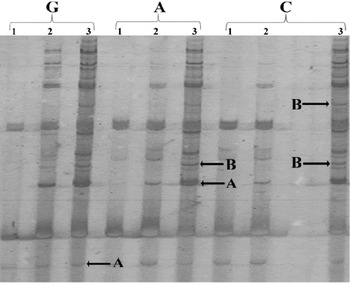
The present study was undertaken with the objective to identify the candidate genes and/or genes with modified expression in the process of the increase in milk synthesis by DDRT-PCR, in the mammary tissue of Indian buffalo collected following rbST treatment. Amongst 50 different DDRT-PCR bands, 32 bands (64%) were differentially displayed, and 18 (36%) were up-regulated (Fig. 2). An average of 12–13 bands were generated by each anchored and arbitrary primer pair with a minimum of seven (HAP01) to a maximum of 23 (Osteopoietin) bands. Size distribution of cDNA bands revealed that the majority of fragments were in the 200–1000 nt range (∼60%), while the remainder were in the 100–200 nt range.
A representative figure showing differentially displayed bands of mRNA transcripts from lactating buffalo udder tissue collected at 0 h (1), 48 h (2) and 96 h (3) i.e. before and after rbST treatment. Reverse transcription (RT) was done using anchored primers (with G, A, and C) and PCR was performed using respective anchored and arbitrary primers pair. Products were resolved on a 6% denaturing (urea) polyacrylamide gel, and visualized by conventional silver staining. The arrows indicate upregulated (A) and differentially displayed (B) cDNA bands.

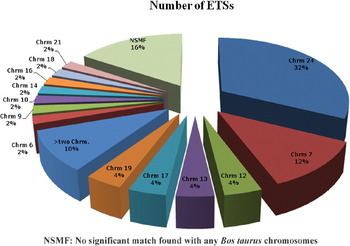
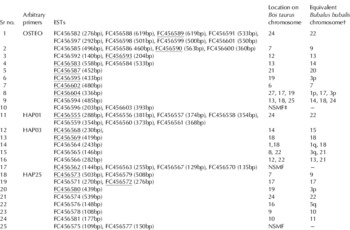
The nucleotide sequence (108–619 bp) data reported in this paper (Table 3) were submitted to GenBank (Accession numbers FC456555 to FC456604). These ESTs were also mapped against B. taurus chromosomes, where 16 ESTs (32%) were located on chromosome 24; 6 ESTs (12%) on chromosome 7, 2 ESTs (4%) each on chromosomes 12, 13, 17 and 19, whereas 5 ESTs (10%) were mapped on more than two chromosomes. Further, seven ESTs (14%) were located on seven different chromosomes (6, 9, 10, 14, 16, 18 and 21). The remaining 8 ESTs (16%) could not be mapped to any B. taurus chromosome (Table 3; Fig. 3).
(Colour online) Differentially displayed ESTs location on Bos taurus chromosomes.

Summary of Differentially Displayed ESTs. Note: FC456… ESTs were used for Real time PCR

† Equivalent Bubalus bubalis chromosomes (Tantia et al. Reference Tantia, Vijh, Bhasin, Sikka, Vij, Kataria, Mishra, Yadav, Pandey, Sethi, Joshi, Gupta and Pathak2011)
‡ NSMF: No significant match found
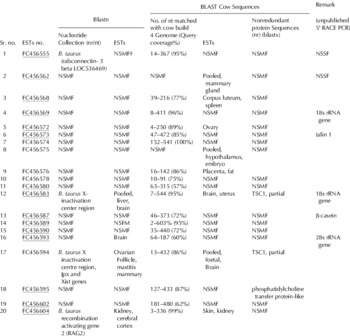
A genome database search showed that all 7 ESTs amplified using HAP01 arbitrary primers showed partial homology with Rabconnectin-3 β protein, where as 9 and 11 ESTs, amplified using HAP03 and HAP25 arbitrary primers, respectively, did not have any similarity with any functional or hypothetical protein except ESTs, FC456562; FC456568; FC456575 and FC456581, which had partially similar sequences in Blastn ESTs and B. taurus ESTs division. Out of 23 cDNA, amplified using Osteopoietin arbitrary primer, nine (39·13%) showed homology with B. taurus Katanin p60 subunit A-like 2 protein, located on the intronic region of chromosome 24 and 2 ESTs (8·7%) showed partial similarity with TSC1 9 (Table 4). Moreover, out of 50 ESTs, 36 (72%) and 34 (68%) ESTs did not have any significant sequence similarity in Blastn ESTs and B. taurus ESTs division, respectively. Moreover, few ESTs also showed partial homology with 5′ and 3′ end of different types of functional and hypothetical proteins in B. taurus build 5 genome database.
Summary of Differentially Displayed ESTs (Accession No. refers to the GenBank accession number of the product sequence). Note: FC456… have been used for Real time PCR study

† NSFM: no significant match found
Validation of differential expression by Quantitative RT-PCR
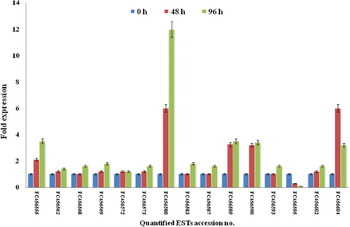
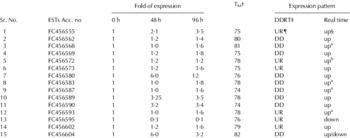
In the present study, we analysed 15 differentially displayed ESTs with quantitative real time PCR, which were shortlisted on the basis of length, newfangled ESTs (no match in any database) and showing match in a few but not in all database (Table 4). Amongst 15 ESTs, six (40%) were up-regulated while nine (60%) were differentially expressed (Table 5). Of 15 ESTs, 12 (80%) were up-regulated up to 3·25- and 3·5-fold at 48 and 96 h after treatment respectively (Fig. 4), whereas FC456580 was increased by 6-fold at 48 h and 12-fold at 96 h against calibrator sample (0 h). On the contrary, one EST (FC456604) showed a 6-fold transcript increment at 48 h after treatment but 3·2-fold up-regulation at 96 h. Interestingly, one EST (FC456595), which was found to be up-regulated in DDRT-PCR, showed marginal down-regulation at 48 h and 96 h after rbST treatment (0·3- and 0·1-fold respectively).
(Colour online) Quantitative real time-PCR assay of fifteen differentially displayed ESTs, expressed as a fold expression relative to 0-h samples.

Fold of changes and expression patterns of differentially expressed genes

† TM: Melting temperature
‡ DD, Differentially Displayed
¶ UR- Up regulated
§ up: up regulated; down: down regulated. a constant at 0 and 48 h; b constant at 48 and 96 hours
Discussion
Many approaches have been used to compare gene expression as affected by different physiological states. This study describes the effect of rbST on gene expression in mammary gland of lactating buffalo through DDRT-PCR technique, which is a useful method to compare gene expression patterns in different types of tissues or under different biological conditions (Liang, Reference Liang2006). It is often useful in identification of non abundant, rare, or novel transcripts that can be compared with DNA sequences available in current databases to identify genes, including genes in conventional and non-conventional biological models (Martinez-Montemayor et al. Reference Martínez-Montemayor, Hill, Raney, Rilington, Tempelman, Link, Wilkinson, Ramos and Ernst2008). Combined with RNA expression verification, Differential Display is a powerful method for generating high confidence hits in the screening of hundreds of potential differentially expressed transcripts (Schwerin et al. Reference Schwerin, Czernek-Schafer, Goldammer and Kata2003; Chen et al. Reference Chen, Liang, Tian, Li, Xiuqing, Yu, Yang, Wang and Li2011).
The biological effects of rbST have been extensively evaluated, and the ability of this hormone to enhance productive efficiency while maintaining the health and well-being of dairy animals is well reported (Capper et al. Reference Capper, Castaneda-Gutierrez, Cady and Bauman2008). The availability of recombinant somatotropins has resulted in an exponential increase in investigations into its role in growth and lactation biology, and prompted their potential evaluation in commercial use. Collectively, many studies have established that administration of rbST to lactating animals (cow, buffalo, sheep) increases milk yield, and that treatment of growing pigs with pST markedly stimulates muscle growth and reduces fat deposition (Schwarz et al. Reference Schwarz, Schams, Ropket, Kirchgessner, Kogel and Matzke1993; Etherton & Bauman Reference Etherton and Bauman1998; Davis et al. Reference Davis, Sahlu, Puchala, Herselman, Fernandez, McCann and Coleman1999; Moallem et al. Reference Moallem, Folman and Sklan2000; Patel et al. Reference Patel, Koringa, Nandasna, Ramani, Barvalia and Panchal2007; Abdelrahman et al. Reference Abdelrahman, Khalil, EL-Hamamsy and Ezzo2010; Prasad & Singh, Reference Prasad and Singh2010).
Baldwin (Reference Baldwin1990) demonstrated that bST-treated cows had increased levels of RNA in the mammary gland, and therefore increased protein synthesis capacity with increased activities of several enzymes. There are two reports on lactating cows and goats, where similar trends in enzyme activity have been observed after somatotropin treatment, but effects were not significant possibly owing to smaller increase in the milk yield response (Knight et al. Reference Knight, Fowler and Wilde1990; Knight et al. Reference Knight, Hillerton, Kerr, Teverson, Turvey and Wilde1992). Clear evidence of a somatotropin effect was demonstrated by Barber et al. (Reference Barber, Clegg, Finley, Vernon and Flint1992) who treated rats with rST after blocking prolactin secretion with bromociptine and neutralizing endogenous somatotropin with rat antiGH, and observed cessation of milk yield along with decreases in the mRNA concentrations. Gene expression pattern in bovine mammary gland was successfully demonstrated by DDRT-PCR and real time PCR by Schwerin et al. (Reference Schwerin, Czernek-Schafer, Goldammer and Kata2003). They compared bovine mammary gland mRNA patterns in clinical mastitis through DDRT-PCR in infected and non-infected quarters of a lactating cow to identify mastitis-associated amplified sequences, and confirmed 19 differentially expressed ESTs with quantitative real time PCR. Guidi et al. (Reference Guidi, Armani, Castigliego, Pancrazi, Grifoni, Rosati, Mazzi, Borghese and Gianfaldoni2009) reported the effect of rbST in mammary gland, and observed significant variations on day 14, where the expression of the 5′UTR IGF-I variant was found to be significantly higher in the treated animals. They also proposed that rbST seems to be able to inhibit the action of IGF-1, the main biological mediator of somatotropin.
An effect of rbST on the yield of milk and milk constituents has been reported in buffaloes. Ludri et al. (Reference Ludri, Upadhyay and Singh1989) and Polidori et al. (Reference Polidori, Sgifo Rossi, Senatore, Savoini and Dell'Orto1997) have observed that the administration of rbST to Indian and Italian buffaloes increased milk production without marked changes in milk fat content. Helal & Lasheen (Reference Helal and Lasheen2008) reported significant changes in milk yield and 4% fat-corrected milk yield (P<0·01) in the rbST-treated group. They further observed that milk fat, total solids (TS), total protein (TP) and ash contents did not differ significantly (P>0·05). However, milk lactose content was significantly (P<0·01) increased by treatments. Similarly, Prasad & Singh (Reference Prasad and Singh2010) observed a milk yield increase of 29·9% after rbST treatment in lactating buffaloes (P<0·01) with a significant effect on milk protein (P<0·01) and lactose (P<0·01) without affecting plasma glucose and non-esterified fatty acids (NEFA) milk NEFA, citric acid and fat content.
A genome database search showed that amplified ESTs from four arbitrary primers did not have any similarity with previously described genes except a partial match with Rabconectin-3, TSC1 and Katanin genes on genomic location. Also few ESTs had homology with ESTs identified in different physiological stages of a lactating buffalo (unpublished observations). Moreover, we could not find any relationship of somatotropin action with these identified genes in the milk yield increment. The Rabconnectin-3 family of small G proteins appear to be key regulators of intracellular vesicle transport (Nagano et al. Reference Nagano, Kawabe, Nakanishi, Shinohara, Deguchi-Tawarada, Takeuchi, Sasaki and Takai2002) and are involved in regulated exocytosis (Sakane et al. Reference Sakane, Manabe, Ishizaki, Tanaka-Okamoto, Kiyokage, Toida, Yoshida, Miyoshi, Kamiya, Takai and Sasaki2006). The tuberous sclerosis (TSC) genes (TSC1 and TSC2) encode the protein products hamartin and tuberin, respectively, and also act as tumour suppressor genes (Jiang et al. Reference Jiang, Sampson, Martin and Lee-Jones2005). The growth-promoting effect of somatotropin is mediated by IGF-I, which leads to increased phosphorylation of TSC2 after Akt activation (Burgos & Cant, Reference Burgos and Cant2010). Whereas Katanin is a heterodimer consisting of a 60-kDa microtubule-stimulated ATPase that requires ATP hydrolysis to disassemble microtubules, and an 80-kDa subunit that targets the complex to centrosomes, and regulates the microtubule severing activity of the p60 subunit (Quarmby, Reference Quarmby2000; Nakatani et al. Reference Nakatani, Hattori, Ohnishi, Dean, Iwayama, Matsumoto, Kato, Osumi, Higuchi, Niwa and Yoshikawa2006).
To date, the water buffalo gene and genomic resources are meagre, and have been compared to other species like cow and sheep. All 50 ESTs have been mapped with B. taurus chromosomes 6, 7, 9, 10, 12, 13, 14, 16, 17, 18, 19, 21 and 24; equivalent to B. bubalis chromosomes 7, 9, 10, 11, 13, 14, 15, 5q, 18, 3p, 20 and 22, respectively (Amaral et al. Reference Amaral, Grant, Riggs, Stafuzza, Filho, Goldammer, Weikard, Brunner, Kochan, Greco, Jeong, Cai, Lin, Prasad, Kumar, Saradhi, Mathew, Kumar, Miziara, Mariani, Caetano, Galvao, Tantia, Vijh, Mishra, Kumar, Pelai, Santana, Fornitano, Jones, Tonhati, Moore, Stothard and Womack2008; Tantia et al. Reference Tantia, Vijh, Bhasin, Sikka, Vij, Kataria, Mishra, Yadav, Pandey, Sethi, Joshi, Gupta and Pathak2011). Moreover, 7 ESTs were selected for 5′RACE PCR, which showed more than 85% homology with 18sRNA (2 ESTs), 28sRNA, talin 1 and β-casein gene (one each), where as two did not have any match in Genbank database (Accession number GH158820 to GH158826; unpublished observations, AK Tripathi 2009). Thus, owing to unavailability of sequence information with reference to buffalo lactation physiology, we could not assign any specific function to these identified ESTs.
Conclusions
In conclusion, the results from this study provide more than 30 novel ESTs, identified through DDRT PCR, which could be involved in lactation pathways in buffaloes. Further, validation of 15 ESTs through real time PCR indicated an absence of false positive amplification, along with 3·25–12-fold increments at 48 h and 96 h after rbST treatment in buffalo mammary tissues. Since the differential expressions of these ESTs are in response to rbST treatment, it can be well inferred that these ESTs have a role in enhancing milk synthesis. However, further investigations are required to identify these novel ESTs, sequencing of their full length cDNA, expression of cDNA sequence in an appropriate host and interaction among these differentially expressed transcripts.
This work was financially supported by Gujarat State Biotechnology Mission (GSBTM), Gujarat, India. We are thankful to Dr Gregg Bogosian, Director, Monsanto's Posilac and Dairy R&D for providing recombinant bovine somatotropin (Posilac) for the study. The authors are also thank Dr A E Nivsarkar, Ex. Director, National Bureau of Animal Genetic Resources (NBAGR) for improving this manuscript.