

These four questions give rise to four sciences which the human intellect must use as just so many means and tools, if it wants to consciously recognize the truth as true, to present it as true, and to discern it from error and semblance.
(Lambert Reference Lambert1764, I, X; italics in the original)Footnote 1Introduction: Lambert's Tool Kit and Mode of Proceeding
In 1764 Johann Heinrich Lambert (1728–1777) published what is considered his main philosophical work, Neues Organon (Lambert Reference Lambert1764), followed in Reference Lambert1765 by the Anlage zur Architectonic which was not published until 1771 (Lambert Reference Lambert1771a). In these works, comprising nearly two-thousand pages, Lambert lays out his scientific views, discusses his way of tackling scientific problems, presents heuristic methods and little tricks to overcome difficulties, etc. Both books are the outcome of many years of scientific practice and extensive reading. They contain the blueprint of Lambert's manner of conducting scientific work, both experimental and theoretical.Footnote 2
For Lambert, the word Organon was to be quite literally understood in its original meaning, a tool kit (Werkzeug), a collection of tools to be employed, combined, and assembled according to the problem at hand. As Lambert notes in some fragments of the logical and philosophical Nachlass:
The routine (procedure) can be very different. Wolff liked to abstract. Baumgarten tried to apply abstract concepts to genera, to find new genera. Meier used his topic. Euler calculates. Dan. Bernoulli likes to use pictures as an aid. Muschenbroeck experiments without a theory. Others like to assume hypotheses. Everyone has his favourite guideline. (Lambert Reference Lambert and Bernoulli1782 and 1787, I, 406–7)Footnote 3
All these subroutines, partly taken from other scientists, partly self-developed, are discussed in Lambert's Neues Organon, the Architectonic, or one of his other writings. In particular, Lambert had written an Organon for “exact experimental physics,” an Organon quantorum which was included as the fourth part of the Anlage zur Architectonic “Die Größe” (Arch. §679– §923).Footnote 4 In the last section of the Neues Organon, called Dianoiologie or the Doctrine of the Laws of Thought, Lambert gives a detailed account of his modus procedendi in things scientific (Lambert Reference Lambert1764, I, 386–450). In his obituary, a more succinct overview of the same procedure is described:
He wrote down everything that came to his mind; he ordered these propositions after the common rules of logic; then he tried to find and fill up the gaps; then he consulted other books, especially dictionaries, to find the complete extension of a concept; and finally, he went through the whole thing with a logical tableFootnote 5 that he had published in the Nova Acta Eruditorum.Footnote 6
Once this last stage was reached, Lambert wrote things out in publishable form, partly inverting the order of invention into an order of exposition, viz. starting from a system of concepts, fine-tuning the concepts, and then linking them together as a series of experiments and a coherent body of propositions. This near algorithmic scheme of invention and exposition was modulated according to the kind of investigation at hand.
However, Lambert was also aware that human knowledge is inherently incomplete and that many spheres of knowledge do not seem to be part of the same whole ([Lichtenberg] 1778, 277). Therefore Lambert conceived of an open-ended rather than a closed systematic approach, listing a variety of strategies and many exceptions to the rules. In particular in the near aphoristic fragments that were meant to supplement the Neues Organon but were only published after Lambert's death by Johann III Bernoulli, this aspect comes clearly to the fore. These fragments address parts of the “art of finding” (Erfindungskunst), mapping the ephemeral geography of thinking, searching, and finding. This is voiced in the conclusion of a long fragment on how to analytically transform experiments into a system: “the analytical method resembles a road that leads up to a hill, on top of which one can oversee the surroundings” (Lambert Reference Lambert and Bernoulli1782 and 1787, II, 72).Footnote 7 This road includes tracking symptoms (Kennzeichen), following traces (Spuren), taking side-roads (Abwege), making detours (Umwege), and having lucky occasions (glückliche Zufälle) and lucky ideas (glückliche Einfälle), finally, finding the right trick (Kunstgriff) to handle things.Footnote 8
Nearly all items in Lambert's scientific output, especially those that are part of an ongoing series of investigations over the years, testify to his systematic spirit and his versatility in changing and adapting procedures to the circumstances. In the same way that the Neues Organon and the Anlage zur Architectonic refer to exemplary paragraphs from Lambert's earliest extensive investigations in experimental physics (the Photometria from 1760 and the Tentamen de vi caloris from Reference Lambert1755), his later investigations refer back to the relevant paragraphs in the Organon and Architectonic. This shows how practice informs Lambert's theoretical work and vice versa, how his practice is permeated by theoretical considerations. Nearly every series of continued investigations would thus serve to illustrate and explain Lambert's scientific approach, be it ballistics, the theory of comets, number theory, etc. However, we have opted to discuss his hygrometric research because of the wealth of documents available for this case.
In 1769 Lambert devoted a long essay to the measurement of humidity and the construction, fine-tuning, and “synchronization” of a measuring instrument, the hygrometer (Lambert Reference Lambert1769). In 1772, a second essay appeared that reported, processed, and analyzed the results obtained by various persons with this experimental set-up (Lambert Reference Lambert1772). Complementing these richly detailed essays from Lambert's hand, there is an extant correspondence between Lambert, the instrument-maker Georg Friedrich Brander (1713–1783), and co-workers who collected the data from the hygrometers. As such, this case provides various insights into the process of setting up experiments, the material construction of the instruments, communicating the results among the experimentators, as well as organizing the gathering of scientific data. Tying these processes of doing science with Lambert's theoretical ideas, as expounded in the Organon and Architectonic will throw new light on some of the philosophical and/or mathematical techniques and ideas Lambert is famous for (e.g. semiotics, statistics, visualizations) and show how they are intimately embedded in a very general theory of (scientific) knowledge. This will support the argument that Lambert's unique experimental work is an important and particularly enlightening link between the later eighteenth century – characterized by Newtonian experimentalism on the one hand and a (mostly independent) exploration of mathematical techniques on the other hand – and the nineteenth century, which is marked by the combination of a strict mathematical approach with organized laboratory experiments.
The context of Lambert's work on hygrometry
Looking at the publications on the measurement of air humidity during the eighteenth century, it is immediately apparent that between the years 1760 and 1790 the topic was popular. On both sides of the Canal many essays and books appeared discussing the construction of a hygrometer and the design of a scale for measuring humidity.Footnote 9 The study of humidity was part of a more general interest in all things pertaining to the weather. In the eighteenth century, meteorology, the study of the weather, held an appeal for many researchers, because it had connections with many other sciences (physics, chemistry, electricity, etc.), and seemed particularly amenable to quantificative observations and measurements, preparing the ground for laws that could be mathematically expressed (see Feldman Reference Feldman, Frangsmyr, Heilbron and Rider1990, 143–144, and more recently Golinski Reference Golinski2007).Footnote 10 In particular, metereologists were among the first to design precise instruments for experimental physics (Feldman Reference Feldman, Frangsmyr, Heilbron and Rider1990, 145). Lambert's work on hygrometry is deeply embedded in this context and subscribes to many characteristics of a late eighteenth-century physics which Feldman has baptized “exact experimental physics.”Footnote 11 Lambert's main source and influence in hygrometry was Petrus Musschenbroek, under whom he had studied in Leiden (1757–58). Thanks to Lambert's and de Saussure's work in the 1770s and 1780s, Dalton's law of partial pressures would eventually be formulated for the special case of aqueous vapor in 1801.
Coming to questions
Asking the right questions when setting up and performing experiments is not a trivial task. Lambert had written in the preface to his Neues Organon (Lambert Reference Lambert1764, I, VII) that a theory of questions is as important as a theory of propositions (see also Dian. §423–550). Upon his becoming a member of the Berlin Academy, Class of Experimental Physics, Lambert described the problem in the following words:
Purposeful experiments in chosen circumstances are problems that we propose to Nature. . . . She responds with precision, not to what we think we ask, but to what we actually ask. To avoid being deluded and waiting for nothing, one has to rigorously make sure that the conditions imposed by the problem are known, so that one is able to choose the circumstances and to adapt the experiment to these conditions. (Lambert Reference Lambert1765/1767a, 508)Footnote 12
The question of what constitutes a “good” experimental question is for Lambert intimately related to mechanism and mathematics.
Experimental physics is absolutely necessary in cases where there is no way to see the mechanism by which Nature operates . . . one can add calculation, one can apply the principles of mechanics where this mechanism is pronounced enough to be seen or simple enough to be conceived of. (Ibid., 509)Footnote 13
The translation of the observed “mechanism” into mathematical language ties experimental physics to mathematics, each indispensible for the development of the other and each functioning as mechanisms to check the other:
Calculation brings in precision and generality. Experiment (Experience) verifies both and discovers each circumstance omitted or falsely admitted. Neglecting calculation and the theory one performs arbitrary and aimless experiments. Neglecting experiments one is in danger of running into chimeras and of producing calculations that apply in every other world but this one. (Ibid.)Footnote 14
Lambert's use of the word “mechanism” might seem curious, but it should be interpreted neither as an avowal of a pure mechanical world view, nor as a shallow metaphor. It is rooted in the observation that all machines have periodic behavior (Arch. §332). On other occasions, Lambert also uses the word “rules” (Regeln) to indicate this same relationship between observable behavior and underlying regularities.
To find the requirements under which something (e.g. a machine) has a certain effect (e.g. behavior) is to Lambert an instance of a very general logico-philosophical problem, viz. that of reversing propositions, i.e. turning a proposition of the form Subject/Predicate into a proposition of the form Predicate/Subject (Lambert Reference Lambert and Bernoulli1782 and 1787, I, 499). Following Wolff, Lambert saw in revertible propositions (Umkehrsätze) the most powerful and richest propositions of science because it makes the concept (the subject of the proposition) completely clear and understood (Dian. § 676). Therefore, “all coordinate scientific ideas are connected through reverse propositions” (Lambert Reference Lambert and Bernoulli1782 and 1787, I, 496).Footnote 15 Its analytical form could be seen as Lambert's basic scientific research principle (Sem. § 94): “If a thing is given that is made after certain rules, to find the rules after which it was made or could have been made.”Footnote 16
It should, however, be remarked that in Lambert's view phenomena that obey “rules” or “mechanisms” are only one class of natural phenomena. Another class contains those that are generated by laws (gesetzmässig), yet another class are those that are or appear to be random (zufällig). As this last category makes very clear, Lambert's classes are phenomenological categories, indicating the knowledge of the investigating subject about the object of investigation. Lambert largely expounds upon these categories in his Architectonic (Arch. §307–350). They are mainly heuristic categories, i.e., given a set of (quantitative) data obtained during a stretch of time, how can one find the rule or law that governs the order or non-order of this data set? If the set appears random, it can be a series of random events, or a series generated by a law. If, however, the set is ordered, i.e., there are similarities or repetitions between adjacent data, the set can be generated by a rule, by a mechanism. Lambert calls this last class “local order” and considers it to be the most tractable set of problems in Nature, as expressed in the quote above.Footnote 17
A sure sign of such local order is periodicity (Arch. §327). Hence, to start an investigation into the laws of Nature, to start a new discipline, one can focus on periodic phenomena first, try to derive their rules, and then gradually expand the theory. This is exactly Lambert's purpose in meteorology:
It seems to me that if one wants to make meteorology more scientific than it currently is, one should imitate the astronomers who began with establishing general laws and middle movements without bothering too much with details first . . . . Should one not do the same in meteorology? It is a sure fact that meteorology has general laws and that it contains a great number of periodic phenomena. But we can but scarcely guess these latter. Only few observations have been made so far, and between these one cannot find connections. (Lambert Reference Lambert1771b, 60)Footnote 18
To obtain more and better data Lambert proposed setting up a network of weather stations around the world, in which the various weather configurations (rain, clouds, dry . . .) would be recorded with the use of a simple and small set of iconic signs, the ones still used nowadays in the weather report.Footnote 19 Furthermore, he promised to devote himself to the improvement of the measuring instruments and to the developement of accurate concepts and a theory for the advancement of meteorology. This is delivered in the 1769 and 1771 texts on hygrometry.
An epistemological observation on Lambert's concept of periodicity is due. Lambert's periodicity seems to be an intermediate concept, turning phenomena and/or patterns present in the data slowly into laws, turning the similarities into quantitative series, in which structures and dependencies can be tracked down (as his three categories of order indicate rather explicitly).Footnote 20 Similarly, Lambert's transformation of a classical device of structuring scientific knowledge, the logical proposition and its reversal, into an analytical principle that bears resemblance to the modern black-box analysis, also seem to be a symptom of a much more general shift in knowledge structuration. This matches up with Foucault's analysis in Les mots et les choses, where, for the period around 1800, a discontinuity in the representation of knowledge is described, going from classification and an ordering device based on similarities towards structures and derivational order (Foucault Reference Foucault1966).
What is humidity?
The main question to be solved in Lambert's introduction to the 1769 paper is to determine what humidity really is, what other phenomena act upon on it, and how these can be put into a quantitative form. As put forward in the modus procedendi, Lambert starts by considering the word “humidity” in all its significations and figures of speech, as they can be found in a dictionary “to find the complete extension of a concept.” This way, Lambert connects to the common understanding of a phenomenon, as it appears in everyday conversation, and can, starting from there, gradually specify the phenomenon as appearing in his scientific research.
It is not necessary to explain what humidity is. One has only to pass through the fog to perceive it; because this is a kind of humidity immediately accessible to eyeview and sense of touch. One can also see it in the exhalations of boiling fluids. It also becomes visible in Winter, when it attaches itself to windows or covers objects exposed to vaporous air, or, finally, when it appears as dew that covers the hairy surface of plants with an infinity of small drops. If in Winter one transports the cold into heated rooms it attaches itself to glass or metallic bodies. This is known to everybody. (Lambert Reference Lambert1769, 69)Footnote 21
The phenomena where humidity can be seen or felt are especially emphasized, as a way of linking up non-scientific, everyday experience with controlled scientific experimenting.
Lambert conceived of language as an “archive of concepts” (Behältnis der Begriffe), ready to be used and developed. The goal of semiotics is to “reduce the theory of things to the theory of signs” (Sem. §23–24), or put differently, to adjust and control the mapping between the elements of the real world (Realwelt) and the intellectual world (Intellektualwelt). Because everyday language has much that is “hypothetical” or “arbitrary” (hypothetisch, willkührlich) – one could say in modern terms, language has much redundancy (on the semantic level) – one needs procedures to adjust this mapping when words are needed for specific, scientific discourses (Sem. §329–351).Footnote 22 For Lambert, a scientific discourse is more amenable to quantification than everyday speech and specifically should be “designed” to avoid endless discussion and polemic (Wortstreit, logomachia). Therefore, scientific concepts (Begriffe) should be developed so that they are clear, understandable, but also fit for further refinement, either narrowing down its extension or broadening it (den Begriffsumfang bestimmen). This way, Lambert hoped to avoid the endless definitions and repudiations of the Scholastics or of the Wolffian Schulphilosophie that hindered the progress of science. Lambert discerned two modes in which the process of determining the extension of a concept could proceed: oscillatory or asymptotic (Arch. §561). The first mode is a series of consecutive definitions where the next definition contradicts the previous one, the second mode of defining is the one Lambert wanted to establish in science, the determination of a concept with ever increasing precision and consensus.Footnote 23 Such determination and/or adjustment is possible through the use of “coefficients,” i.e., the adjectives and adverbs that determine the substantives and verbs (that act like variables) (Arch. §437, cfr. Sem. § 176, 223).
These [concepts and qualities] are not simply put or thrown together, but are multiplied [with the coefficients, adjectives and adverbs], because the abstract concept acquires new qualities.Footnote 24
Proceeding this way, from everyday words to gradually determined words, one can avoid inventing artificial words.Footnote 25 Using the resources present in everyday language, understanding between scientists and non-scientists (or for that reason, between different branches of science) is guaranteed, and, perfectibility of the concept is inherent in the definition of the concept, it can be adapted to the outcomes of the experiments and theory, the use of common everyday devices present in language (determination through adjectives and adverbs) guarantees that.
This is exactly what Lambert does after introducing the concept “humidity” with the dictionary examples, it is determined further for scientific use:
The degree of humidity of air is the mass or better even the weight of all aqueous particles that float in a certain volume (e.g. in a cubic foot of air). This is what the language of hygrometers should be reduced to. (Lambert Reference Lambert1769, 69; emphasis added)Footnote 26
Everything ambiguous that was possibly present in the word “humidity” is thus equated with a definition that allows quantitative determination. This reduces the linguistic application range of humidity, but makes it amenable to the scientific language which is mathematics. Mathematics, or to be more exact: algebra, is for Lambert the characteristic language per se that can be best perfected so as to induce a proper mapping of the real into the intellectual world (Sem. §35).
Again, Lambert tries to get at the exact extension of the concept humidity by “reverse engineering,” viz. making the concept not a subject but a predicate, determining the requirements for humidity to happen (Dian. § 676).
Let us try to track [humidity] in its major appearances that can be evaluated and measured. Let us begin to see it at the time of its birth. (Lambert Reference Lambert1769, 69)Footnote 27
This leads to the investigation of evaporation, because evaporation causes the change of humidity. If one can “evaluate and measure” evaporation, one will know humidity since it is governed by evaporation.
Evaporation: Experiments and Graphs
Evaporation had been experimentally researched by the Dutch professor Petrus Musschenbroek in the course of his research on capillary forces (Pater Reference Pater1979, 227–290). He had derived a correlation between the amount of evaporation and the total mass of water (not only the surface), these being in inverse proportion. Lambert's first scientific publication in the Acta Helvetica (Reference Lambert1755) repeated Musschenbroek's experiments, because it was not clear whether Musschenbroek had taken into account all circumstances that entered into the problem and whether Musschenbroek had described the circumstances of the experiments with due detail (Lambert Reference Lambert1769, 70). Lambert's results did not completely agree with Musschenbroek's conclusions, but it was only some years later, Lambert having deferred to settle the matter, that the Swede Wallerius “with much care” did similar experiments but came to the conclusion that evaporation correlates with the surface of the water only, and with the temperature and wind. Lambert concludes: “the cause of evaporation [lies] in the contiguity of air and water” (ibid., 72).
To settle if either Musschenbroek's hypothesis or Wallerius’ was right, Lambert repeated the experiment in his own chamber (in three different set-ups), detailing the conditions of the experiment, even noting whether or not he left his window open (which Lambert did in August, because it was too hot). His results confirmed Wallerius’ hypothesis (ibid., 76 and 85).
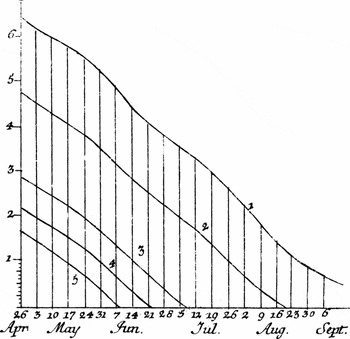
Lambert not only details his experiments and carefully enters all conditions and measurements in his table of data, but adds another means of data representation. Lambert visualizes his data, a strategy quite unusual in its time, of which Lambert is a forerunner.Footnote 28 As Lambert notes, “I will not make long comparisons with the numbers in this table, because one can see it d'un seul coup d'oeuil when the numbers change into figures” (ibid., 76). Representing the data in five separate graphs (corresponding to the five different vessels) with the height of the water on the Y-axis, the passing of time on the X-axis, it becomes immediately clear that all five graphs are more or less parallel, and thus, that the relationship between water height and time is a simple linear one (see fig. 1).
Lambert's visualization of the evaporation experiments. Each line corresponds to a vessel.

Lambert's use of visual strategies is connected to his views on the “appearance” (Schein) of things, as explained in his Phänomenologie. Perspective or spheric geometry used in astronomy are examples of a “language of appearances” (Sprache des Scheins) that can help to simplify certain problems as long as it can be retranslated into the language of reality (Phän. §5). Although visualizations belong to the “language of appearances,” they can be useful to determine the truth. In a discussion on figure and symbol (Figur and Zeichen) in the Semiotik (§52–64), Lambert explains that the figure can represent a specific case or a concrete thing, whereas its translation into algebraic signs makes it more general, abstracts from particulars (Sem. §57–8 and 62).Footnote 29 Translation into algebraic signs makes it possible not only to find one solution, one particularization, but to find – by syntactically linking up the signs – all solutions, all cases (Sem. §63–66).
However, when doing experimental physics, Lambert details the relationship between Figur and Zeichen. He does this in the fourth part of the Anlage zur Architectonic, the 30th chapter, “Die Schranken,” the limits. Here, he discusses the limits of precision within algebra (e.g. errors produced by rounding off, non-convergent series) and within the measuring and recording of phenomena. The precision of measuring instruments, the number of observations, etc., all introduce limits to the precision of the obtained results. Therefore, in many cases, a (mechanical or geometrical) construction or a figure may be as precise or as suitable as a calculation for obtaining results, as long as the precision of the data is less than the precision of the construction or figure (Arch. §864–865).
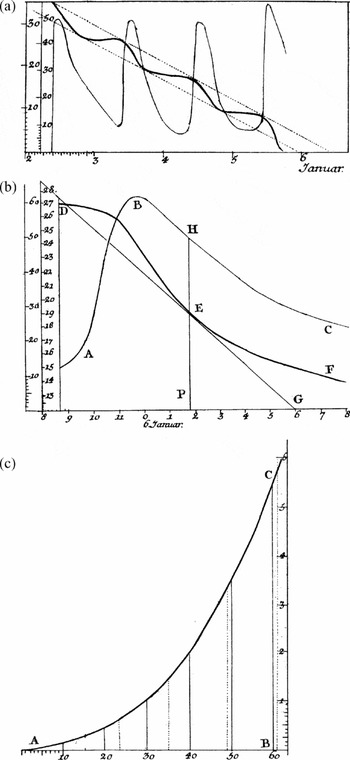
Hygrometry being a young science with but few undebatable results and even fewer standards, visualizations can be of great value. For instance, Lambert sets up some experiments to determine the relationship between air, water, heat, and evaporation and concludes, on the basis of graphs of the experimental results, that air causes the evaporation and that heat (forcing the particles to dilatate) contributes greatly to the celerity of the evaporation. On the basis of first graph (the upper one in fig. 2) it jumps to the eye that heat and evaporation are correlated. On the basis of a mechanical differentation Lambert obtains the lower figure in fig. 2. He remarks:
It would be quite difficult to give a priori an algebraic equation that satisfies the curve of [this] figure. . . . but we can always indicate the general symptoms that the curve has to satisfy. (Lambert Reference Lambert1769, 87)Footnote 30
The curve, containing points with a temperature and a water height component, indicates that the celerity of evaporation depends exponentially on the increase of heat. Lambert also notes that the curve implies that evaporation also happens, though slowly, beyond the freezing point, and becomes very fast beyond the boiling point, though for neither phenomenon does he venture to decide if these are asymptotic axes of the curve. In other words, Lambert is doubtful whether there is an absolute point of temperature where the evaporation begins or stops.
Transformation of Graphs in Lambert's Hygrometric Studies: The upper figure (2a) represents the temperature (the oscillating curve) and the loss of humidity (the steadily decreasing curve), their correlation is made evident by the intelligent design of the graph showing the meeting points of both curves; the middle figure (2b) is a blown-up detail of the upper figure with a tangent on the humidity curve; the lower figure (2c) is obtained by graphically displaying the intersection points of the tangents on the humidity curve with the X-axis, i.e. the mechanical differentiation of the humidity curve which generates a curve of the rate of evaporation.

For practical reasons Lambert determines a parabole-like curve that locally fits the curve of the lower figure (see fig. 2) between zero and 60 degrees (Réaumur, corresponds to 0 to 75 degrees Celsius). He simply fits the equation to all experimental points of the curve according to the method set out in Arch. §894 and 899. The equation is:

Lambert is perhaps the major forerunner of modern statistical techniques, both graphically and computationally.Footnote 31 These graphs and their interpretation and manipulations function as a sort of midwivery for mathematical formulae that would connect the observational data. Thus, one need not wonder if Lambert experiments a little with this equation. Getting rid of the zeros in the fractional part, he arrives at the equation

and remarks that this comes close to

which is the power expansion of ex−1. Ultimately he derives a hypothetical differential equation dy = mydz that governs the growth of evaporation (Lambert Reference Lambert1769, 90), though only for the “regular” interval given above. Also, the air pressure and the humidity of the air are not taken into account.Footnote 32
Setting up the Hygrometer
Asking questions of Nature is much like an experiment in trying to understand and speak its language.
Barometers spoke an intelligible language from the day they were invented; the thermometer did not speak so clearly at first. Only in 1714 did Fahrenheit give to Wolff two corresponding thermometers, and even today this language is only a comparative one . . . . We have to take a closer look at the hygrometers to try and understand their languages and to make it intelligible. (Ibid., 68)Footnote 33
Indeed, though the boiling point of water served as the fixed point for the common sense use of thermometers at end of the eighteenth century, its further scientific determination would be a matter of much research and debate inasmuch as the Royal Society assembled a committee to make recommendations about a standard fixed point (Chang Reference Chang2004, 8–17). Moreover, the comparability of thermometers (i.e. the correspondence of their scales) would remain problematic until the middle of the nineteenth century (Chang Reference Chang2004, 57–102).
In a long discussion on measure and scale (“Maaßstab,” Arch. § 759–783) Lambert discerns between three kinds of relationship between a quantity and its measure: First, the case where the unit of measurement and the thing to be measured are of the same nature, whose quality and dimension are known, and thus are comparable to other quantities (e.g. length in geometry, height in barometry, Arch. § 761–762); second, where the unit of measurement and the thing to be measured are of the same nature but defy comparison with other quantities (e.g. weight, Arch. § 763); and last, the case where not the quantity itself, but only an effect or a connected quantity can be measured, a case that gets worse when only “greater than” or “lesser than” can be measured (Arch. § 764). Here is where thermometry and hygrometry are situated. Although Lambert does not make this explicit, his own “measure” of the three classes is forged after a distinction is made between different kinds of physical appearances. Either the appearance (e.g. the representation of a phenomenon) differs only gradually from its true nature (e.g. a drawing for a solid body, a line for a movement), or they are of a different nature (nach der Art verschieden), as e.g. our representation of color and tone is not in the same medium as color and tone themselves (Phän. § 85, § 92–93). As a consequence the mapping between things and their concepts/signs is more difficult in the second case. Lambert's two classes of appearance, or three classes of measurement thus reflect a degree of comparability/communicability.
Here, the thermometer is better off because they can be made to correspond (the same degree of heat can be measured under specified circumstances), though an absolute degree of heat is still missing. The hygrometer then is only “a very imperfect display of humidity” (Arch. § 764). Lambert also remarks (Arch. § 779) that there are often limits to the measurement, giving the example of a thermometer that might approximately behave linearly during a certain interval, but rather more complex at the extremities (boiling and freezing). In that case, Lambert advises drawing a graph and analyzing its symptoms, so as to study the simple quantity and its complexities piecewise (stückweise). This is exactly what Lambert sets out to do for the hygrometer using the “tame” part of his curve of evaporation between zero and 60 degrees Réaumur.
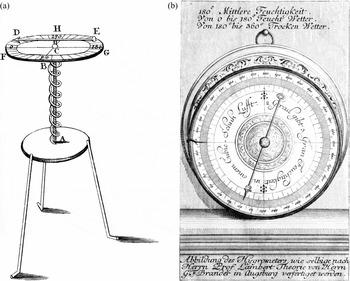
In the perfection of the hygrometer, the first problem to settle is what substance should be used to measure humidity? Lambert lists the viable options at the time: wood, cords, sponges – and chooses the thin cords, with which he had already 15 years of experience (Lambert Reference Lambert1769, 92). Fig. 3a shows his set-up of the hygrometer, a cord wound around a metal stick, with a “dial” on top of it to measure the rotation of the threads in the cords. Given this, “I still had to submit my hygrometers to other tests so as to get to know their language and the law of their variations” (ibid., 101).Footnote 34 This comes down to “synchronizing” the behavior of the hygrometers with the extremes of the curve of evaporation, to find their points of “absolute” dryness and wetness.
Left (3a), Lambert's original set-up of the hygrometer; right (3b), the ulterior design of the Lambert-Brander hygrometer.

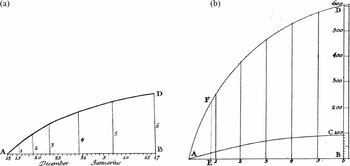
Enclosing the hygrometers in a bottle and turning the heat on, Lambert finds that from a certain temperature onwards the drying slows considerably. Repeating this experience over several days, the hygrometer comes to a standstill. Displaying his data in a graph, Lambert concludes: “it seems there is something asymptotical there” (ibid., 107). Similarly, Lambert tries different procedures to find the maximum of humidity for his hygrometer, and finally comes up with a graph of data where a certain “concavity” in the graph shows up (ibid., 119–120). As a final check on his experiments in fine-tuning the hygrometer, to compare the rate of evaporation directly with the movement of the hygrometer's dial, Lambert puts both their parallel evolutions in graphs (fig. 4). The general symptoms of both curves indeed concord, but it is clear that the hygrometer only absorbs (and hence displays) a certain percentage of the humidity present in the air.Footnote 35
The graphs that show the match between the curve of evaporation (left) (4a); and the curve of the hygrometer (right) (4b).

The 1769 article ends with an interesting side-track (Abweg), an essay in finding a mathematical way to quantify the evaporation in sponges (ibid., 123–126). Lambert sets up an experiment with three sponges of increasing size. Although some parallelism between the curves of evaporation from the three sponges is visible, Lambert remarks that the relationship between the surface of the sponge and its volume makes them difficult to handle, since evaporation on the surface must take away the mass of water in the sponge's volume. Having no procedure at hand to calculate the surface of a sponge (fractal geometry is still 200 years away),Footnote 36 Lambert concludes that sponges are indeed not suited for building a steady quantitative instrument.Footnote 37
Correspondences
It had been Lambert's ambition in his 1769 article, not only to perfect the hygrometer and to find its quantitative language, but also to find an absolute quantitative language, absolute measurement. His experiments had, however, shown the difficulty (if not the impossibility with the instruments of his time) to determine an absolute degree of dryness or wetness. Instead of this, Lambert had been able to define a comparative language with two marker points (not unlike the thermometer but with a much more irregular behavior in between). These marker points (a “gentle” minimum and maximum of humidity) were defined by their procedures. Lambert had indicated the dimensions of the tubes used, the quantity of water, heat involved etc. to assure that (ibid., 107 and 119). This way, assuming hygrometers of the same materials and quality, hygrometers could be made so that observers and experiments would “correspond.”
Immediately after the publication of the first paper on hygrometry, Lambert sent a copy of the paper to his long-time friend, the instrument maker Georg Friedrich Brander in Augsburg.Footnote 38 In the accompanying letter of November 1771, Lambert encouraged Brander to start manufacturing corresponding hygrometers (Lambert Reference Lambert and Bernoulli1781–1787, IV, 308). “I would like to see this hygrometer become a common instrument, and then the essay itself can be translated.”Footnote 39 Thus a dialogue between Lambert and Brander ensued that continued more than three years over how to make the hygrometers correspond.
It rather quickly becomes clear that Lambert's procedures to fix the marker points (as described in his 1769 essay) do not function very well. Although the degree of average humidity (Grad der mittleren Feuchtigkeit) functions rather well as a point of correspondence between two hygrometers, the extremes do not. Other procedures to fix the extreme marker points are discussed and Brander comes up with the idea to use the average degree as a fixed point together with a scale to “synchronize” hygrometers per degree.Footnote 40 In the end, the two correspondents agree to make a standard hygrometer (Normalhygrometer) to “synchronize” the hygrometers (ibid., IV, 351–352 and 357–358). A tentative correspondence between Lambert's and Brander's hygrometers is finally achieved at the end of December 1772.Footnote 41
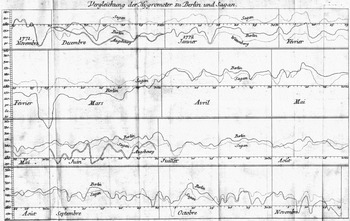
By this time, Lambert had not only his own hygrometric observations, but also those of the prelate Felbiger in Sagan,Footnote 42 those of Maschenbäuer's, a friend of Brander in Augsburg, and finally those of Professor Titius in Wittenberg, who had, independently of Lambert, started to make a hygrometer. According to the Monatsbuch, Lambert's scientific diary, Lambert devoted April to June of 1772 to comparing and collating the observations (Bopp Reference Bopp1916, 31). The result of it all is put into one large graph, displaying the observations of each participant (fig. 5). The correspondence with Brander and the graph are the immediate materials that were included in Lambert's Reference Lambert1772 article, “Suite de l'essai d'hygrometrie” (Lambert Reference Lambert1772).
Lambert's master graph, collating all hygrometer observations and the basis of his (a priori) derivation of a meteorological law

The graph shows that the observations of all participants are in accordance, at least if one only looks at the contours and the relative maxima and minima. Although Lambert admits that the material is scarcely enough to find annual regularities or other periodicities, he endeavors to search for an equation fitting the observations. He starts with a hypothetical formula, relating humidity to the longitude of the sun (i.e., to the expected temperature of the season):

In a first approximation, the formula becomes y = B sin x, which fits the curve reasonably well, abstracting from the actual shape of the observations curve, and looking only at the cutting points with a middle axis of intermediate humidity, which is the arithmetical middle of the observations (ibid., 75–76).
To check his tentative formula, Lambert compares it with the measurements (on a sponge hygrometer) that Crucquius published in the Transactions of the Royal Society from 1721 to 1723. Lambert sees his hypothesis confirmed: the increase and decrease of humidity varies more or less like the increase and decrease of temperature, with a phase shift of 4 to 5 weeks (ibid., 76–79). At long last, Lambert is able to execute part of his program on meteorology, to find periodicities and to quantify them.
Discussion
In his hygrometric studies Lambert attests to his skills both as a very conscientious experimenter, operating on a similar level as his contemporaries Horace Benedict de Saussure (1740–1799) or Jean-André De Luc (1727–1817), and as a resourceful applied mathematician, in this respect the equal of Leonhard Euler (1707–1783) and close in spirit to Tobias Mayer (1723–1762). What makes Lambert quite a unique apparition in the latter half of the eighteenth century is not this combination of experimental and mathematical practice as such, but the fact that it is inherently and consistently embedded in a rich systematic philosophy of knowledge and theory of science. As our “dissection” of Lambert's hygrometry shows, the four parts of the Neues Organon provide the main lines of direction for how to sharpen a concept, how to deal with the appearance of things, what kind of propositions to look for, etc., but it is mainly the substantiation of these general guidelines for the case of applied mathematics/experimental science in the fourth part of the Anlage zur Architectonic (Organon Quantorum) that directly pours into Lambert's practice.
In particular in the cases where the gap between the thing to be studied and its scientific apprehension (be it as a concept, a measurement, or a theory) is large, Lambert's strategies and heuristics laid down in the Organon Quantorum are quite performant. The semantic determination of the concept humidity (cfr. Arch. § 437, 561), the graph of evaporation and its subsequent manipulations until the derivation of a differential equation (cfr. Arch. §885–902), or the tuning of the hygrometer using extremes of the “tame” behaviour of evaporation (cfr. Arch. § 779) are neat examples of how Lambert finds his way out of an impasse. Where experimental research is at its end, Lambert throws in mathematical and mathematico-mechanical (e.g. mechanical differentiation, graphs) techniques.Footnote 43 This way, the “grey zone” between a thing and its apprehension can be explored or even mapped, be it piecewise.
As the usage of the graphs in the hygrometric studies shows, this exploring/mapping of a “grey zone” may be a posteriori (e.g., the graph of evaporation yields an equation), but it may also be directed by an a priori determination of the expected result (either because extra knowledge is added or because an assumption is made), as is the case for the derivation of humidity equation. It must be added that Lambert's tricks did not always lead to the correct or the best results, mainly because Lambert trusted mathematics and theoretical considerations too much. For the synchronization of the hygrometer it turned out that Brander's method of a scale around “average humidity” functioned better than Lambert's fitting to the graph's extremes. And in the case of a study on magnetism Lambert derived an erroneous equation because an a priori assumption made him “misread” his graph (Gray and Tilling Reference Gray and Tilling1978, 26).
However, more often than not, the embedding of his scientific practice into an open but systematic theory with an eye for heuristics, inherent limitations and problems, gave Lambert a firm methodological advantage over his contemporaries, as for instance Jean-André De Luc, who may be regarded as a typical exponent of late eighteenth-century experimental physics. As recent scholarship has stressed, De Luc's investigations are characterized by a worry to “stabilize” the object of the experiments, on the level of description and prescription as well as on the level of measurement.Footnote 44 It resulted in a meticulous description of the experiment, its set-up, conditions, and results and a nearly unsurveyable heap of data and detail collected during the many variations of the experiments. Although De Luc studied boiling with 8 kinds of thermometers and varied the conditions of the experiments, all duly described, he ended up with a list-like phenomenology of what boiling was or could be (Chang Reference Chang2004, 20 and 60–64). An injection of Lambert's methodology might have done wonders here: For semantically narrowing down the concept of boiling in advance; for plotting the many data to obtain characteristic symptoms and reducing the sheer amount of information gathered in the experiments; and finally, for applying some probabilistic logic (as laid out in Phän. § 149–262) to the list-like results of the experiments.Footnote 45
In this comparison of De Luc and Lambert, one may indeed recognize an “epistemic shift” (Hofmann Reference Hoffmann2006, 49–50 and 52–53). On the one hand, De Luc can be regarded as an example of the eighteenth-century experimenter's philosophy where the measurement and the instrument may be perfected without limits if only detailed description and prescription are followed. On the other hand, Lambert heralds a nineteenth-century practice where the unavoidable limits of the perception and the instrument are taken into account, mostly in a mathematical-statistical way. This shift takes place as part of a more general evolution, viz. the standardization of experimental life and mathematization of experimental physics in the surrounding of the Ecole Polytechnique and the growing internationalization of science (e.g., astronomy) at the beginning of the nineteenth century. Lambert is indeed part of this evolution. His mathematical background allows him to find new procedures to overcome difficulties arising in experiments, and as his involvement in the founding of the Berliner Astronomisches Jahrbuch and in a mathematical table project shows, Lambert was also a zealot for internationalization and standardization.Footnote 46
This inscription of Lambert into a broader general epistemic evolution, although correct, fails to do justice to Lambert's theory and practice of science. E.g., Lambert's heralding of statistical techniques obscures the fact that, deep down, his approach is incommensurable with later nineteenth-century developments. As his former collaborator Johann Karl Schulze writes in an article published shortly after Lambert's death, Lambert's graphical “constructions” (for doing astronomy in this case) are most “ingenious” but few are so dextrous at executing them, therefore Schulze prefers “a long and troublesome calculation” (Schulze Reference Schulze1782, 332–333). This is indeed the direction that the generation after Lambert would choose. Equally, his careful, detailed but involved theory of science would be dismissed by the next generation of philosophers (especially by Hegel in his Wissenschaft der Logik 1812–1816). Lambert's Organon is still deeply rooted in a scientific tradition associated with craftmanship (e.g., the constructions) and in a logical and semantic framework in the line of Christian Wolff's philosophy. Perhaps exactly in these antiquated roots lies much of the uniqueness and constistency of Lambert's approach. To achieve a faithful mapping of things in the real world and concepts in the intellectual world lies at the heart of Wolff's theory of knowledge and of Lambert's too. Seeing, however, the inadequacies of Wolff's simple logic and mathematics to assure the psychological reductions occurring in that symbolic thinking that is supposed to link up the real and the intellectual world (cfr. fn. 29), Lambert supplements it with various stratagems and heuristics such as probabilistic logic, visualizations, etc. These retain a fragmentary and transitional character, being part of a “tool kit” of the mind, because, ultimately, mathematical expression is the goal. However, they announce a new awareness of the world and its phenomena and a new way of interacting with it, acknowledging that feedback between nature and its apprehension is inevitable.
Acknowledgments
For many interesting discussions and comments the author would like to thank Friedrich Steinle, Erhard Scholz, Gregor Schiemann, Gerhard Rammer, Michael Stölzl, and Wiebke Herr of the IZWT at Bergische Universität Wuppertal where this paper was prepared and written during a research stay funded by the Alexander-von-Humboldt Foundation. For their help in preparing the illustrations, I thank Urs Schoepflin, Ellen Garske, Ralf Hinrichsen, and the Digigroup members of the Max Planck Institute for the History of Science, Berlin, as well as Miki Elazar, currently at Berlin.