

Introduction
Some, though not all, older adults respond to actual or perceived declines in their physical abilities by regulating their own driving to reduce their crash risk. These self-regulated driving behaviours may include avoiding situations like bad weather or traffic (Baldock et al. Reference Baldock, Mathias, McLean and Berndt2006; Ball et al. Reference Ball, Owsley, Stalvey, Roenker, Sloane and Graves1998; Carmel, Rechavi and Ben-Moshe Reference Carmel, Rechavi and Ben-Moshe2014; Charlton et al. Reference Charlton, Oxley, Fildes, Oxley, Newstead, Koppel and O'Hare2006; Ruechel and Mann Reference Ruechel and Mann2005). One of the strongest and most consistent predictors of self-regulated driving is gender: women are more likely to restrict their driving than are men (Bauer et al. Reference Bauer, Adler, Kuskowski and Rottunda2003; Charlton et al. Reference Charlton, Oxley, Fildes, Oxley, Newstead, Koppel and O'Hare2006; Gallo, Rebok and Lesikar Reference Gallo, Rebok and Lesikar1999; Giesel and Rahn Reference Giesel and Rahn2015; Hakamies-Blomqvist and Wahlstrom Reference Hakamies-Blomqvist and Wahlstrom1998; Kostyniuk and Molnar Reference Kostyniuk and Molnar2008; Molnar et al. Reference Molnar, Charlton, Eby, Langford, Koppel, Kolenic and Marshall2014; Morgan et al. Reference Morgan, Winter, Classen, McCarthy and Awadzi2009; Okonkwo et al. Reference Okonkwo, Wadley, Crowe, Roenker and Ball2007; Rimmö and Hakamies-Blomqvist Reference Rimmö and Hakamies-Blomqvist2002; Vance et al. Reference Vance, Roenker, Cissell, Edwards, Wadley and Ball2006; Yoshikawa and Bednarz Reference Yoshikawa and Bednarz2013). This pattern is found in countries varying in individuals’ reliance on automobiles and the availability of transportation alternatives, as well as constructions of gender that could shape driving behaviour – for example, in the United States of America (USA) (Gallo, Rebok and Lesikar Reference Gallo, Rebok and Lesikar1999), Japan (Yoshikawa and Bednarz Reference Yoshikawa and Bednarz2013), Finland (Hakamies-Blomqvist and Wahlstrom Reference Hakamies-Blomqvist and Wahlstrom1998), Sweden (Rimmö and Hakamies-Blomqvist Reference Rimmö and Hakamies-Blomqvist2002) and Germany (Giesel and Rahn Reference Giesel and Rahn2015).
These gender differences have implications for roadway safety and older adults’ wellbeing. Men's greater reluctance to self-regulate may reflect their driving longer than they are safely able, while women's more restricted driving may elevate their risk of its many negative effects, including social isolation, depression, cognitive and functional decline, and mortality (Choi, Lohman and Mezuk Reference Choi, Lohman and Mezuk2013; Fonda, Wallace and Herzog Reference Fonda, Wallace and Herzog2001; Mezuk and Rebok Reference Mezuk and Rebok2008; Ragland, Satariano and MacLeod Reference Ragland, Satariano and MacLeod2005; Siren, Hakamies-Blomqvist and Lindeman Reference Siren, Hakamies-Blomqvist and Lindeman2004). Although gender differences in self-regulated driving are well-documented, few studies examine explanations for them and their varying implications for transportation, health and ageing policy.
Our study uses a nationally representative sample of older Americans, the 2011 National Health and Aging Trends Study (NHATS), to examine two explanations for women's higher likelihood of self-regulated driving. One focuses on gender differences in health. Women may limit their driving more than men as a result of their worse health, in objective terms, or less favourable assessments of their health – or both. This explanation would suggest that women's greater self-regulation puts them at heightened risk of social isolation and reduced wellbeing – a pattern that would point to the need for an integration of health-care services with alternative transportation programmes. A second explanation focuses on women's resources rather than their limitations. Women's greater driving self-regulation may reflect their greater willingness to use driving alternatives – in particular, getting rides from friends and family, which is older adults’ most preferred and widely used option (Choi, Adams and Kahana Reference Choi, Adams and Kahana2012; Davey Reference Davey2007; Kim Reference Kim2011). Unlike the explanation hinging on gender differences in health, the driving alternatives explanation does not heighten concerns about older women's risk of isolation and reduced wellbeing as they transition from driving – but it does suggest a possible need for transportation or long-term care policies that reduce demands on the friends and family members often serving as drivers. We consider the role of each of these explanations in accounting for women's greater likelihood of avoiding four driving situations – alone, in rain or other bad weather, on highways and at night – and explore their implications for public policy.
Explanations for gender patterns in driving self-regulation
Approximately a quarter of older adults, and up to nearly a half in the oldest age groups, report self-regulating their driving (Charlton et al. Reference Charlton, Oxley, Fildes, Oxley, Newstead, Koppel and O'Hare2006; Molnar and Eby Reference Molnar and Eby2008). Some of the most frequently avoided driving conditions are at night, in rain and in heavy traffic (Baldock et al. Reference Baldock, Mathias, McLean and Berndt2006; Ball et al. Reference Ball, Owsley, Stalvey, Roenker, Sloane and Graves1998; Carmel, Rechavi and Ben-Moshe Reference Carmel, Rechavi and Ben-Moshe2014; Charlton et al. Reference Charlton, Oxley, Fildes, Oxley, Newstead, Koppel and O'Hare2006; Molnar and Eby Reference Molnar and Eby2008; Ruechel and Mann Reference Ruechel and Mann2005). However, these self-regulated behaviours are more prevalent among women (Bauer et al. Reference Bauer, Adler, Kuskowski and Rottunda2003; Charlton et al. Reference Charlton, Oxley, Fildes, Oxley, Newstead, Koppel and O'Hare2006; Gallo, Rebok and Lesikar Reference Gallo, Rebok and Lesikar1999; Hakamies-Blomqvist and Wahlstrom Reference Hakamies-Blomqvist and Wahlstrom1998; Kostyniuk and Molnar Reference Kostyniuk and Molnar2008; Molnar et al. Reference Molnar, Charlton, Eby, Langford, Koppel, Kolenic and Marshall2014; Morgan et al. Reference Morgan, Winter, Classen, McCarthy and Awadzi2009; Okonkwo et al. Reference Okonkwo, Wadley, Crowe, Roenker and Ball2007; Rimmö and Hakamies-Blomqvist Reference Rimmö and Hakamies-Blomqvist2002; Vance et al. Reference Vance, Roenker, Cissell, Edwards, Wadley and Ball2006). For example, a study of older Michigan drivers found that women's odds of self-regulating their driving in certain hypothetical situations (e.g. a 200-mile trip in an unfamiliar area) were between three and five times those of men (Kostyniuk and Molnar Reference Kostyniuk and Molnar2008). Further, these odds were higher than those of either age or physical health. Compared with men, women also are more likely to stop driving altogether – and at younger ages and in relatively better health (Choi et al. Reference Choi, Mezuk, Lohman, Edwards and Rebok2012; Kostyniuk and Molnar Reference Kostyniuk and Molnar2008; Morgan et al. Reference Morgan, Winter, Classen, McCarthy and Awadzi2009; Ragland, Satariano and MacLeod Reference Ragland, Satariano and MacLeod2004; Rimmö and Hakamies-Blomqvist Reference Rimmö and Hakamies-Blomqvist2002; Siren, Hakamies-Blomqvist and Lindeman Reference Siren, Hakamies-Blomqvist and Lindeman2004).
Research has documented these gender patterns but given limited attention to explanations for them. We found only two studies allowing direct tests of possible mediators of the relationship between gender and either driving self-regulation or cessation, though neither study's focus is explaining gender differences. One of the studies used a sample of over 800 drivers aged 55 or older in Maryland to examine predictors of self-regulated driving, including gender, age, health, and physical and cognitive functioning (Vance et al. Reference Vance, Roenker, Cissell, Edwards, Wadley and Ball2006). The results suggest that health limitations play a modest role in explaining women's greater self-regulated driving. Women reported worse health, as indicated by more health problems and greater prescription drug use, and lower physical functioning, measured as number of falls experienced and performance on a lower extremity function test. They also reported more self-regulated driving, indicated by a scale of ten driving situations (e.g. bad weather, alone, at night). However, less than 5 per cent of the total association between gender and self-regulated driving is accounted for by health, and none by physical functioning. The other study we found points to another explanation – women's more limited driving experience – though it provides limited support for this possibility (Rimmö and Hakamies-Blomqvist Reference Rimmö and Hakamies-Blomqvist2002). Using a sample of over 900 older Swedish drivers, the study finds that women's reports of more frequent driving experience errors, as self-reported, explained approximately 11 per cent of the association between gender and reduced driving, indicated by avoidance of particular situations (e.g. slippery roads, rush hour). Mediating effects were not observed for other driving-related factors, namely self-reported violations or mistakes – nor were they found for functional limitations.
Although these few studies suggest a limited mediating role of health, other patterns are consistent with this explanation. Women have worse health than men, particularly chronic, potentially disabling conditions (Rieker and Bird Reference Rieker and Bird2005), and worse health predicts greater driving regulation, a pattern found across health measures, including cognitive functioning, vision and hearing problems, functional ability, chronic conditions and self-rated health (Carmel, Rechavi and Ben-Moshe Reference Carmel, Rechavi and Ben-Moshe2014; Charlton et al. Reference Charlton, Oxley, Fildes, Oxley, Newstead, Koppel and O'Hare2006; Choi, Adams and Kahana Reference Choi, Adams and Kahana2013; Choi et al. Reference Choi, Adams and Kahana2012; Kostyniuk and Molnar Reference Kostyniuk and Molnar2008; Molnar et al. Reference Molnar, Charlton, Eby, Langford, Koppel, Kolenic and Marshall2014; Vance et al. Reference Vance, Roenker, Cissell, Edwards, Wadley and Ball2006). Health also is among older adults’ most commonly given reasons for their driving reduction, with vision problems the most frequently listed (Hakamies-Blomqvist and Wahlstrom Reference Hakamies-Blomqvist and Wahlstrom1998; Ragland, Satariano and MacLeod Reference Ragland, Satariano and MacLeod2004). However, gender differences vary across studies: some find the health explanation more common among men than women (Hakamies-Blomqvist and Wahlstrom Reference Hakamies-Blomqvist and Wahlstrom1998), while others find the reverse (Ragland, Satariano and MacLeod Reference Ragland, Satariano and MacLeod2004).
Older women's greater self-regulated driving may stem less from their greater health impairments than more critical self-assessments of physical capabilities that decline with age. For example, a study of over 1,000 older Finnish women comparing drivers and ex-drivers on three categories of health conditions – those impairing driving ability (e.g. cataract or glaucoma, dementia), possibly impairing driving ability (e.g. chest pain, diabetes) and not impairing driving ability (e.g. cancer, anaemia) – did not find higher rates of limiting conditions among ex-drivers than current drivers. It did, however, find that ex-drivers had higher rates of conditions possibly or not impairing driving (Siren, Hakamies-Blomvqist and Lindeman Reference Siren, Hakamies-Blomqvist and Lindeman2004). Such findings raise the possibility that women may view their health conditions as more limiting of their driving capabilities – self-assessments of which are already lower for women than men (Ackerman et al. Reference Ackerman, Crowe, Vance, Wadley, Owsley and Ball2011; Charlton et al. Reference Charlton, Oxley, Fildes, Oxley, Newstead, Koppel and O'Hare2006; D'Ambrosio et al. Reference D'Ambrosio, Donorfio, Coughlin, Mohyde and Meyer2008, Parker et al. Reference Parker, Macdonald, Sutcliffe and Rabbitt2001). Further, women are more likely than are men to see driving as a skill that declines with age, a view corroborated by their greater interest in taking defensive driving classes (Donorfio et al. Reference Donorfio, Mohyde, Coughlin and D'Ambrosio2008).
Another explanation for women's greater driving self-regulation centres on their greater willingness to use alternatives to driving, particularly rides from family and friends. Consistent with this explanation, receiving transportation support is associated with increased odds of driving cessation (Choi, Adams and Kahana Reference Choi, Adams and Kahana2013). Driving alternatives have not been examined in studies allowing tests of mediating effects, though gender patterns in social networks point to this possibility. Older women have larger social networks, including more friends, though these gender differences are rather small (Gillespie et al. Reference Gillespie, Lever, Frederick and Royce2015; McLaughlin et al. Reference McLaughlin, Vagenas, Pachana, Begum and Dobson2010). Differences are greater between women and men in their reliance on social networks, with older women receiving more rides from others (Choi, Adams and Kahana Reference Choi, Adams and Kahana2013; Kostyniuk and Shope Reference Kostyniuk and Shope2003). For example, a study of over 500 retirement community residents found that 60 per cent of married women received transportation support from their spouse, compared with only 38 per cent of men (Choi, Adams and Kahana Reference Choi, Adams and Kahana2013). Similar patterns were found for transportation support from family members (20 per cent of women versus 10 per cent of men) and friends (28 per cent of women versus 18 per cent of men). Women also are more likely to mention the availability of someone else to drive as a reason for reducing their own driving (Dellinger et al. Reference Dellinger, Sehgal, Sleet and Barrett-Conner2001). Further, women are more likely than men to have made plans for retiring from driving – and to include in their plans moving closer to family and friends (Oxley and Charlton Reference Oxley and Charlton2011). Women's greater reliance on rides from family and friends is consistent with research reporting men's lower likelihood of help-seeking, a likely consequence of dominant conceptions of masculinity highlighting self-reliance (Addis and Mahalik Reference Addis and Mahalik2003). Men are especially unlikely to seek help when they view themselves as unlikely to be able to reciprocate and the problem as non-normative – both of which are likely to describe men's requests for transportation assistance (Addis and Mahalik Reference Addis and Mahalik2003).
Another alternative to driving is public transportation; however, its role in explaining gender differences in self-regulated driving is likely to be more limited than that of rides from friends and family. Rates of public transit use are relatively low. For instance, a study using a sample of over 16,000 older Canadians reported that less than 8 per cent use it as their primary transportation mode. Similarly, results of 150 transit on-board surveys in the USA, collectively involving nearly half a million bus and rail passengers, indicate that less than 7 per cent were 65 or older (American Public Transportation Association 2007). However, prevalence varies by driving history and status, as illustrated by patterns reported in a recent US study by Choi and DiNitto (Reference Choi and DiNitto2016) using the NHATS. They find that less than 7 per cent of current drivers used public transit in the past month, compared with 16 per cent of ex-drivers and 28 per cent of never-drivers. Similar patterns were found for other driving alternatives, like van or shuttle services. Just over 1 per cent of current drivers used them in the past month, compared with 11 per cent of ex-drivers and 16 per cent of never-drivers. However, fewer differences are found in comparisons of women and men, suggesting a limited role for public transit use in explaining women's greater driving self-regulation (Turcotte Reference Turcotte2012). For example, approximately 5 per cent of older Canadian men use public transit as their main mode compared with approximately 8 per cent of women (Turcotte Reference Turcotte2012).
Our study extends research on gendered patterns in later-life driving by examining health limitations and driving alternatives as possible explanations for women's greater self-regulation. We use a nationally representative sample of older adults, in contrast with many prior studies of self-regulated driving behaviour, using state-level data (Bauer et al. Reference Bauer, Adler, Kuskowski and Rottunda2003; Gallo, Rebok and Lesikar Reference Gallo, Rebok and Lesikar1999; Kostyniuk and Molnar Reference Kostyniuk and Molnar2008; Okonkwo et al. Reference Okonkwo, Wadley, Crowe, Roenker and Ball2007; Vance et al. Reference Vance, Roenker, Cissell, Edwards, Wadley and Ball2006), community-based samples (Choi, Adams and Kahana Reference Choi, Adams and Kahana2013; Ragland, Satariano and MacLeod Reference Ragland, Satariano and MacLeod2004) or other non-representative samples (Charlton et al. Reference Charlton, Oxley, Fildes, Oxley, Newstead, Koppel and O'Hare2006). Exceptions include the studies of Finnish (Dellinger et al. Reference Dellinger, Sehgal, Sleet and Barrett-Conner2001; Hakamies-Blomqvist and Siren Reference Hakamies-Blomqvist and Siren2003; Hakamies-Blomqvist and Wahlstrom Reference Hakamies-Blomqvist and Wahlstrom1998; Siren, Hakamies-Blomqvist and Lindeman Reference Siren, Hakamies-Blomqvist and Lindeman2004) and Swedish drivers (Rimmö and Hakamies-Blomqvist Reference Rimmö and Hakamies-Blomqvist2002).
We test two hypotheses. The first addresses gendered patterns in driving self-regulation. We hypothesise that women are more likely than men to self-regulate their driving in all four situations examined (i.e. alone, at night, during rain or in bad weather, and on highways or other busy roads). The second hypothesis focuses on explanations for this gender difference. We hypothesise that women's worse health and greater likelihood of receiving rides from family members, friends and others provide partial explanations for their greater likelihood of driving self-regulation.
Data
We use data from Wave 1 of the NHATS – a longitudinal survey sponsored by the National Institute on Aging through a co-operative agreement with the Johns Hopkins Bloomberg School of Public Health (NHATS Public Use Data, Round 1Footnote 1). Designed as a successor to the National Long-term Care Trends Study (1982–2004), NHATS is aimed at examining national trends in and individual trajectories of physical functioning, including their implications for individuals, families and society. The content areas of the survey include the following: health conditions, physical capacity, cognitive capacity, ability to carry out essential activities by oneself, accommodations and measures of the environment (Kasper and Freedman Reference Kasper and Freedman2014).
NHATS is a nationally representative sample of persons aged 65 and older living in the contiguous USA and enrolled in Medicare as of 30 September 2010 (Montaquila et al. Reference Montaquila, Freedman, Edwards and Kasper2012a). Data collection involved a stratified three-stage sample design: (a) selection of 95 primary sampling units (i.e. individual counties or groups of counties); (b) selection of 655 secondary sampling units (i.e. ZIP codes or ZIP code fragments within sampled primary sampling units); and (c) selection from the sampled secondary sampling units of Medicare beneficiaries, with over-sampling of black, non-Hispanic persons and those of more advanced age (Montaquila et al. Reference Montaquila, Freedman, Edwards and Kasper2012a). Interviews were first conducted in 2011 and annually thereafter. Proxy reports were used when respondents were unable to answer interview questions on their own.
A total of 12,411 individuals were initially selected for possible participation in NHATS Wave 1. Of those persons, 979 were considered ineligible for further study (e.g. deceased, unable to be located) and another 3,187 persons were identified as non-respondents (Kasper and Freedman Reference Kasper and Freedman2016; Montaquila et al. Reference Montaquila, Freedman, Spillman and Kasper2012b). Reasons for classification as a non-respondent included, for example, poor physical or mental health (combined with lack of a proxy respondent); refusal by the sampled person, proxy respondent or care facility; or language barrier inhibiting communication with interviewers (Montaquila et al. Reference Montaquila, Freedman, Edwards and Kasper2012a). Altogether, 8,245 persons were considered viable respondents, 7,609 of whom completed a sampled person survey.
Because our study focuses on driving self-regulation, we restricted our analysis to persons having driven a vehicle at least once in the past month; this restriction omitted 2,365 older adults from our analytic sample. Among those persons, 684 were non-drivers and 1,681 were former drivers – with women the majority in both groups (91% of non-drivers and 68% of former drivers). Other sample restrictions included omitting 76 persons requiring a proxy respondent, 106 persons of a race or ethnic group other than the three most common (i.e. white, non-Hispanic; black, non-Hispanic; Hispanic) and 163 persons with missing data on any of the variables used in analyses. Our analytic sample was composed of 4,842 older drivers. Compared with these respondents, those omitted from our sample had significantly lower levels of educational attainment and worse health, and were less likely to be home-owners and more likely to avoid driving alone, at night or in bad weather.
Measures
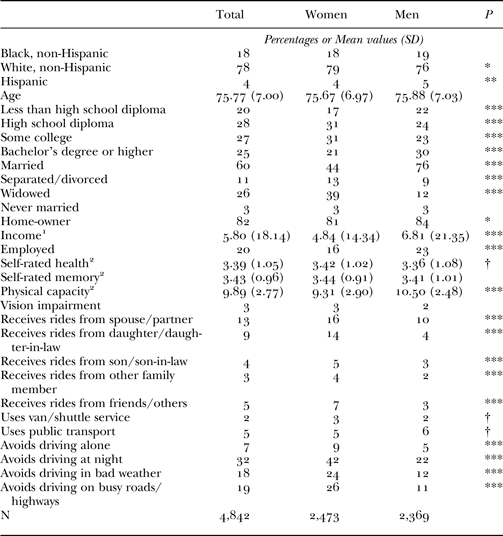
Self-regulated driving is measured using four dichotomous variables indicating older adults’ avoidance in the past month of the following driving situations: alone, at night, in the rain or other bad weather, and on highways or other busy roads. As shown in Table 1, the most common self-regulated driving behaviour is night driving, with nearly a third of respondents avoiding this situation. Other frequently avoided situations are driving in bad weather or on highways or other busy roads, with approximately one in five respondents avoiding either of them. The least commonly avoided situation was driving alone, a behaviour reported by less than one in ten respondents.
Variables for the total sample and for women and men

Notes: SD: standard deviation. 1. In US $10,000 units. 2. Higher values equal better health or functioning.
Source: National Health and Aging Trends Study, 2011.
Significance levels: † p ⩽ 0.1, * p ⩽ 0.05, ** p ⩽ 0.01, *** p ⩽ 0.001 (two-tailed t-test of gender differences).
Health is measured using four indicators: self-rated health, self-rated memory, physical capacity and impaired vision. Self-rated health is derived from a single item asking respondents to assess their health on a five-point scale from poor to excellent. Self-rated memory was measured using responses to a question asking participants to rate their memory at the present time, using a five-point scale from poor to excellent. On the self-rated health and self-rated memory measures, higher values indicate better health. A physical capacity measure captures respondents’ self-assessed ability to complete six paired tasks: walking three or six blocks, climbing 10 or 20 stairs, lifting and carrying 10 or 20 pounds, being able to bend or kneel down, being able to reach overhead with or without a heavy object, and being able to grasp small objects or open sealed jars using just their hands. Following the approach of other researchers using NHATS data, we assign respondents a score ranging from 0 to 2 on each paired task in regard to its difficulty and then sum these scores (Kasper, Freedman and Niefeld Reference Kasper, Freedman and Niefeld2012; Skolarus, Burke and Freedman Reference Skolarus, Burke and Freedman2014). The resulting scale ranges from 0 indicating very poor capacity to 12 indicating excellent capacity. Our analyses also include a dichotomous indicator of vision impairment, using responses to a question asking whether he or she sees well enough (with or without glasses or contact lenses) to recognise someone across the street.
Our measures of driving alternatives are drawn from responses to items asking whether in the last month respondents had used any of several strategies of getting to places outside their place of residence and, in the case of rides from others, their relationship with the person giving them rides most frequently. All driving alternatives are measured using dichotomous variables. We include variables referencing the receipt of rides from the following four sets of family members: spouse, daughter or daughter-in-law, son or son-in-law, and other family member(s). Our decision to combine daughters with daughters-in-law and sons with sons-in-law was guided by the findings of care-work research reporting that gender often trumps family relationships such that daughters and daughters-in-laws (rather than sons) do the bulk of the work (Brody Reference Brody2004). Another variable indicates receipt of rides from friends or other persons. Two variables indicate receipt of rides from public transportation (i.e. the bus, subway or train) or van/shuttle services.
We include several characteristics shown in prior studies to predict driving self-regulation or cessation (e.g. Choi et al. Reference Choi, Mezuk, Lohman, Edwards and Rebok2012; Kostyniuk and Molnar Reference Kostyniuk and Molnar2008). Gender is coded 1 for women and 0 for men. We operationalise race using three dichotomous variables: white, non-Hispanic (reference category); black, non-Hispanic; and Hispanic. Age is measured in years, ranging from 65 to 98. Education is measured using four dichotomous variables indicating highest level completed: less than a high school diploma, high school diploma (reference category), some college, and a bachelor's degree or more. Marital status also is measured using four dichotomous variables: married or living together (reference category), separated or divorced, widowed, and never married. We include two indicators of socio-economic status: home-ownership and individual income. Home-ownership is a dichotomous variable coded 1 for home-owners. Income (in US $10,000 units) was measured as an interval variable and consisted of respondents’ income from all sources including Social Security, pension plans, and mutual stocks or bonds. However, due to the substantial amount of missing data on this variable (41% in our analytic sample), we rely on a regression-based imputed measure of income provided in the NHATS data (Montaquila, Freedman and Kasper Reference Montaquila, Freedman and Kasper2012). Although the high percentage of respondents with missing income data reduces confidence in this measure, the procedures used to impute values dampen these concerns. In the full NHATS sample, only 56 per cent provided a total income amount, but another 13 per cent did report their total income within a bracketed range. Values were imputed for the 31 per cent of the sample missing on the bracketed income variable. Then values were imputed for the 44 per cent of the sample missing on the exact income variable (i.e. 13% within a reported income bracket and 33% within an imputed income bracket). The imputation models used a range of variables to predict income, including age, race-ethnicity, gender, educational attainment, home-ownership, veteran status, labour force status, spouse/partner's labour force status and interviewer observations about the home condition (Montaquila, Freedman and Kasper Reference Montaquila, Freedman and Kasper2012). In our analyses, we include a flag variable coded 1 for respondents with imputed values on income. Employed is a dichotomous variable coded 1 for respondents indicating they had in the past month either worked for pay or been self-employed.
Analytic strategy
We use logistic regression to examine the association between gender and each of the four self-regulated driving behaviours. For each behaviour we present four models. Model 1 includes measures for gender and the control variables. Model 2 adds the health measures – self-rated health, self-rated memory, physical capacity and vision impairment – permitting an examination of the role of women's worse health in explaining their greater likelihood of driving self-regulation. Similarly, Model 3 adds to the baseline model the measures of driving alternatives. Model 4 includes all variables used in prior models.
We ran two additional sets of models to analyse mediating relationships. The first set tests that a key condition of mediation is met – that the focal independent variable is associated with the hypothesised mediators (Baron and Kenny Reference Baron and Kenny1986). For this test, logistic regression was used for dichotomous dependent variables (i.e. vision impairment and each of the driving alternatives), and ordinary least squares regression was used for ordinal or continuous variables (i.e. physical capacity, self-rated memory and self-rated health). The results of models regressing the hypothesised mediators on gender and the control variables indicated that gender was significantly associated with only one of the health measures, physical capacity, with women reporting lower capacity than men. The regressions of driving alternatives on gender and the controls indicated that women are significantly more likely to receive rides from each of the following sources: spouse/partner, daughters/daughters-in-law, sons/sons-in-law, other family members and friends/others. Gender differences are not found in the likelihood of using van/shuttle services or public transportation. The second set of analyses computes indirect effects by using the product of coefficients approach and bootstrapped confidence intervals to test the significance of mediating relationships involving dichotomous dependent variables (MacKinnon and Dwyer Reference MacKinnon and Dwyer1993). The substantive conclusions drawn from the results of these tests are equivalent to those we report below.
Results
Table 1 summarises variables for the total sample and for women and men, noting significant gender differences. Compared with men, women are significantly more likely to limit their driving. The proportion of women engaging in each self-regulated driving behaviour is approximately double that of men. Less consistent gender patterns are observed in the hypothesised mediators. On only one health measure – physical capacity – do women have worse health than men. No gender difference is found in vision impairment or self-rated health or memory. Gender patterns also vary across the indicators of driving alternatives. Women are approximately one and a half to three times more likely than men to receive rides from family and friends. For both women and men, receiving rides from a spouse/partner is the most common driving alternative. However, men are less likely to receive rides from their spouse/partner (10% of men versus 16% of women) – though they are more likely to be married or co-habiting (76% of men versus 44% of women). For women, the second most common driving alternative is receiving rides from daughters/daughters-in-law. The widest gender difference is observed for this source of rides (i.e. 14% of women compared with 4% of men). In fact, a higher percentage of men use public transportation (6%) than receive rides from daughters/daughters-in-law (4%). Rides from sons/sons-in-law, other family members and friends were less common, but women were more likely to report each of them than were men. In contrast, women and men do not differ significantly in their likelihood of using public transportation or van/shuttle services.
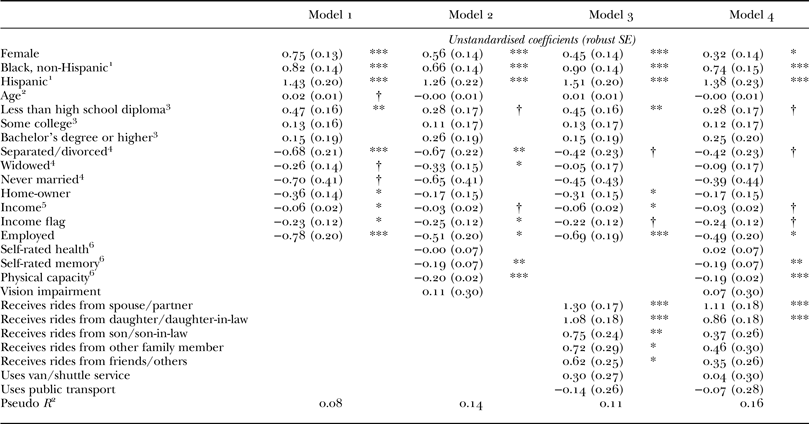
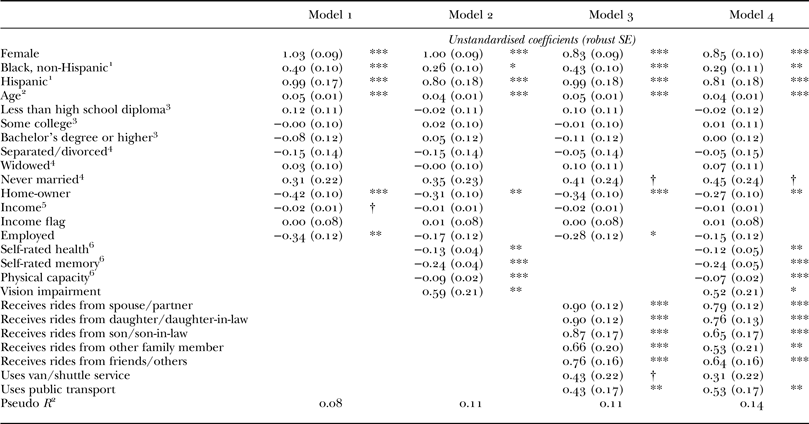
Table 2 reports the results of logistic regression models predicting avoidance of driving alone. As shown in Model 1, avoidance of driving alone is more likely among women than men. Model 2 adds health measures, with results revealing that better health – in particular, better self-rated memory and greater physical capacity – is associated with lower likelihood of avoiding driving alone. Further, the gender coefficient declines by 25 per cent, suggesting that women's worse health partially explains their greater likelihood of limiting their driving alone. Another explanation is considered in Model 3, the results of which indicate that receiving rides from family and friends is associated with increased likelihood of avoiding driving alone. The strongest effects are found for receipt of rides from spouses or daughters/daughters-in-law. The gender coefficient declines by 40 per cent, suggesting that women's greater likelihood of turning to social network members for transportation increases their willingness to self-regulate their driving. With the inclusion of all variables in Model 4, the gender coefficient declines by approximately 57 per cent, but remains significant.
Logistic regression of avoids driving alone on gender, health and transportation alternatives

Notes: N = 4,842. SE: standard error. 1. Reference group: white. 2. Centred at 65 years. 3. Reference group: high school diploma. 4. Reference group: married or co-habiting. 5. In US $10,000 units. 6. Higher values equal better health or functioning.
Source: National Health and Aging Trends Study, 2011.
Significance levels: † p ⩽ 0.1, * p ⩽ 0.05, ** p ⩽ 0.01, *** p ⩽ 0.001.
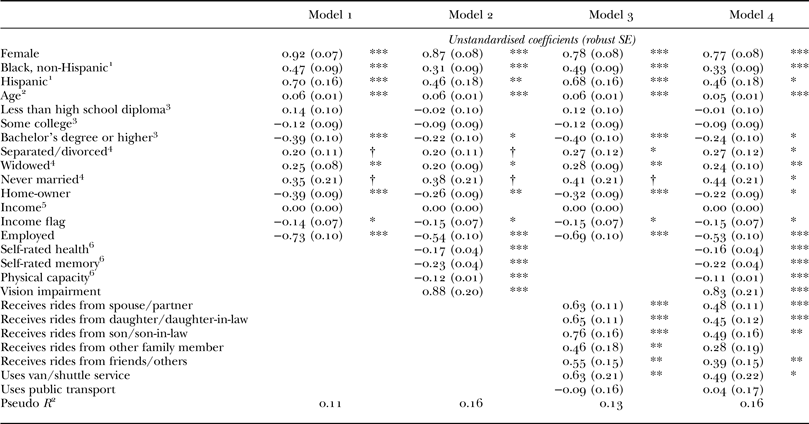
Table 3 reports the results of models predicting avoidance of night driving. Model 1 reveals that, controlling for background characteristics, this self-regulated behaviour is more likely among women than men. Model 2 contributes to the prediction of the likelihood of avoiding driving at night by adding health measures, all of which reach significance. Higher likelihood of avoiding night driving is associated with worse self-rated health, self-rated memory and physical capacity, and having a vision impairment. However, health appears to play a limited role in explaining women's greater avoidance of night driving, as the gender coefficient declines by only 5 per cent. A greater role is observed for driving alternatives. The results of Model 3 reveal higher likelihood of restricting night driving among those receiving recent rides from family or friends or using van or shuttle services. The associations are of similar magnitudes, with the largest observed for rides from sons/sons-in-law. With the inclusion of driving alternative variables, the gender coefficient declines by 15 per cent. In the final model, gender remains a significant predictor, indicating that the two explanations examined only partially account for women's greater avoidance of night driving.
Logistic regression of avoids night driving on gender, health and transportation alternatives

Notes: N = 4,842. SE: standard error. 1. Reference group: white. 2. Centred at 65 years. 3. Reference group: high school diploma. 4. Reference group: married or co-habiting. 5. In US $10,000 units. 6. Higher values equal better health or functioning.
Source: National Health and Aging Trends Study, 2011.
Significance levels: † p ⩽ 0.1, * p ⩽ 0.05, ** p ⩽ 0.01, *** p ⩽ 0.001.
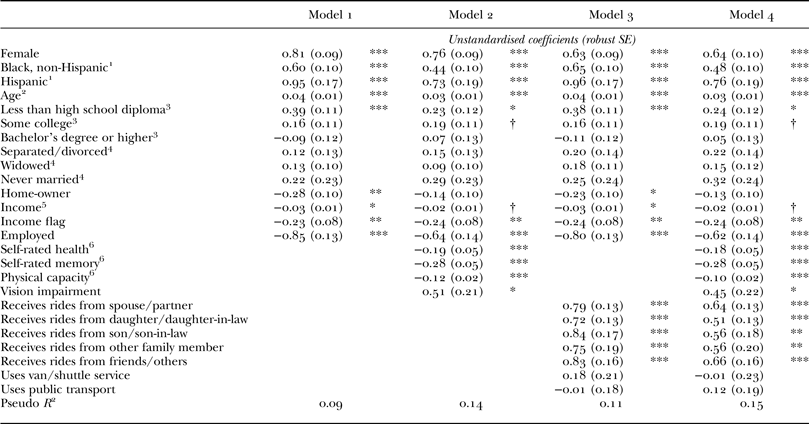
Table 4 reports the results of models predicting avoidance of driving in bad weather, with results similar to those found for night driving. Gender is a highly significant predictor, with women more like to self-regulate than men. Another predictor of avoiding bad weather driving is having poor health, as indicated by worse self-rated health, self-rated memory and physical capacity, and having vision problems. However, health contributes little to explaining the gender difference in avoiding bad weather driving, as the gender coefficient only declines by just 6 per cent. A greater mediating role is found for driving alternatives. In Model 3, receiving rides from family or friends significantly predicts avoiding bad weather driving, and the gender coefficient declines by 22 per cent. The associations are of similar magnitudes, with the largest observed for rides from sons/sons-in-law and friends or others. Rides from neither van/shuttle services nor public transportation are associated with this driving limitation.
Logistic regression of avoids driving in bad weather on gender, health, and transportation alternatives

Notes: N = 4,842. SE: standard error. 1. Reference group: white. 2. Centred at 65 years. 3. Reference group: high school diploma. 4. Reference group: married or co-habiting. 5. In US $10,000 units. 6. Higher values equal better health or functioning.
Source: National Health and Aging Trends Study, 2011.
Significance levels: † p ⩽ 0.1, * p ⩽ 0.05, ** p ⩽ 0.01, *** p ⩽ 0.001.
Table 5 reports results of models predicting avoidance of highway driving. Consistent with analyses of other self-regulated behaviours, gender is a strong predictor of avoiding highway driving. Further, although this association is partially accounted for by the explanations examined, particularly women's greater use of driving alternatives, it remains significant in the final model. Worse health, as indicated by worse self-rated health, self-rated memory and physical capacity, and having a vision impairment, also predicts greater likelihood of avoiding highways, but with the inclusion of these variables, the gender coefficient declines by just 3 per cent. In contrast, it declines by 19 per cent with driving alternatives included in the model. As we found in the prediction of other self-regulated driving behaviours, all the family and friend variables are significant. The strongest associations are found for spouses and daughters/daughters-in-law. In contrast with analyses of other driving behaviours, we find that public transit use is associated with greater odds of avoiding highway driving, though the association is weaker than those observed for all the family and friend measures.
Logistic regression of avoids highway driving on gender, health and transportation alternatives

Notes: N = 4,842. SE: standard error. 1. Reference group: white. 2. Centred at 65 years. 3. Reference group: high school diploma. 4. Reference group: married or co-habiting. 5. In US $10,000 units. 6. Higher values equal better health or functioning.
Source: National Health and Aging Trends Study, 2011.
Significance levels: † p ⩽ 0.1, * p ⩽ 0.05, ** p ⩽ 0.01, *** p ⩽ 0.001.
Like the results for gender, those for the control variables are similar across the four self-regulated driving behaviours. Results are most consistent for race and employment status. Black and Hispanic respondents and those who are not currently working for pay are significantly more likely than their respective counterparts to engage in each of the four behaviours. Greater self-regulation also is observed among more socio-economically disadvantaged respondents. Across all four driving behaviours, respondents who are not home-owners are more likely than home-owners to limit their driving. Similar patterns are found for education and income. Although not significant predictors of all four behaviours, lower education and income tend to be associated with greater driving self-regulation. In particular, we find evidence that lower education is associated with higher odds of avoiding driving alone, at night or in bad weather, and lower income is associated with higher odds of avoiding driving alone or in bad weather. A similarly consistent predictor of driving self-regulation is age, with older ages associated with significantly higher odds of avoiding driving at night, in bad weather and on highways. Patterns are least consistent for marital status, with results indicating that, compared with the married, the separated/divorced are less likely to avoid driving alone and the widowed are more likely to avoid driving at night.
Discussion
Although women's greater self-regulated driving is well-documented, very few studies have attempted to explain this pattern. We address this gap in the literature by examining two potential explanations: women's worse health and their greater use of driving alternatives. We find stronger support for the driving alternatives explanation, though only one such alternative plays a role: rides from friends and family members. Women are approximately one and a half to three times more likely than men to receive rides from each category of social relationships that we examined. Gender also shapes ride provision, as evidenced by daughters/daughters-in-laws’ more frequent ride provision than sons/sons-in-laws’ – a pattern consistent with research reporting women's greater contributions to most types of care-work (Brody Reference Brody2004). These patterns point to gendered norms surrounding both driving and social relationships. These norms, however, may be stronger in current cohorts of older adults than those that will follow – a possibility suggesting an avenue for further research.
The results provide limited support for the health explanation, consistent with the few prior studies addressing this issue (Rimmö and Hakamies-Blomqvist Reference Rimmö and Hakamies-Blomqvist2002; Vance et al. Reference Vance, Roenker, Cissell, Edwards, Wadley and Ball2006). However, our findings do reveal that health limitations contribute to gender differences in one of the behaviours we examined: driving alone. These findings suggest that different processes may underlie decisions about different self-regulated driving behaviours. While women's more extensive social networks, and willingness to use them, may facilitate a number of self-regulated driving behaviours, women's worse health may lead them to restrict their solo-driving, perhaps reflecting a preference for driving with others who could intervene if health emergencies arose.
Although our study illuminates some of the processes linking gender and driving self-regulation, our models do not fully account for women's greater likelihood of limiting their driving. This observation – along with the relatively modest explanatory power of our models – points to the importance of considering other explanations, such as gender differences in awareness of functional deficits and willingness to limit one's driving in response to them. Women may be more aware than men of their functional abilities, a pattern stemming from both the greater cultural attention to women's than men's bodies and the construction of women's physical abilities, including those related to driving, as inferior to men's. A gendered bodies explanation could contribute to producing similar patterns in earlier adulthood, including women's shorter distances driven, greater self-regulated driving and lower confidence in their driving ability (Bergdahl Reference Bergdahl2005; Jiménez-Mejías et al. Reference Jiménez-Mejías, Prieto, Martínez-Ruiz, Luna del Castillo, Lardelli-Claret and Jiménez-Moleón2014). Further, driving experiences across adulthood are likely to shape later-life gender patterns, as indicated by research finding that older women who report more ‘male-like’ personal driving histories are more likely to be drivers than are their less-experienced peers (Hakamies-Blomqvist and Siren Reference Hakamies-Blomqvist and Siren2003). In contrast with women, men may be less aware of and more reluctant to acknowledge ageing-related declines in their physical capacity and to limit their driving in response to them. Restricting one's driving not only may signal a failure to achieve dominant masculine standards of physical competence and self-reliance but also may require help-seeking from others, such as friends and family members.
Our study has implications for transportation, health and ageing policies. Our findings suggest that willingness to use driving alternatives – which women are more likely to do – is part of transitioning from driving. However, the relatively low use of all the alternatives we examined – from rides with spouses/partners and family members to use of public transit and van/shuttle services – points to the importance of better understanding older adults’ transportation needs and preferences, including their gendered dimensions. Such information would assist transportation planners in the design of options that both older women and men find accessible and appealing – which may increase their likelihood of use (Kim Reference Kim2011). Greater use of such alternatives also would alleviate the care-work demands placed on family members, especially spouses/partners, daughters and daughters-in-law, who provide the bulk of the rides. Our findings suggest that health plays a more limited role in explaining gender differences in driving self-regulation, but it does point to the potential utility of integrating health-care services with transportation programmes, to ensure that those most in need, including those with limiting health conditions, have access to driving alternatives. Such an integration also could prevent the negative effects of driving cessation on health and wellbeing by providing a context in which those most at-risk of these effects could be identified and linked with driving alternatives.
Directions for future studies include using panel data and exploring variation among women. Our data are cross-sectional, as are most studies reviewed in a meta-analysis of gender differences in driving self-regulation and cessation (Morgan et al. Reference Morgan, Winter, Classen, McCarthy and Awadzi2009). However, cross-sectional studies do not permit an examination of the process of driving self-regulation as it unfolds over time. Although we conceptualised health and the receipt of rides as factors shaping the likelihood of driving self-regulation, the process may operate in the opposite direction, with driving self-regulation influencing health and receipt of rides. Extensions of this study should use subsequent waves of NHATS to examine the underlying, likely bi-directional, processes, including possible gender differences. The use of panel data-sets, particularly those with relatively long time-spans, also permits examination of cohort variation – a possibility raised by research suggesting that greater convergence in women's and men's lifetime driving experiences may reduce gender differences in transitioning from driving (Hakamies-Blomqvist and Siren Reference Hakamies-Blomqvist and Siren2003). Further work should consider other sources of variation among women, including race-ethnic and socio-economic status, given the greater driving self-regulation among older women of colour and those with fewer socio-economic resources (Kim Reference Kim2011; Kim and Ulfarsson Reference Kim and Ulfarsson2015; Rosenbloom Reference Rosenbloom2004). These patterns in transportation disadvantage reveal further evidence of the far-ranging consequences of inequality, while also pointing to possible cultural variation in views of driving, and transportation more generally. As illustrations, research finds race-ethnic variation in dependence on private cars, views of ride sharing and giving, and responses to public transportation costs (Rosenbloom Reference Rosenbloom2004). Examining these sources of variation in gendered patterns in driving self-regulation – along with their explanations – will enable researchers and policy makers to understand better the degree and type of transportation disadvantage experienced across segments of the population and to address their needs.
Acknowledgements
This project was supported by United States Department of Transportation grant DTRT13-G-UTC42, and administered by the Center for Accessibility and Safety for an Aging Population at the Florida State University, Florida A&M University and the University of North Florida. We also thank the Johns Hopkins University Bloomberg School of Public Health and the National Institute on Aging for providing the National Health and Aging Trends Study data. The opinions, results and findings expressed in this paper are those of the authors and do not necessarily represent the views of the United States Department of Transportation, the Johns Hopkins University Bloomberg School of Public Health, the National Institute on Aging, the Center for Accessibility and Safety for an Aging Population, the Florida State University, the Florida A&M University or the University of North Florida.