Introduction
In recent years, smart antenna technology is becoming increasingly popular for mobile communication systems. Enhanced directivity desired by this technology is achieved through an antenna array. The controlling mechanism to the elements of an array provides maximum radiation/reception in specific directions (beam steering). Along with this null steering (no radiation/reception) is accomplished in interfering directions by suppressing the sidelobe levels (SLLs). These are the vital requirements in smart antenna-based modern wireless communication system. In most wireless applications, enhanced communication is achieved through minimization of close-in SLL (CISLL), adjacent to the main lobe. SLL, CISLL minimization, beam steering, and null positioning are the current area of research and highly demanding in nature in the domain of antenna array design.
Conventional methods such as recursive least squares, least mean square, constant modulus algorithm, and many more are used for null positioning and beam-steering applications in smart antenna arrays [Reference Balanis1, Reference Srar, Chung and Mansour2]. Many linear and nonlinear design equations are solved to achieve optimal results with the help of these methods. When the array size increases, it becomes challenging to solve those equations to get the desired solutions. The difficulties of solving such design equations can be overcome by the use of different evolutionary meta-heuristic optimization algorithms. In the past, several optimization algorithms are implemented in the synthesis of various antenna arrays for different applications. In [Reference Recioui and Azrar3–Reference Panduro, Covarrubias, Brizuela and Marante9], genetic algorithm (GA) and non-dominated sorting GA are employed in optimizing linear, planar, and circular array structures. Phase and amplitude excitations of the elements are optimized using GA to achieve radiation patterns of the desired SLL. Element positions of a linear array are optimized in [Reference Rajo-Lglesias and Quevedo-Teruel10], using ant colony optimization (ACO) for SLL minimization and null positioning. Spider monkey optimization (SMO) algorithm is introduced in [Reference Al-Azza, Al-Jodah and Harack-iewicz11]. Inter element positions of a linear array and the structural dimensions of an E-shaped microstrip patch antenna are optimized for synthesizing their array of factors. In [Reference Subhashini12], strawberry algorithm (SBA) is used for linear and circular array synthesis. The algorithm optimizes the amplitude excitations, and positions of the arrays for SLL minimization. Particle swarm optimization (PSO) in [Reference Khodier and Al-Aqeel13, Reference Khodier and Saleh14] effectively deals with amplitude excitations, phases, and positions for the synthesis of linear and circular arrays. SLL, CISLL minimization, beam steering, null placement, and minimization of transmission power are achieved. Comprehensive learning PSO is implemented to suppress SLL and null control in linear array and Yagi–Uda array [Reference Goudos, Moysiadou, Samaras, Siakavara and Sahalos15]. Mikki and Kishk [Reference Mikki and Kishk16] introduced quantum PSO (QPSO) for optimization of amplitude current distribution of a linear array. Optimal dipoles that yield radiation patterns equivalent to a cylindrical dielectric resonator antenna are also found using QPSO. In [Reference Muralidharan, Vallavaraj, Mahanti and Patidar17], QPSO is implemented for radiation pattern correction when some elements of a uniform linear array are entirely defective. Yue et al. in [Reference Yue, Cao, Hu, Cai, Hang and Wu18] applied chaotic PSO (CPSO) for estimation of the better angle of arrival for mobile positioning application. The CPSO is also considered for finding an optimal transmission power of a planar array in [Reference Li, Duan, Zhou, Song and Zhang19]. Through this method, suppression of the SLL is achieved by optimizing the aperture, number of elements, and the minimum spacing between the elements. PSO is combined with discrete Green's function in [Reference Mirhadi and Soleimani20] to accomplish appropriate dual-band patch antenna topologies. Ant lion optimization (ALO) algorithm is used in [Reference Saxena and Kothari21–Reference Das, Mandal and Kar23] for optimization of element positions, and current amplitudes of linear, elliptical, and circular arrays to achieve SLL, CISLL minimization, and null positioning. Other optimization algorithms such as Taguchi's optimization [Reference Dib, Goudos and Muhsen24], biogeography-based optimization (BBO) [Reference Sharaqa and Dib25], cat swarm optimization (CSO) [Reference Pappula and Ghosh26], simulated annealing (SA) [Reference Rattan, Patterh and Sohi27], symbiotic organisms search (SOS) [Reference Dib28], flower pollination algorithm (FPA) [Reference Singh and Salgotra29], whale optimization algorithm (WOA) [Reference Zhang, Fu, Ligthart, Peng and Xie30], and moth flame optimization (MFO) [Reference Das, Mandal, Ghoshal and Kar31] are implemented for SLL reduction and null control applications. In [Reference Jamunaa, Mahanti and Hasoon32–Reference El-Hassan, Awadalla and Hussein37], the algorithms like MFO, BBO, imperialist competitive algorithm, GA, firefly algorithm (FA), harmony search algorithm, PSO are used to optimize linear, planar, and circular arrays that generate shaped beams (such as flat-top, isoflux, and cosecant beam). Amplitudes, phases, and powers of excitations, element spacings, radius of the rings are optimized to generate desired shape beams with low peak SLL. In recent years, researchers are showing interest in the implementation of hybrid algorithms, which provide more accuracy of system parameters. Two different types of optimization algorithms are merged to form a hybrid algorithm. Li et al. in [Reference Li, Shi, Hei, Liu and Zhu38] developed HIGAPSO algorithm by hybridizing improved GA (IGA) and improved PSO (IPSO). Excitation amplitudes and phases of the signals applied to elements of the spherical conformal array are optimized to minimize average maximum SLL. Genetical swarm optimization (GSO) is introduced in [Reference Chaker, Abri and Badaoui39] for the optimization of unequally-spaced annular ring arrays. Half of the total population in GSO is created by PSO and the remainder is created by GA. In [Reference Omar, Debbat and Stambouli40], hybrid algorithm HBMO/TS built on honey bees mating optimization (HBMO) and tabu search (TS) is applied to find the complex excitation weight factors of an adaptive array for steering the main beam in the desired direction. Circular array optimization is carried out by the hybrid optimization algorithm formed by merging ALO and grasshopper optimization algorithm in [Reference Amaireh, Al-Zoubi and Dib41]. The number of array elements, current excitations, phases, inter-element spacings along the circumference is optimized to achieve minimum SLL. Salp swarm WOA is suggested by Prabhakar and Satyanarayana in [Reference Prabhakar and Satyanarayana42]. Amplitude excitations and phases of the conformal array elements are optimized for pattern synthesis. Hybrid algorithms eliminate the drawbacks of an individual algorithm by accomplishing the advantages of their constituent algorithms. The benefits of both algorithms are considered to increase optimization performance by achieving improved accuracy. Improved performances of hybrid algorithms inspired us to propose a new hybrid algorithm, modified ALO (MALO), based on ALO and CPSO.
ALO is proposed in [Reference Mirjalili43] by Mirjalili. It is applied to various benchmark functions, and the performances of it are evaluated. The performances are compared with famous optimization techniques such as bat algorithm (BA), FA, GA, CS, PSO, and FPA. ALO provides improved results, and in most of the test functions, it performs better than the other algorithms. Many engineering problems are solved using ALO. ALO is applied in [Reference Saxena and Kothari21–Reference Das, Mandal and Kar23] to obtain optimal linear, elliptical, and circular arrays. The results obtained using ALO are compared with uniform array and with the arrays optimized utilizing ACO, GA, PSO, CSO, BBO, SOS, and MFO. The performance of ALO-based array designs is much better than the arrays designed using other optimization algorithms and the uniform array. Hence, ALO is a suitable algorithm for antenna array optimization problems. On the other hand, CPSO improves accuracy and searching capability of basic PSO. CPSO is an improved PSO by embedding chaotic mapping to the basic PSO. PSO [Reference Eberhart and Kennedy44] was developed by Eberhart and Kennedy in 1995 and was modified by Shi and Kennedy in 1998 [Reference Shi and Eberhart45], whereas chaos-embedded PSOs were proposed by Alatas et al. in 2009 [Reference Alatas, Akin and Ozer46]. In CPSO, the paths of the particles are guided by the chaotic factors. Chaotic factor helps CPSO to avoid local minimums more easily than the basic PSO and provides improved results. Several variants of PSO are also evolved by modification of the basic PSO. Optimization problems in almost all fields are solved using traditional PSO and its variants. This way, PSO became most popular among all the evolutionary algorithms. In the past works, ALO and CPSO provided impressive performances. The advantages of both of these algorithms motivated to combine them for achieving a hybrid algorithm. The prime objective of framing the hybrid algorithm is to expect still better performance by merging the advantages of ALO and CPSO. The proposed algorithm is applied to some unimodal and multimodal benchmark functions available in [Reference Mirjalili43]. The performance indices (mean and standard deviations) and characteristic curves of the benchmark functions are analyzed. Performance indices of MALO on the benchmark functions are compared with that of other optimization algorithms available in [Reference Mirjalili43]. The indices demonstrate that the performance of MALO is superior than other algorithms. The convergence curves of the unimodal functions depict the high exploitation behavior of this hybrid algorithm. The multimodal function-characteristics shows that the exploration ability of MALO is also high. High exploration and exploitation behavior are the main advantage of MALO. These features enable the MALO algorithm to reach the global optimum, avoiding local optima. The results and convergence curves of the MALO on benchmark functions suggest that MALO can be employed as a substitute algorithm for different optimization problems.
Linear arrays are considered for optimization by most of the researchers. These arrays are the best suitable option to implement some new algorithms on them to validate the effectiveness of the algorithms. This is because the results of the numerous algorithms are readily available in the literature for comparison. Linear arrays, in general, are of three distribution types as uniform, binomial, and Chebyshev. Out of these three, Chebyshev array produces the smallest possible SLL for a given beam width between the first nulls. In this array, element excitation coefficients are associated with Chebyshev polynomials. The polynomials and their evaluations are available in [Reference Balanis1]. In this article, Chebyshev-based linear arrays are considered for optimization utilizing the proposed MALO. Four examples of Chebyshev-based linear arrays are optimized. Out of these four examples, three examples are the same array problems presented in [Reference Khodier and Al-Aqeel13] using ACO, in [Reference Khodier and Saleh14] using SMO, in [Reference Subhashini12] using SBA, in [Reference Khodier and Al-Aqeel13] using PSO, in [Reference Saxena and Kothari21] using ALO, in [Reference Dib, Goudos and Muhsen24] using Taguchi, in [Reference Sharaqa and Dib25] using BBO, in [Reference Pappula and Ghosh26] using CSO, in [Reference Dib28] using SOS, and in [Reference Das, Mandal, Ghoshal and Kar31] using MFO. The outcomes of these arrays are compared with that of the conventional uniform arrays and with the algorithms cited above. The comparisons consider isotropic elements, the same parameter specifications (spacing between the elements, amplitudes, and phases), and without a constant first-null beamwidth (FNBW) as in the previous works. In this way, appropriate comparisons between MALO and other algorithms are performed. The examples illustrate the benefits of higher exploration and exploitation behavior of MALO. The MALO provides the optimum parameters which offer a considerable reduction in peak SLL and CISLL. Superior beam steering in a specific direction is another advantage of this algorithm. The fourth design example introduces a new approach in the field of smart antenna technology. The significant contribution of this example is that the main beam can be steered in the signal of interest (SOI) direction while, placing the nulls in the signal not of interest (SNOI) directions.
The combination of CPSO with ALO to form MALO is described in the section “MALO algorithm”. In this section, validation of the MALO is also carried out by verifying its performance on two unimodal and three multimodal benchmark functions. The section “Problem formulation” presents the problem formulation. Results and discussion are demonstrated in the section “Results and discussion”. SLL, CISLL reduction, beam steering, and beam steering, along with nulls placing in specific directions, are analyzed. The results obtained are compared with that of the uniform arrays and with the previous works such as ACO, PSO, Taguchi, SMO, SBA, BBO, CSO, SOS, ALO, and MFO. The conclusion of the article is presented in the section “Conclusion”, followed by a list of references.
MALO algorithm
The original ALO is modified by embedding CPSO to achieve a highly promising new hybrid algorithm. The robustness of this modified algorithm is verified by some standard benchmark functions. These are explained as follows.
Ant lion optimization
Mirjalili explains the ALO algorithm in depth in [Reference Mirjalili43], so the detailed description is excluded here. The interactions of the antlions and ants, demonstrated in the algorithm include the following rules [Reference Mirjalili43]:
1. Ants and antlions are the search agents, and the ants change their positions in random directions all over the search space.
2. Traps by antlions have impacts on the movements of the ants.
3. Traps are constructed in proportion to the fitness of antlions. Higher is the fitness, larger is the trap, and higher is the possibility of catching the ants.
4. In each iteration, an antlion and the most fitting antlion (elite) can capture each ant.
5. The random walk adaptively decreases, and the probability of achieving a solution increases by increasing the sliding of ants to the antlions.
6. An ant is hunted by the antlion when the ant is fit. This indicates that an anticipated solution is found.
7. Antlion relocates itself to the recent hunting position and constructs a conical hole to optimize the ability to catch another ant.
The stochastic movements of the ants, throughout the optimization process, are defined as:

where cums computes the cumulative sum. Parameter t n is the iteration number and M is the maximum number of iterations. γ(t) is a random function described as follows:

where rand within the interval [0, 1] is a random number.
At every step, ants update their locations on the basis of equation (1). The random walks are modified based on normalization using the following equation:

where a i is the minimum value and b i is the maximum value of R i. $c_i^t$ is the minimum value and $d_i^t$
 is the maximum value of R i at the tth iteration.
The hunting ability of an antlion is modelled through a roulette wheel operator. The roulette wheel chooses an antlion and assumes that ants are captured only by the selected antlion. Movement of the ants is affected by the position of the antlions. This is described by the following equations:


where c i, d i are the minimum and maximum values among all random walks for the ith ant. c t, d t indicate the minimum and maximum values among all random walks at the tth iteration. $Al_j^t$ represents the position of the chosen jth antlion at the tth iteration.
When the ants slid into the trap, they try to escape from it. On the other hand, the sliding of ants towards the antlions is updated adaptively. Hence the values of c t and d t are updated using the following equations:


where w is a constant determined according to the present iteration. w = 2 at t > 0.1T, w = 3 at t > 0.5T, w = 4 at t > 0.75T, w = 5 at t > 0.9T, and w = 6 at t > 0.95T.
An antlion also updates the hunting position to increase its chance of capturing new ant. This phenomenon is demonstrated in the following equation:

where $A_i^t$ = position of the ith ant at the tth iteration.
The best antlion in the optimization cycle is considered as the elite. During the optimization process, the elite affects the random walks of all ants. Hence the position of each ant is updated by the simultaneous effect of the elite and the roulette wheel. This is expressed in equation (9) as:

where $X_{al}^t$ and $X_e^t$
 represent the random walk nearby the antlion selected through a roulette wheel and nearby the elite obtained within the optimization process at the tth iteration, respectively.
Modification of ALO
The advantage of ALO is that it avoids optimal local values. In the original ALO, CPSO is integrated to improve the optimization functionality to provide more accurate design parameters. The working procedure of CPSO is focused on the behavior of searching for foods by a group of birds or schooling of fish. The searching agents (birds/fishes) search for optimal solutions in adequate space and thus increase the probability of obtaining optimum values. Each agent moves randomly towards a global best position with its velocity and position vectors which are updated by equations (10) and (11) [Reference Shi and Eberhart45] as:


The variables of equation (10) are well-known in the domain of optimization through PSO and are described in [Reference Shi and Eberhart45]. The traditional PSO algorithm sometimes trapped prematurely in local optimums, which is a shortcoming. As described in [Reference Alatas, Akin and Ozer46], chaotic mappings help it to escape from the local optima. Chaotic maps constructed by mutating its initial state are apparently random deterministic and reproducible sequences. Several chaotic mappings, such as a logistic, tent, sinusoidal iterator, Gauss, etc. are adopted to enhance the global convergence of PSO. Here the CPSO considers the chaotic mutation operation based on logistic mapping to obtain the best optimal values. Logistic mapping shows vital usefulness in the improvement of the searching process. Mapping is employed in each iteration, and the position can be further updated using the formula as [Reference Alatas, Akin and Ozer46]:

where i is the current iteration. d = 1, 2, …, dim and dim is the dimension of searching range. The x i is converted to the real positions as:

where lb is the lower bound and ub is the upper bound of the particles.
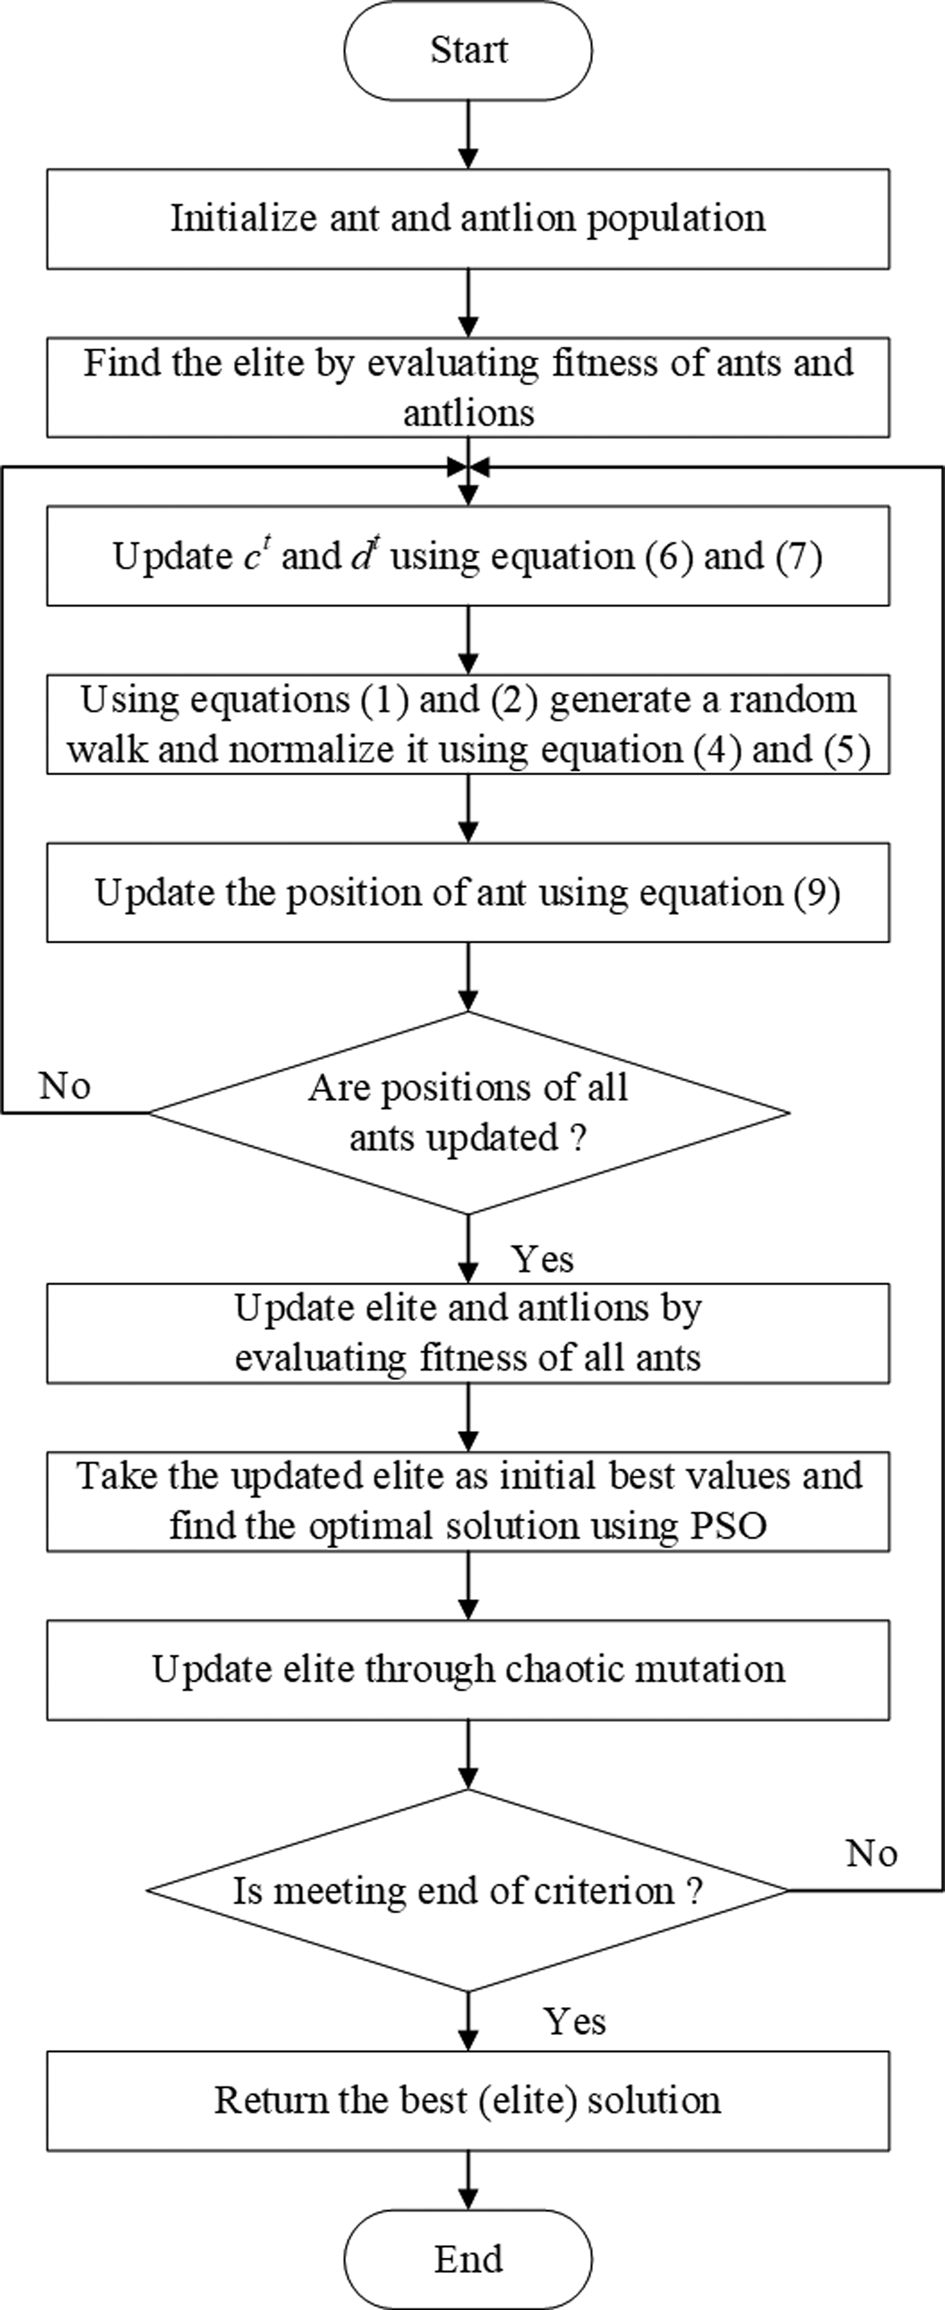
The optimization process of MALO involves the searching and updating strategy of both ALO and CPSO. In each iteration, the ALO explores the searching space first, by its search agents, the ants and the antlions. The positions of antlions define the optimizing parameters. After the exploration of searching space using ALO, the positions of antlions are updated and optimized employing CPSO. The positions of best-fitted antlions (elites) in each iteration are kept in memory. After the final iteration, the best elites are selected and the corresponding positions yield the global optimum parameters. The operational flow diagram of the MALO is shown in Fig. 1. The steps involved in the optimization process are as follows:
-
Step 1: The positions of antlions and ants are initialized randomly.
-
Step 2: The fitnesses of the antlions are calculated and the elite is selected.
-
Step 3: An antlion is selected utilizing the roulette wheel. The random walks nearby the elite and the selected antlion are calculated.
-
Step 4: The positions of the ants are updated using equations (1)–(7) and (9).
-
Step 5: The positions of the antlions are updated using equation (8).
-
Step 6: The fitnesses of the updated antlions are calculated and compared with that of the elite. If the fitness of the updated antlion is better, then it becomes the elite.
-
Step 7: Better antlions are searched employing CPSO using equations (10) and (11).
-
Step 9: Steps 3–8 are repeated until the final iteration is reached.
Flowchart of the MALO.

Validation of MALO algorithm
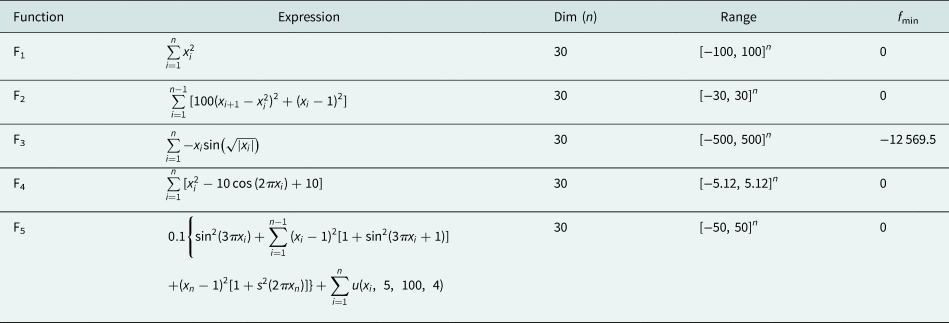
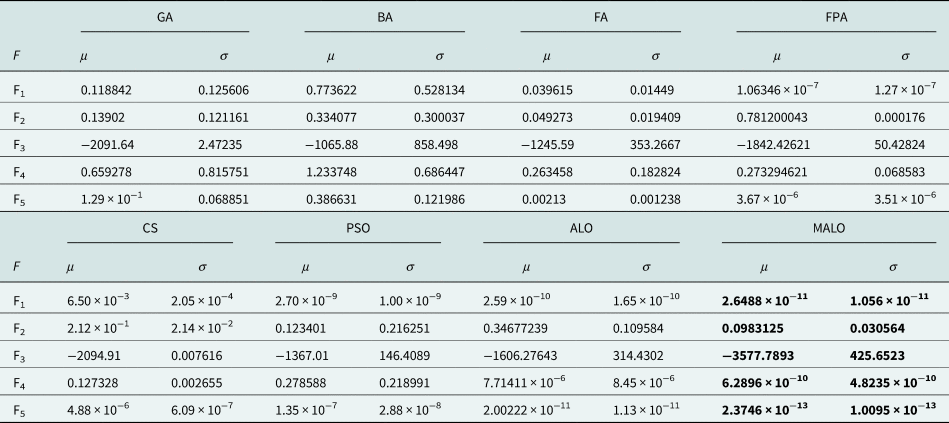
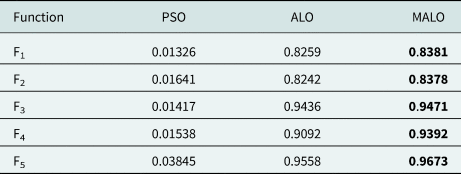
The proposed algorithm is validated by verifying its performance on five benchmark functions (two unimodal (single-peak) functions and three multimodal (multi-peak) functions). Table 1 shows the benchmark functions taken from [Reference Mirjalili43]. MALO is applied to optimize the above five functions by executing each for 30 runs with 30 dimensions and 1000 iterations per each term. Performance indices (mean and standard deviations) of the obtained minimums are computed for each function. The comparisons of the performance indices obtained using MALO and other algorithms, such as ALO, PSO, FPA, CS, FA, BA, and GA in [Reference Mirjalili43] are shown in Table 2. From the results shown in Table 2, it is worth noting that the performance of MALO is superior than other algorithms.
Benchmark functions [Reference Mirjalili43].

Mean (μ) and standard deviation (σ) of the benchmark functions and their comparison with other algorithms in [Reference Mirjalili43].

The values in bold indicate that they belong to our method.
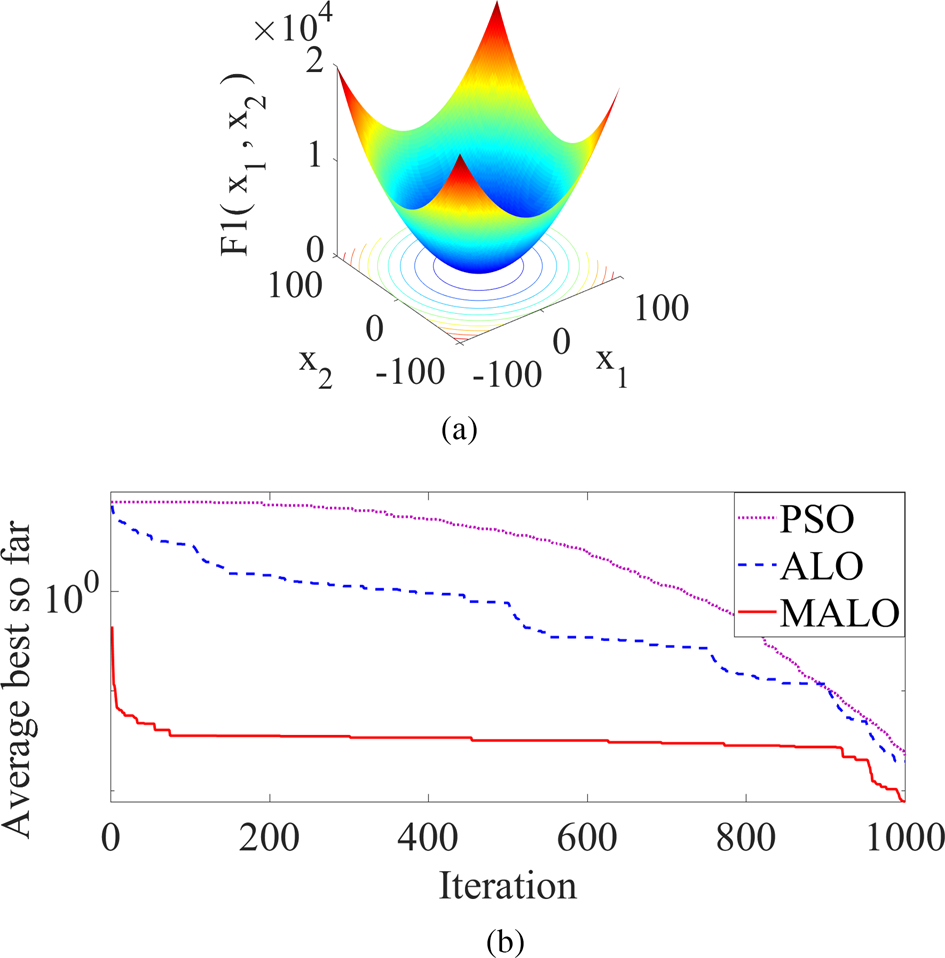
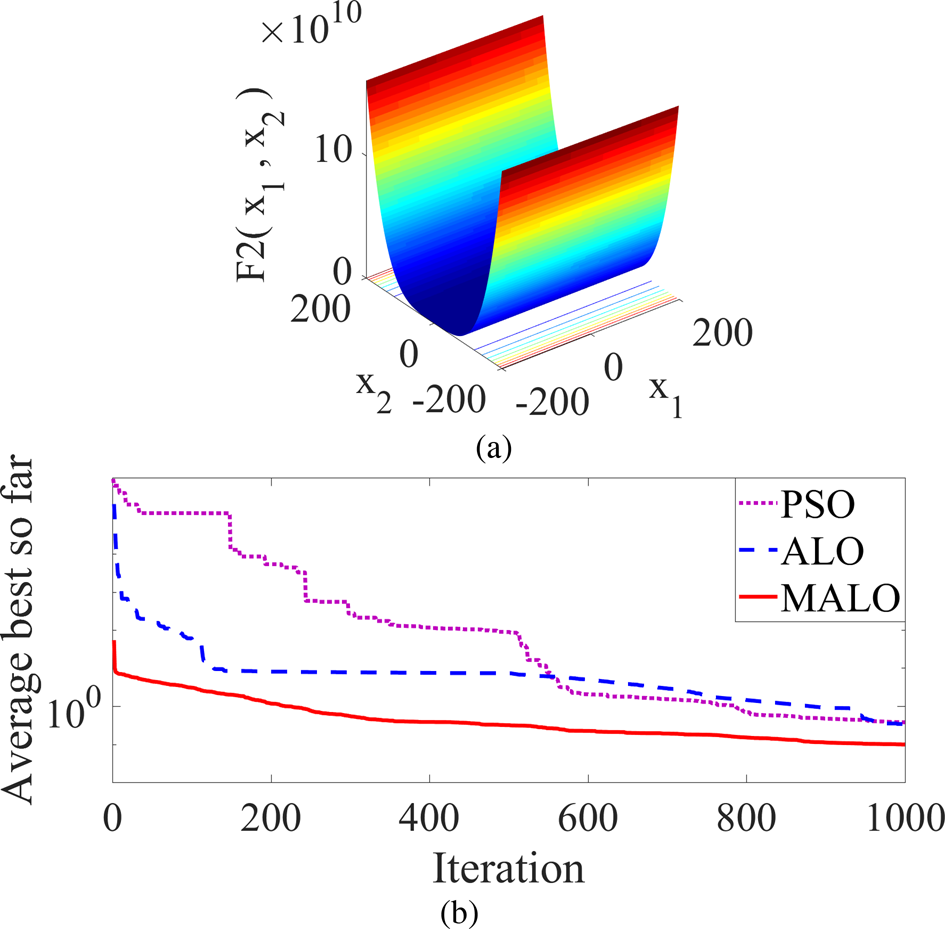
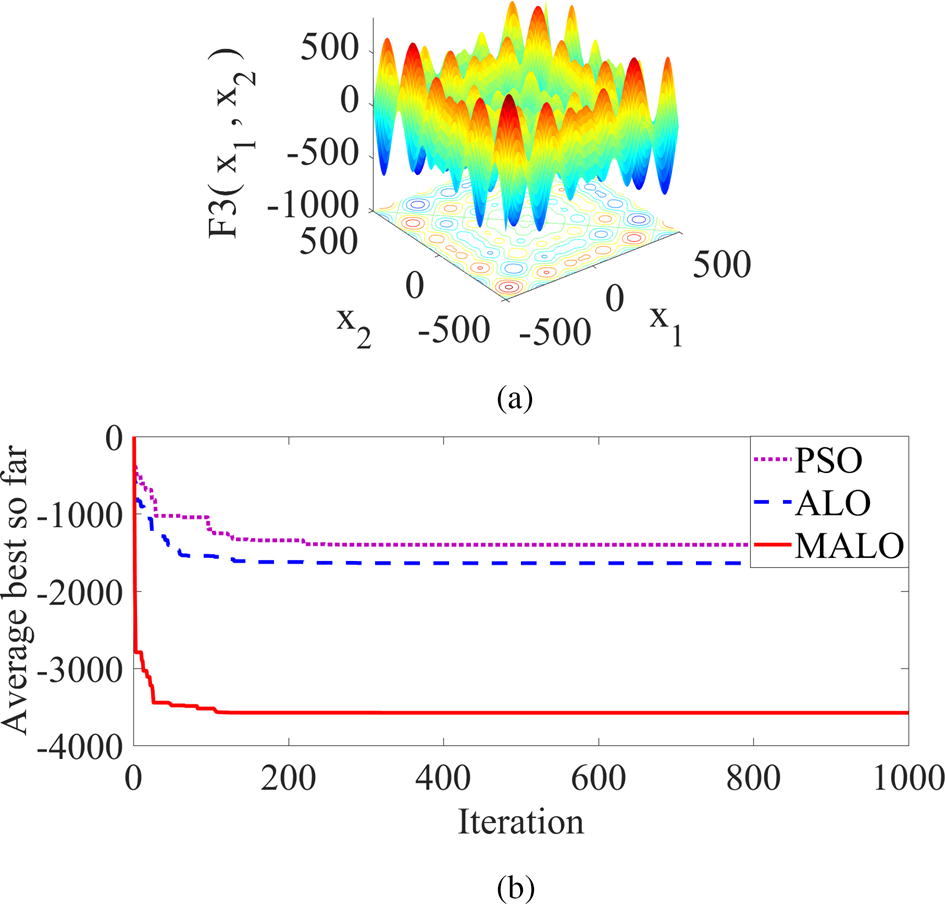
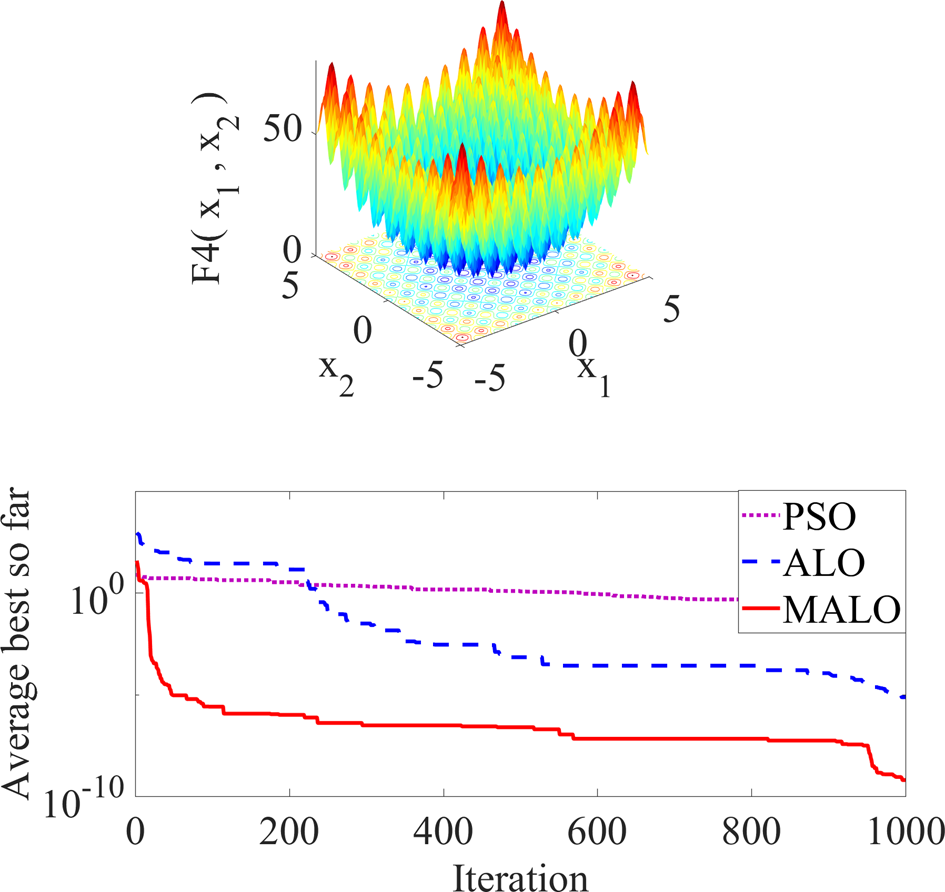
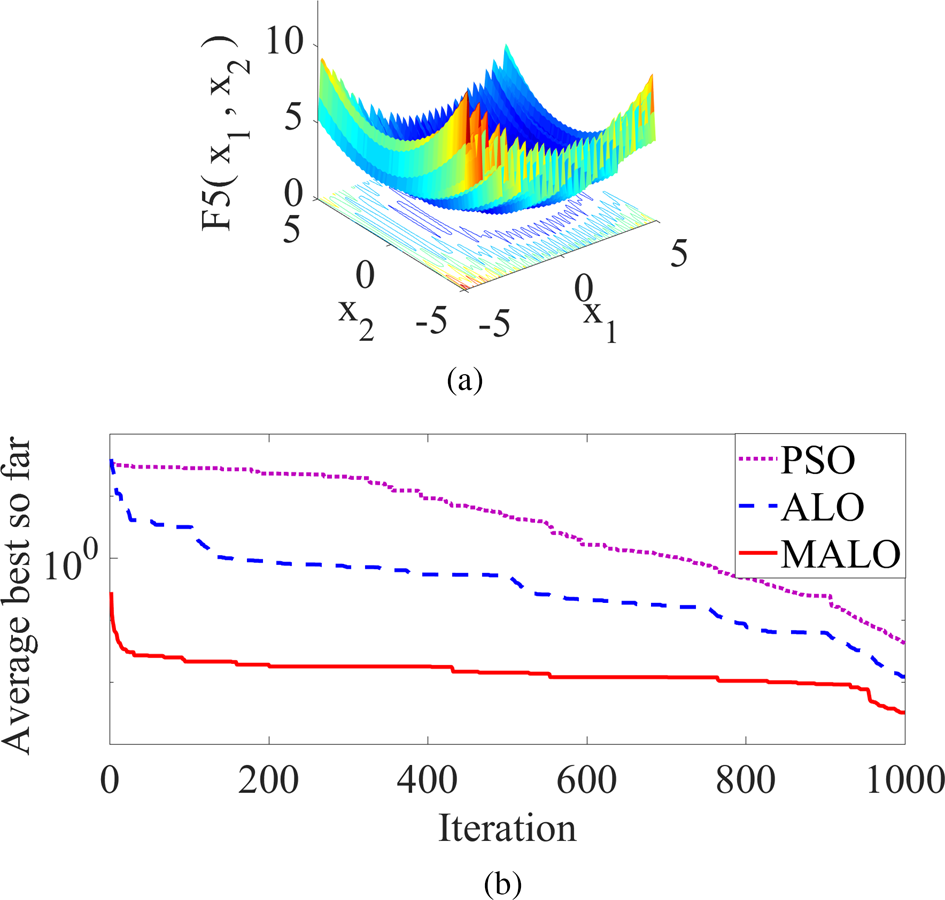
The characteristics of the benchmark functions and their resultant convergence curves are plotted in Figs 2–6. In [Reference Mirjalili43], it is observed that the performance of ALO is better than various other optimization algorithms. The performance is evaluated by comparing the convergence characteristics of ALO with that of the other algorithms. As MALO is the modification of ALO, the convergence characteristics of this are compared with that of ALO and PSO instead of all other algorithms. The comparison with other algorithms is deliberately excluded, as it is already available in [Reference Mirjalili43]. The characteristics of the two unimodal test functions F1 and F2 are shown in Figs 2 and 3, respectively. These figures depict the benefits of high exploitation behavior of MALO. High exploitation enables the MALO algorithm to converge rapidly towards the optimum. Figures 4–6 show the characteristics of the multimodal functions F3, F4, and F5, respectively. From these characteristics, it is clearly observed that the exploration ability of MALO is also high. This high level of exploring ability enables MALO to explore the desirable search domain. Due to the high level of exploration and exploitation ability of MALO the local optima or premature convergence are avoided and the global optima are attempted. Attempting the global optima by MALO can be clearly observed from the convergence curve of each benchmark function. The curve illustrates that the MALO exhibits superior convergence functionality, though the simulation time is a little longer than that of PSO. The simulation time for ALO is also longer than PSO and is closer to MALO. The time in case of MALO is longer, because of the hybridization of two algorithms. Embedding one algorithm (CPSO) to another (ALO) makes the hybrid algorithm (MALO) to some extent complex as compared to the individual one. That complexity in the new modified algorithm makes the simulation time longer. The simulation time of the algorithms PSO, ALO, and MALO for 1000 iterations is presented in Table 3. In spite of the long run time, the higher convergence functionality and ability to avoid local optima and attempting global optima makes use of the proposed MALO algorithm for antenna array synthesis and beamforming in smart antenna technology.
(a) Function F1. (b) Convergence curve of function F1.

(a) Function F2. (b) Convergence curve of function F2.

(a) Function F3. (b) Convergence curve of function F3.

(a) Function F4. (b) Convergence curve of function F4.

(a) Function F5. (b) Convergence curve of function F5.

Simulation time (min) of the algorithms for 1000 iterations: PSO, ALO, and MALO.

The values in bold indicate that they belong to our method.
Problem formulation
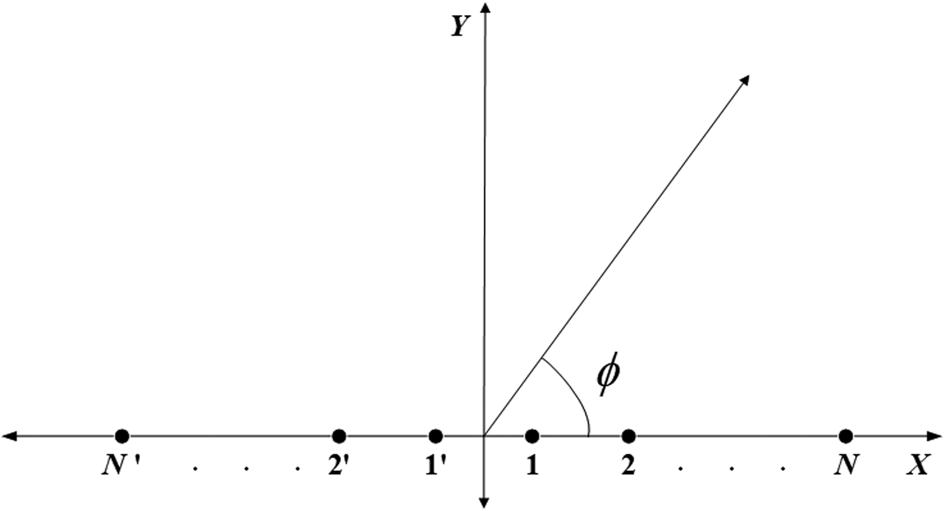
Various linear antenna arrays based on Chebyshev distribution, as shown in Fig. 7 are considered in this work. In the figure, 2N isotropic elements are located along the x-axis same as the consideration of other authors. Out of 2N, N elements are located on the right side of the origin and named as 1, 2, …, N. Similarly, other N elements are placed to the left-hand side and are assigned as 1′, 2′, …, N ′. The elements 1 and 1′ are placed at x = λ/4 on both sides of the origin. Array factor for the geometry is given by [Reference Balanis1]:

where the amplitude excitation of the nth element is I n. k is wave number and is equal to 2π/λ. Parameters x n and φn represents the position and phase excitation of the nth element, respectively.
2N elements linear array geometry.

The array factor of the Chebyshev distributed linear array is the summation of cosine terms with symmetric amplitude excitations. Each cosine term is an integer multiple of a fundamental frequency and can be rewritten as a series of cosine functions correlated to the Chebyshev polynomials. Chebyshev polynomial is denoted as T m(z) and is formulated as [Reference Balanis1]:

where m is the order of the Chebyshev polynomial, which is one less than a number of elements. z = cos(u) and u = (πx n/λ)cosϕ.
Since the excitation distribution of a Chebyshev array is symmetrical, the amplitudes of the left-hand side elements are the same as that of the right-hand side elements. Hence amplitudes of only the right-hand side elements (i.e. 1, 2, …, N) are shown in the respective tables of different design examples. MALO is implemented in the optimization of four design examples of linear arrays to optimize input parameters like amplitudes, positions, and phases of the elements. The design specifications, such as the number of elements, the input parameters, and the SLL region of each design examples are kept the same as the structures in the literature. These structures optimized with other optimization algorithms are also available in the literature. These literatures are appropriate to compare the results related to MALO with that of other optimization techniques.
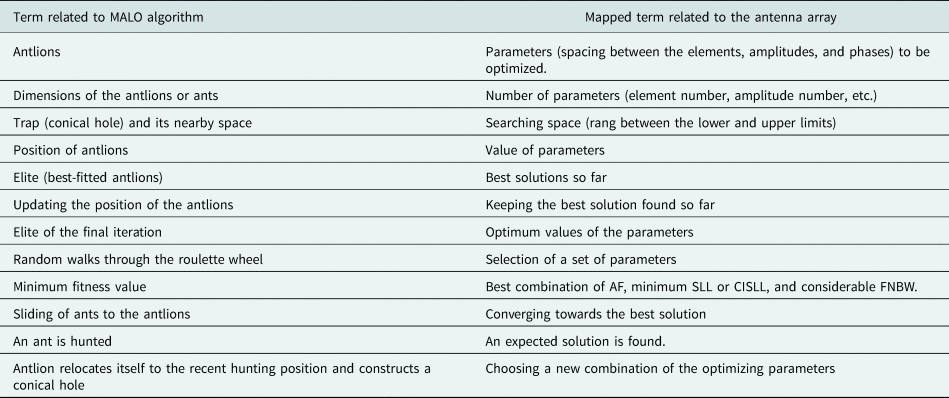
In order to have better insight into our problems, a parameter mapping between the hybrid algorithm and the array is presented in Table 4. Each array example is demonstrated using a different set of parameters. The link between these parameters and the algorithm can be easily understood from Table 4. The proposed algorithm is executed taking into account the number of search agent as 50 and the total iterations as 1000. These numbers are helpful to achieve better parameters. The optimized parameters are achieved through the appropriate positions of the antlions. The updated elite positions are found following the steps of the optimization process presented in the subsection “Modification of ALO”.
Mapping between the MALO and the array in the optimization process.

Example-I: amplitude optimization
The use of MALO for the synthesis of two linear arrays (i.e. Example-Ia: 2N = 10 elements array and Example-Ib: 2N = 16 elements array) is considered here. The objective of this example is to obtain a Chebyshev array pattern as well as the peak SLL suppression. Peak SLL in a particular region can be minimized by considering the objective function formulated as:

where max(20log|AF(ϕ)|) provides the peak SLL. Considering equation (16) as the objective function for MALO, the current amplitude excitations of the antenna elements are optimized. The search region for the current amplitudes is spread from 0 to 1. Putting the optimal values found through MALO in equation (14), AF(ϕ) for the said linear arrays with suppressed peak SLL is obtained. In this example, the positions of each element and their phases are kept fixed (i.e. x n = 0.5λ and φn = 00). The SLLs are suppressed in the regions, ϕ = [00, 760] and ϕ = [1040, 1800].
Example-II: position optimization
In this example, MALO is implemented for the optimization of the positions of the elements from the origin, as shown in Fig. 7. A 2 N =10 elements non-uniformly spaced linear array is considered as Example-IIa. It is optimized to take the same objective function in equation (16). For a uniform array of 0.5λ spaced elements the total length is 4.5λ. Therefore, the last elements' positions are fixed at 2.25λ on each side of the y-axis. The minimum spacing between two consecutive elements is taken as 0.25λ. Similar to Example-I, peak SLL suppressed AF(ϕ) is obtained by putting the optimum position values found through MALO in equation (14). Here the amplitudes of the elements and their phases are kept constant (i.e. I n = 1 and φ n = 00). The SLL regions for this example are defined by ϕ = [00, 760] and ϕ = [1040, 1800].
In a smart antenna-based communication system, there are many applications that need minimization of CISLL adjacent to the main lobe. This can also be achieved by the elements position optimization. For this, the objective function is taken as [Reference Khodier and Al-Aqeel13]:

where ϕ AS are the SLL regions the same as Example-IIa defined by $\{ {[ {0{\rm^\circ }, \;{\rm \;}76{\rm^\circ }} ] \;{\rm and}\;[ {104{\rm^\circ }, \;{\rm \;}180{\rm^\circ }} ] } \}$ . ϕ NS represents the CISLL region, $\{ {[ {69{\rm^\circ }, \;{\rm \;}76{\rm^\circ }} ] \;\;{\rm and}\;[ {104{\rm^\circ }, \;{\rm \;}111{\rm^\circ }} ] } \}$
 . ∝1 and ∝ 2 are constants with values 1 and 2, respectively.
Keeping the same conventions, the 10-elements linear array is again optimized to take the objective function as in equation (17) to realize the CISLL suppressed AF(ϕ). This is referred to as Example-IIb.
Example-III: phase optimization for beam steering
Nowadays, wireless and mobile technologies are widely applied in various wireless monitoring applications. Some of the wireless monitoring applications are water level and its quality monitoring, health monitoring of bridge pillar, building wall structures [Reference Castorina, Donato, Morabito, Isernia and Sorbello47, Reference Mauro, Castorina, Morabito, Donato and Sorbello48]. These wireless monitoring applications include a set of omnidirectional and directional antenna systems. The omnidirectional antenna transmits information to the distant terminal units. The directional antenna system collects the data from the antennas embedded in different places on the concrete structures. The antenna system adopts the beam-steering process for the data collection from the remote embedded antennas. Beam steering is the procedure of guiding an antenna array's main beam towards a specific direction.
Beam-steering application by the implementation of MALO in the linear array is demonstrated in this example. The simplest method of achieving beam steering for a linear array is through the optimization of phases of the elements. The positions of the elements and their amplitudes are kept fixed (i.e. x n = 0.5λ and I n = 1). Keeping the phase of the first element fixed at 0° as a reference, optimal phases for rest of the elements are found by MALO and considering the AF(ϕ) as [Reference Khodier and Al-Aqeel13]:

The SLL regions are defined by $\phi = [ {0{\rm^\circ }, \;\;{( {\phi_s-( {\Delta \phi_s/2} ) } ) }^0} ]$ and $\phi = [ {{( {\phi_s + ( {\Delta \phi_s/2} ) } ) }^0, \;\;180{\rm^\circ }} ]$
 . ϕ s represents the steering angle and it lies in the band Δϕ s. In this example, phases of a 20-elements linear array are optimized for steering angle ϕ s = 45° and the band of steering angle Δϕ s = 14°. The AF(ϕ), as in equation (18) with reduced SLL is obtained by putting the optimum phase values found applying MALO.
Example-IV: beam steering and null positioning by simultaneous optimization of amplitude and phase
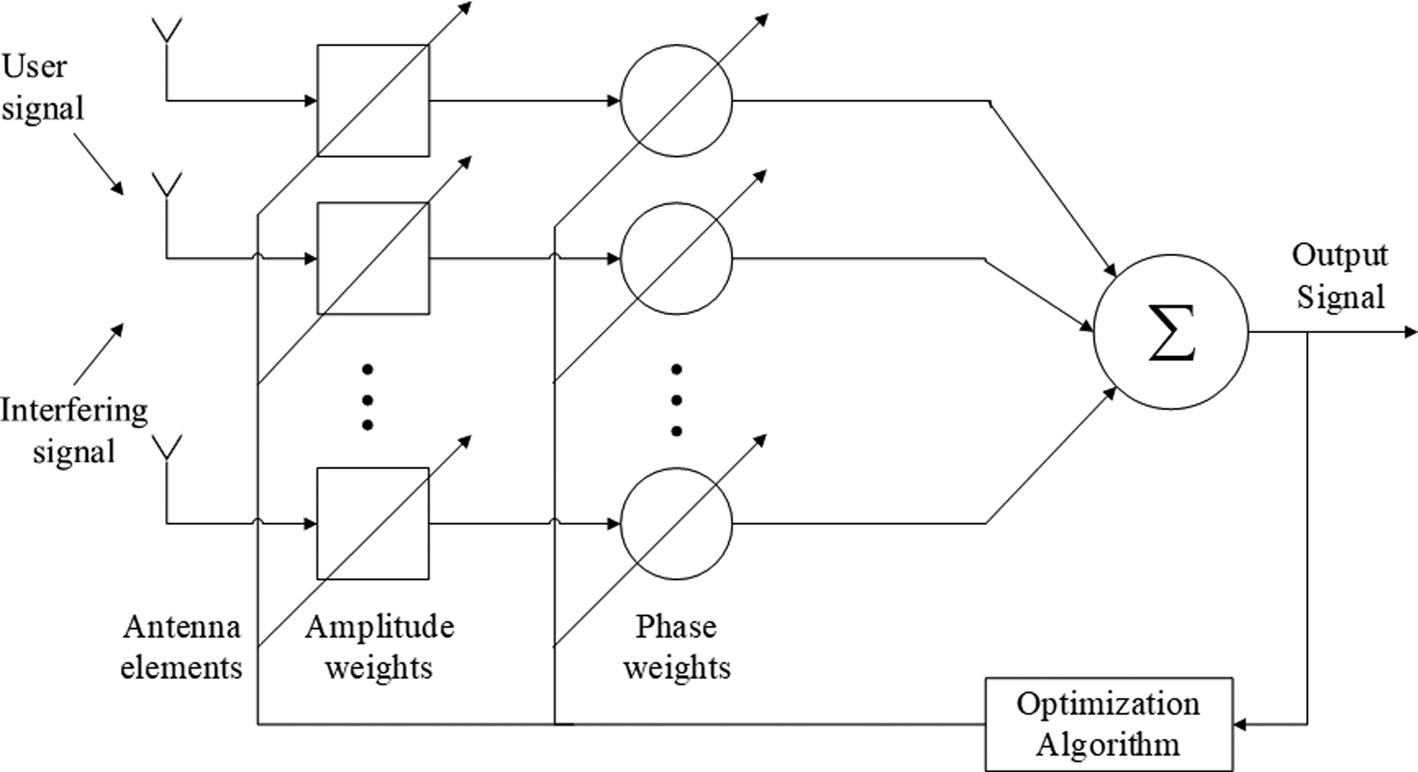
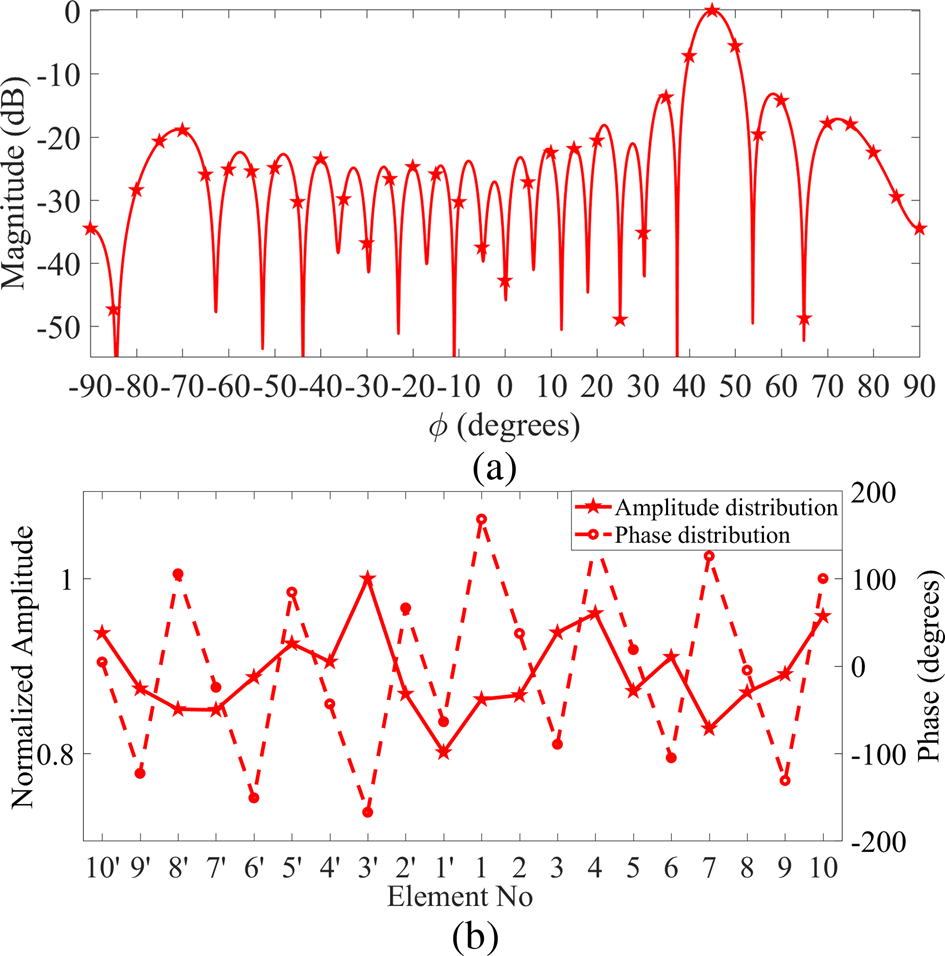
In this example, MALO is employed for simultaneous optimization of amplitude and phase for smart antenna technology. The smart antenna application involves steering the main beam along with null positioning in the specific directions. The steering angle is characterized as the direction of the SOI angle, and the angles of nulls are characterized as SNOI angles. The beamforming here is achieved by an adaptive process. Figure 8 shows the block diagram of an adaptive array. Elements of antenna array receive the combined signal of subscriber's signal at the SOI angle and the interfering signals at SNOI angles. The combined signal is then multiplied with a complex-valued weight having the elements amplitude weights and the phase weights. These amplitude and phase weights are optimized in order to obtain the optimum output signal. Considering the self-developed MATLAB code, the main beam of the radiation pattern is directed at any specific SOI angle along with the placement of one or more nulls at any SNOI angles. In this section, a 20-elements array is considered to steer the main beam at the SOI angle ϕ s = 45° and nulls at SNOI angles ϕ nl1 = 25° and ϕ nl2 = 65°. The AF(ϕ) with reduced SLL is obtained by the optimum amplitude and phase excitations values found applying MALO. AF(ϕ) for this case is formulated as [Reference Balanis1]:

where w n is the complex weight of the nth element expressed as a nexp(jb n). The amplitude weight of the nth element is a n, and b n is its phase weight.
Adaptive antenna array geometry.

Results and discussion
MALO is implemented in four examples of linear arrays to optimize element amplitudes, positions, and phases of the elements either in single or in combined form. The optimized parameters provide various outcomes such as suppression of peak SLL and CISLL, beam steering, and beam steering, along with null positioning. The obtained outcomes are compared with that of the conventional uniform arrays and with the previous works, such as ACO, PSO, Taguchi, SMO, SBA, BBO, CSO, SOS, ALO, and MFO. The comparisons are made considering assumptions like isotropic elements, the same parameter specifications, and without a constant first null beamwidth (FNBW) as in the previous works.
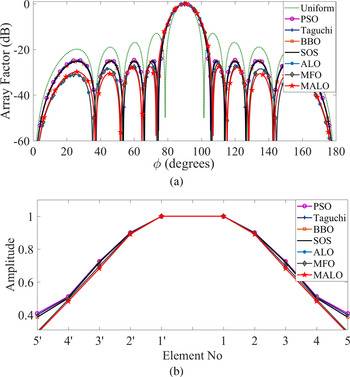
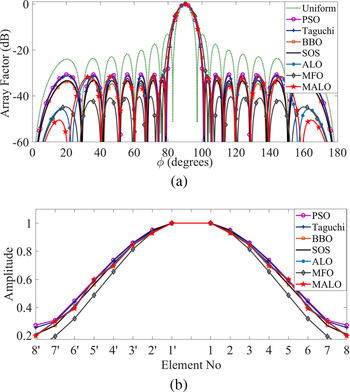
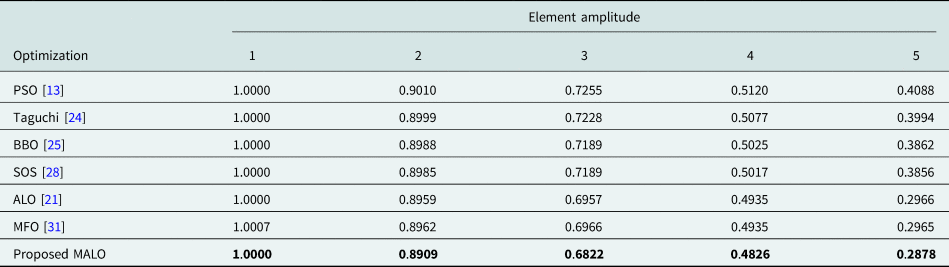
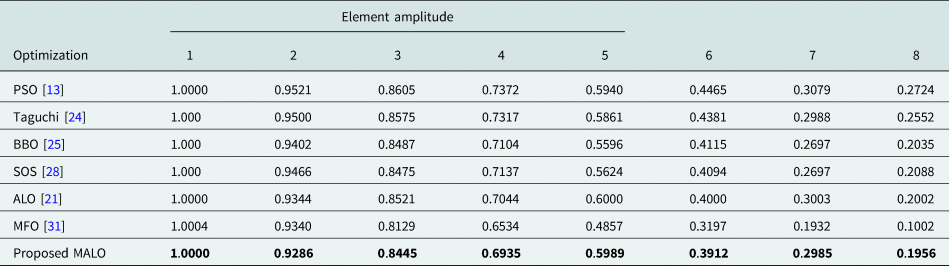
The optimal amplitudes of current for design Examples-Ia and Ib are shown in Tables 5 and 6, respectively. Figure 9(a) presents the optimized radiation pattern of the design Example-Ia. It shows that all the algorithms provide nearly the same FNBWs. The FNBWs are greater than that of the uniform array. In spite of this, the peak SLL can be better suppressed by the use of optimization algorithms. The peak SLL of −27.6 dB is achieved by using MALO. The peak SLL of uniform array, PSO [Reference Khodier and Al-Aqeel13], Taguchi [Reference Dib, Goudos and Muhsen24], BBO [Reference Sharaqa and Dib25], SOS [Reference Dib28], ALO [Reference Saxena and Kothari21], and MFO [Reference Das, Mandal, Ghoshal and Kar31] is 14.63, 2.9783, 2.73, 2.39, 2.32, and 1.52 dB higher than that compared to MALO, respectively. MALO provides the highest peak SLL suppression, taking into account the same parameter specifications such as a number of elements, amplitude excitation, and SLL region. This result is summarized in Table 7. The amplitude distributions of the array elements of the design Example-Ia are shown in Fig. 9(b). From this figure, it is noted that the amplitudes of the current decrease from the central element to the outermost element. Hence power dividers can be easily used for such amplitude distribution. It also provides the information that by using MALO, peak SLL is better suppressed even with smaller amplitudes. Similarly, the radiation pattern and the corresponding amplitude distribution for design Example-Ib are illustrated in Figs 10(a) and 10(b), respectively. From Fig. 10(a), it can be noticed that the FNBW of MFO is greater than that of other algorithms. Here also the optimization algorithms except MFO provide nearly the same FNBW. Peak SLL achieved using MALO for this case is −31.6 dB. Uniform array, PSO [Reference Khodier and Al-Aqeel13], Taguchi [Reference Dib, Goudos and Muhsen24], and ALO [Reference Saxena and Kothari21] provide peak SLLs of 18.45, 0.97, 0.39, and 0.75 dB higher than that compared to MALO, respectively. The peak SLL of MALO is 1.46, 8.65 and 1.79 dB higher than that of BBO [Reference Sharaqa and Dib25], MFO [Reference Das, Mandal, Ghoshal and Kar31], and SOS [Reference Dib28], respectively. The MFO displays a better SLL peak suppression, but it reveals a higher half-power beamwidth (HPBW) than other methods. Higher HPBW is not desirable in smart antenna beam-steering applications. This is because a higher HPBW represents a wider main beam and hence the lower directive radiation pattern. In our case, the MALO provides the highest peak SLL suppression, considering the equal HPBW. The findings of the design Example-Ib are also outlined in Table 7.
(a) Radiation pattern of Example-Ia. (b) Amplitude distribution of Example-Ia.

(a) Radiation pattern of Example-Ib. (b) Amplitude distribution of Example-Ib.

Optimal amplitudes of current for Example-Ia.

The values in bold indicate that they belong to our method.
Optimal amplitudes of current for Example-Ib.

The values in bold indicate that they belong to our method.
Peak SLL (dB) of Example-I.

The values in bold indicate that they belong to our method.
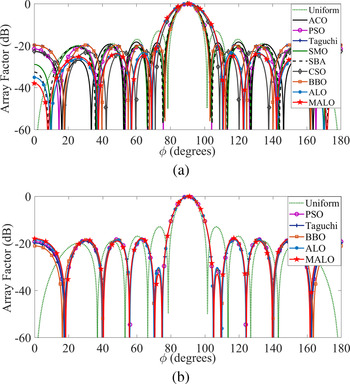
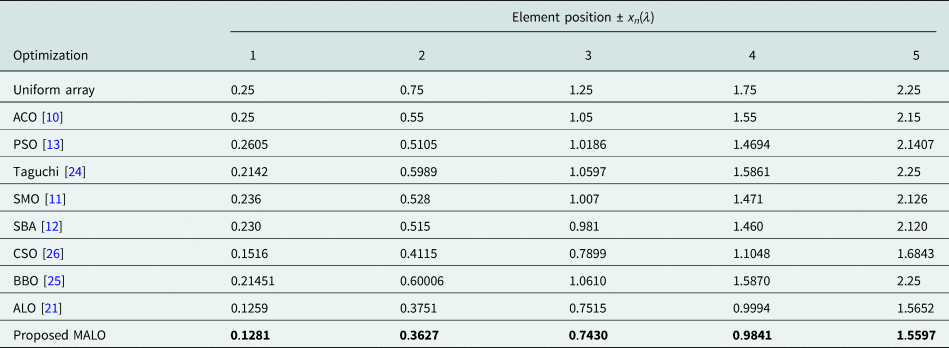
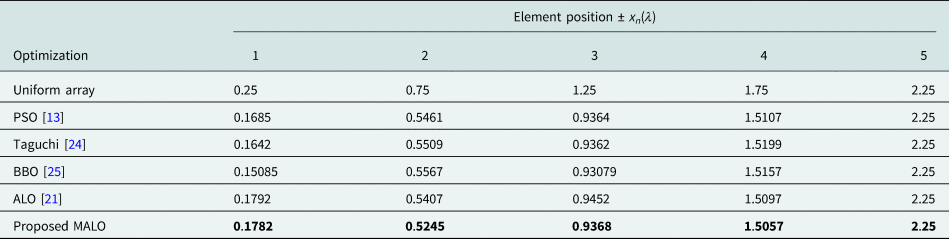
The optimum position values obtained for design Examples-II are presented in Tables 8 and 9. Table 8 depicts the optimal positions of Example-IIa. Figure 11(a) illustrates the radiation pattern of the Example-IIa, in which reduction of peak SLL is presented. From Fig. 11(a), it can be observed that the CSO, ALO, and MALO provide higher FNBW. BBO provides the smallest FNBW. In spite of this, all the algorithms offer peak SLL suppression. The SLL suppression using all algorithms by optimizing position is lower than that by amplitude optimization. For this example, the peak SLL achieved by MALO is −24.69 dB which is 11.72, 2.03, 3.97, 6.61, 4.44, 1.96, 1.80, 4.99, and 1.40 dB lower than that compared to uniform array, ACO [Reference Khodier and Al-Aqeel13], PSO [Reference Khodier and Al-Aqeel13], Taguchi [Reference Dib, Goudos and Muhsen24], SMO [Reference Khodier and Saleh14], SBA [Reference Subhashini12], CSO [Reference Pappula and Ghosh26], BBO [Reference Sharaqa and Dib25], and ALO [Reference Saxena and Kothari21], respectively. It implies that the MALO among other algorithms has the best peak SLL suppression. The radiation pattern of design Example-IIb is shown in Fig. 11(b). The figure shows that CISLL suppression, a very demanding feature can be achieved by position optimization. Here, uniform array, the array optimized employing PSO [Reference Khodier and Al-Aqeel13], Taguchi [Reference Dib, Goudos and Muhsen24], BBO [Reference Sharaqa and Dib25], ALO [Reference Saxena and Kothari21], and MALO reveals the peak SLL of −12.97, −18.31, −18.08, −18.14, −18.5, and −18.01 dB, respectively. The corresponding CISLL value, utilizing MALO is −33.13 dB. This CISLL is 20.16, 2.13, 2.89, 2.69, and 2.11 dB lesser than that of uniform array, PSO [Reference Khodier and Al-Aqeel13], ALO [Reference Saxena and Kothari21], Taguchi [Reference Dib, Goudos and Muhsen24], and BBO [Reference Sharaqa and Dib25], respectively. The MALO provides the highest CISLL suppression among other algorithms. The FNBWs offered by the algorithms are nearly identical. ACO [Reference Khodier and Al-Aqeel13], SMO [Reference Khodier and Saleh14], SBA [Reference Subhashini12], and CSO [Reference Pappula and Ghosh26] are applied only for the position optimization of Example-IIa (i.e. peak SLL suppression) and not for Example-IIb (i.e. CISLL suppression). Table 10 shows the summarized results of Examples-IIa and IIb.
(a) Radiation pattern of Example-IIa. (b) Radiation pattern of Example-IIb.

Optimal positions of elements for Example-IIa.

The values in bold indicate that they belong to our method.
Optimal positions of elements for Example-IIb.

The values in bold indicate that they belong to our method.
Peak SLL (dB), and CISLL (dB) for Example-II.

The values in bold indicate that they belong to our method.
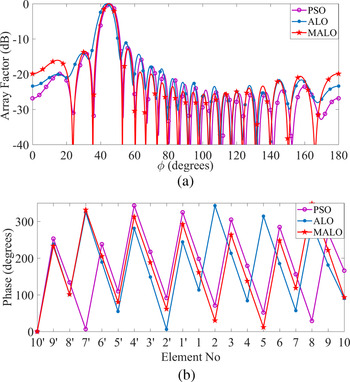
Example-III illustrates primarily the steering of the main beam along with SLL suppression by the optimization of only the excitation phases of the antenna elements. The optimal phases for beam steering in design Example-III are presented in Table 11. Figure 12 displays the respective radiation pattern and the plots of phase distribution. The radiation pattern using MALO in Fig. 12(a) is nearly the same as that of PSO. But the null depths in case of MALO are more than that of PSO. The main beam steering by MALO towards the desired angle 45° is superior than ALO and PSO. This can be explicitly observed with the expansion of the radiation pattern. The peak SLL obtained here is −12.84 dB. Although the peak SLL suppression here is not much better, still it is 0.5 and 1.7 dB lower than PSO [Reference Khodier and Al-Aqeel13] and ALO [Reference Saxena and Kothari21], respectively. This analysis is summarized in Table 12.
(a) Radiation pattern of Example-III. (b) Phase distribution of Example-III.

Optimal phases of elements for Example-III.

The values in bold indicate that they belong to our method.
Peak SLL (dB) of Example-III.

The values in bold indicate that they belong to our method.
In the literature, the authors have focused on either beam steering or null positioning applications. One of the most important features of simultaneous beam steering and null positioning for smart antenna application is proposed in Example-IV. The coinciding of beam steering and null positioning is achieved by optimizing the element amplitude weights and phase weights. Optimal normalized amplitude weights and phase weights of the elements are obtained by the application of MALO and are presented in Table 13. The normalized amplitude weight of an element is computed by dividing its amplitude weight by the maximum weight among all the weights of the elements. The corresponding radiation pattern for the angles $\phi = [ {-90{\rm^\circ }, \;\;90{\rm^\circ }} ]$ is depicted in Fig. 13(a). This demonstrates that the main beam of the radiation pattern is directed towards the SOI angle ϕ s = 45° and nulls at SNOI angles ϕ nl1 = 25° and ϕ nl2 = 65°. Null depths of −48.93 and −52.29 dB are achieved for the nulls at 25° and 65°, respectively. The peak SLL achieved for this example is −13.184 dB. Both the normalized amplitude and phase distribution plots are presented in Fig. 13(b). This example is a new approach in the field of antenna technology. Thus, no comparison with other algorithms could be established.
(a) Radiation pattern of Example-IV. (b) Normalized amplitude and Phase distribution of design Example-IV.

Optimal normalized amplitude and phase weights of elements for Example-IV.

Conclusion
This article proposed the hybrid algorithm MALO successfully. MALO is validated by verifying its performance on five popular benchmark functions. The effectiveness of MALO is compared with other widely used optimization algorithms, such as ALO, PSO, CS, FPA, FA, BA, and GA. Considering the results, it is concluded that MALO being a potential optimization algorithm can be effectively used to solve many engineering optimization problems.
The amplitudes, positions, and phases of Chebyshev-based linear array are successfully optimized, employing MALO. The proposed algorithm is applied to optimize single or multiple design parameters at a time for obtaining optimal arrays. In all the examples, the MALO provides a considerable reduction in peak SLL. Higher peak SLL suppression is achieved in Example-I when the amplitude optimization is considered. Example-II illustrates the suppression of CISLL for specific applications by optimizing the positions between the elements. Beam steering meant for mobile and other wireless applications like environmental monitoring system are successfully presented in Example-III. The amplitude and phase excitations of the antenna elements are simultaneously optimized to achieve the beam steering in the desired direction. The design Example-IV presents a new direction of effort in the field of smart antenna technology. This design example discusses both beam steering and null positioning in contrast to only beam steering or null positioning by other researchers. The beam steering is carried out along the SOI angle ϕ s = 45° and nulls at SNOI angles ϕ nl1 = 25° and ϕ nl2 = 65°. The results obtained by implementing MALO are compared with that of conventional uniform arrays and the arrays optimized using algorithms, such as ACO, PSO, Taguchi, SMO, SBA, BBO, CSO, SOS, ALO, and MFO. The comparisons depict that the MALO-based array designs provide better performance.
MALO is employed in the optimization of four different design examples to motivate the antenna design community. In addition, MALO may be used to optimize certain antenna geometries like microstrip, conformal, and fractal. Configurations like planar, circular, elliptical, or hexagonal arrays may also be considered for optimization using MALO. This is because, the provided results such as SLL minimization, beam steering and null positioning along specific directions are also valid for the above configurations. It may be a useful extended approach to evaluate the effectiveness of MALO by optimizing specifically the array structures generating shaped beam like flat-top, isoflux, or cosecant beam patterns.
Acknowledgements
We hereby acknowledge the TEQIP-III of VSSUT, Burla for its continuous encouragement to our research work.
 Hrudananda Pradhan received the B.E. degree in Electronics and Telecommunication Engineering from the Veer Surendra Sai University of Technology (VSSUT), Burla, India, in 2006. He received his M.Tech. degree in Communication System Engineering from National Institute of Technology Rourkela, Odisha, India in 2009. He is currently working as an Assistant Professor and also pursuing his Ph.D. degree in the Department of Electronics and Telecommunication Engineering at VSSUT, Burla. He is a member of Indian Society for Technical Education. His main research interests are the design and optimization of linear and planar antennas, and reconfigurable antennas.
 Biswa Binayak Mangaraj received the B.E. degree in Electronics and Telecommunication Engineering from the Sambalpur University, Burla, Odisha, India, in 1994 and the M.E. and Ph.D. degrees in Microwave Engineering from the Jadavpur University, Kolkata, India, in 2003 and 2012, respectively. He is currently working as an Associate Professor at Veer Surendra Sai University of Technology, Burla, India. He is a member of Indian Society for Technical Education and Institution of Electronics and Telecommunication Engineers. He has published 30 international journal papers and several international conference papers. His current research interests include computational electromagnetics, analysis, design, and coding of different antenna structures and optimization of antenna parameters using optimization algorithms.
 Santanu Kumar Behera (SM’15) received the B.Sc.(Engg.) degree from the Veer Surendra Sai University of Technology, Burla, India, in 1990, and the M.E. and Ph.D.(Engg.) degrees from the Jadavpur University, Kolkata, India, in 2001 and 2008, respectively. He is currently a Professor and Head of the Department of Electronics and Communication Engineering, National Institute of Technology Rourkela, Odisha, India. His current research interests include planar antennas, dielectric resonator antennas, reconfigurable planar antennas, bio-electromagnetics, and RFID tags & reader antennas.