Dyslipidaemia is defined as elevated plasma levels of total cholesterol, LDL-cholesterol, TAG or reduced HDL-cholesterol, either individually or in combination(1,2) . According to WHO estimates, the global prevalence of elevated total cholesterol levels among adults aged 25 years and older reached 39 % in 2008(3). It is reported that 33·8 % of adults in China suffer from dyslipidaemia, a condition that tends to deteriorate gradually with advancing age(Reference Lu, Zhang and Lu4). While genome-wide association studies have identified multiple genetic loci linked to dyslipidaemia (indicating its polygenic basis)(Reference Willer, Schmidt and Sengupta5,Reference Teslovich, Musunuru and Smith6) , the majority of cases are secondary to metabolic disorders such as diabetes and obesity or unhealthy lifestyles. With rapid socio-economic growth and shifts in dietary behaviours, coupled with the escalating prevalence of unhealthy lifestyles, the global prevalence rate of dyslipidaemia significantly increased, especially in developing countries(Reference Pirillo, Casula and Olmastroni7). Dyslipidaemia is known to be an independent risk factor for CHD and ischaemic stroke(8). CVD, such as hypertension, diabetes and CHD, which are associated with dyslipidaemia, threaten people’s health and increase economic and medical burdens. A projection for China indicates that effective management of key risk factors (blood pressure and lipid levels) could prevent 10–20 million deaths from acute myocardial infarction, 8–30 million deaths from stroke and 3–10 million deaths from CVD between 2016 and 2030, generating net social benefits of up to $932 billion(Reference Stevens, Peneva and Li9).
The occurrence and progression of dyslipidaemia can trigger the inflammatory response and increase the expression level of various inflammatory factors, such as TNF-α, C-reactive protein and IL-6(Reference Papapanagiotou, Siasos and Kassi10). As an important multifunctional cytokine, TNF-α plays important roles in inflammatory reactions and energy metabolism(Reference Papapanagiotou, Siasos and Kassi10). While dyslipidaemia is recognised as a polygenic disorder, inflammatory pathways mediated by cytokines such as TNF-α may independently influence lipid metabolism(Reference Hotamisligil11). Furthermore, polymorphisms in the TNF-α promoter region could serve as modulators of such effects(Reference Skoog, Eriksson and Hoffstedt12). However, little research has delved into the relationship between the TNF-α gene SNP and dyslipidaemia. TNF-α –1031T/C, –863C/A, –857C/T, –308G/A and –238G/A are the most concerned variants. The TNF-α-1031T/C polymorphism has been reported to be associated with acute coronary syndrome(Reference Sandoval-Pinto, Padilla-Gutiérrez and Valdés-Alvarado13), while the TNF-α-863C/A polymorphism is linked to type 2 diabetes mellitus(Reference Kallel, Ftouhi and Jemaa14). Furthermore, meta-analyses confirm that the –308G/A polymorphism is associated with an increased risk of type 2 diabetes and ischaemic stroke(Reference Guo, Li and Wu15,Reference Cui, Wang and Li16) . In obesity-related phenotypes, the TNF-α-238G > A polymorphism demonstrates associations with overweight/obesity susceptibility in South African Black women(Reference Joffe, van der Merwe and Evans17) and Korean populations(Reference Yu, Ha and Park18). Additionally, the –857C/T polymorphism exhibits dual functional effects: the C allele confers a protective role on HDL-cholesterol levels in the general Korean population(Reference Yu, Ha and Park18), whereas the T allele is implicated in heightened susceptibility to intracerebral haemorrhage among males(Reference Park, Kim and Park19).
The impact of TNF-α SNP on dyslipidaemia remains inconclusive. Therefore, this case–control study was conducted to investigate the associations between TNF-α SNP and dyslipidaemia in the Chaoshan region of Guangdong Province, with further exploration of potential mechanisms.
Methods
Study population
The study population was collected from the physical examination centre of the First Affiliated Hospital of Shantou University Medical College from July 2020 to July 2021. The subjects analysed in this study were permanent residents of the Chaoshan area. The Ethics Committee of the First Affiliated Hospital of Shantou University Medical College approved the study (approval no. 2018080). All of the subjects had known and signed the consent form. Demographic and clinical data such as age, sex, BMI, blood pressure (systolic and diastolic blood pressure), alanine aminotransferase, aspartate aminotransferase, glutamyl transpeptidase, alkaline phosphatase, cholesterol, TAG, LDL-cholesterol, HDL-cholesterol, uric acid and fasting blood glucose (FBG) were collected.
Dyslipidaemia was defined following the Third Report of the National Cholesterol Education Program Expert Panel on Detection, Evaluation, and Treatment of High Blood Cholesterol in Adults final report (NCEP-ATP III)(2), consistent with the 2016 Chinese guidelines for its prevention and management in adults(1). To be specific, it was defined by the presence of one or a combination of items as follows: (1) TAG ≥ 2·26 mmol/l; (2) cholesterol ≥ 6·22 mmol/l; (3) HDL-cholesterol < 1·04 mmol/l; (4) LDL-cholesterol ≥ 4·14 mmol/l; (5) taking lipid-lowering drugs. Subjects who met all of the following criteria served as controls: no dyslipidaemia, no history of lipid-lowering drug use, absence of serious chronic diseases and no clinically significant abnormalities on physical examination. Subjects were excluded if they met any of the following criteria: use of other drugs affecting lipid metabolism, incomplete data, diagnosis of malignant tumours, chronic consumptive diseases, autoimmune diseases, neurological or psychiatric diseases, hereditary diseases or other clinically significant comorbidities.
Blood collection and blood chemistry testing
After an 8-h overnight fast, venous peripheral blood was collected from each participant using EDTA anticoagulant tubes and standard biochemical tubes, respectively. Blood samples collected in EDTA anticoagulant tubes were stored in an ultra-low temperature freezer at −80℃ for subsequent DNA extraction. Meanwhile, blood collected in regular biochemical tubes was utilised for the measurement of serum biochemical indicators, including TAG, cholesterol, HDL-cholesterol, LDL-cholesterol, liver function markers (glutamyl transpeptidase, alkaline phosphatase, aspartate aminotransferase, alanine aminotransferase), kidney function markers (creatinine, uric acid) and FBG. All biochemical assays were uniformly performed by professionals from the physical examination centre.
Detection of TNF-α SNP
DNA was extracted using the HiPure Tissue DNA Mini Kit (Magen BioSciences D3121), a highly efficient DNA extraction kit that rapidly extracts high-quality genomic DNA from biological tissue samples through the steps of tissue cell lysis, impurity removal and DNA purification. The extracted DNA was stored at −20℃ for further analysis. PCR and Sanger sequencing were then used to detect and genotype five promoter polymorphisms of TNF-α. Specifically, the SNP of TNF-α that were analysed included −1031T > C, −863C > A, −857C > T, −308G > A and −238G > A. The primers used for genotyping are listed in online Supplementary Table S1. The PCR reaction mix was prepared on ice, consisting of PrimeSTAR Max Premix (2X) (12·5 μl), upstream and downstream primers (0·5 μl each), DNA template (2 μl) and ddH₂O (25 μl). Amplification was performed using a PCR machine, following a protocol that involved: denaturation at 98℃ for 10 s, annealing at 55℃ for 5 s and extension at 72℃ for 5 s; this denaturation-annealing-extension cycle was repeated thirty-five times. A 1·5 % agarose gel was prepared using Tris-Acetate-EDTA buffer, and electrophoresis of the PCR amplification products was conducted at a voltage of 130 V for 25 min with a sample loading volume of 5 μl. Sanger sequencing was performed on PCR products with band sizes that meet the expected criteria.
Gene functional annotation and pathway enrichment analysis
PROMO(Reference Messeguer, Escudero and Farré20,Reference Farré, Roset and Huerta21) (version 8.3 of TRANSFAC) was used for predicting the possible transcription factors in the TNF-α gene promoter region. Metascape, which integrates lots of database resources such as GO/KEGG, hallmark gene set and others, was used for pathway enrichment analysis(Reference Zhou, Zhou and Pache22). In this study, functional pathways enriched with a P value < 0·05 and a gene count ≥ 3 were considered as significantly enriched pathways. Additionally, to enhance visualisation and focus core findings of the results, the study shows only the top 20 significantly enriched pathways with the smallest P values.
Statistical analyses
SPSS 26.0 (IBM Corp©2010) was used for processing related data. Haploview 4·2 was used for SNP analysis, including pairwise linkage disequilibrium, haplotype structure and association analysis. Continuous variables with a normal distribution were denoted by mean (standard deviation (sd)) and compared using Student t test or ANOVA. Skewed distribution data were denoted by median (quartile spacing) and compared using the nonparametric rank sum test. Categorical variables were denoted by frequencies with percentages and compared using the χ 2 or Fisher’s exact test.
Genotypic frequencies in cases and controls were tested for departure from Hardy–Weinberg equilibrium (HWE). Due to sample size constraints, the recessive genotypes were pooled with heterozygotes, and all analyses were tested with the dominant model. OR with their respective 95 % CI for disease susceptibility were calculated. In addition, the adjusted OR with 95 % CI from binary logistic regression were also used to assess the relationship between TNF-α SNP and dyslipidaemia. Covariates used for adjustment included age, sex, BMI, blood pressure, liver enzymes, creatinine, uric acid and FBG. Subgroup analyses stratified by sex were performed. Two-tailed P values were employed, with statistical significance set at P < 0·05. To control for multiple testing, the false discovery rate (FDR) was calculated separately for genotype and allele association tests using the Benjamini-Hochberg method. Results with P FDR < 0·05 were considered statistically significant after FDR correction. What’s more, the post hoc statistical power analysis of the χ 2 test was conducted using the tool of G * Power (3.1.9.7 version)(Reference Faul, Erdfelder and Lang23), with a statistical power of ≥ 0·8 as the criterion for sufficient sample size.
Results
General characteristics of the subjects
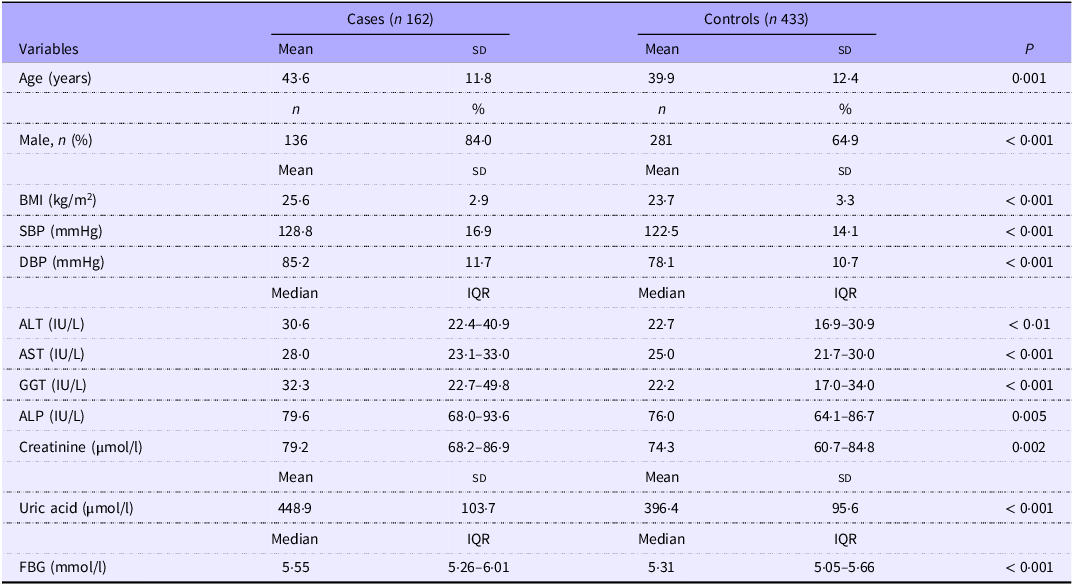
A total of 595 subjects were included in this study for analysis, comprising 433 controls and 162 subjects with dyslipidaemia. The baseline information and clinical characteristics of the two groups are presented in Table 1. The mean (sd) age of the dyslipidemic subjects was 43·6 (sd 11·8) years, while that of the controls was 39·9 (sd 12·4) years. The sex distribution of males in the dyslipidaemia group and control group was 136/162 (84·0 %) and 281/433 (64·9 %), respectively. BMI and blood pressure were significantly higher in dyslipidaemia cases (P < 0·001). Considering the biochemical data, the dyslipidaemia group exhibited higher levels of liver enzymes (alanine aminotransferase, aspartate aminotransferase, glutamyl transpeptidase, alkaline phosphatase), creatinine, uric acid and FBG compared with the control group (P < 0·01).
Baseline characteristics of the dyslipidaemia cases and controls (Mean values and standard deviations; numbers and percentages; median values and interquartile ranges)

SBP, systolic blood pressure; DBP, diastolic blood pressure; ALT, alanine aminotransferase; AST, aspartate aminotransferase; GGT, glutamyl transpeptidase; ALP, alkaline phosphatase; FBG, fasting blood glucose.
Hardy–Weinberg equilibrium test
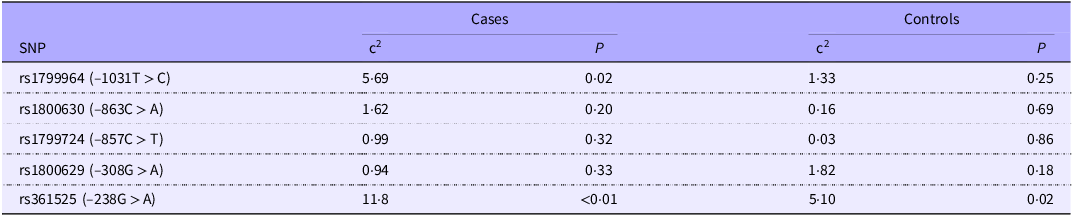
Table 2 shows the HWE test of TNF-α SNP (–1031T > C, −863C > A, −857C > T, −308G > A and −238G > A). Among the controls, rs1799964, rs1800630, rs1799724 and rs1800629 all conformed to HWE (P > 0·05), indicating that they followed Mendelian genetic equilibrium and possessed representativeness of the population. However, the genotype distribution of −238G > A failed to conform to the HWE test in both cases (χ 2 = 11·80, P < 0·01) and controls (χ 2 = 5·10, P = 0·02). Consequently, this polymorphism was not utilised for further analysis.
Hardy–Weinberg equilibrium test of TNF-α SNP

Association of TNF-α SNP with dyslipidaemia
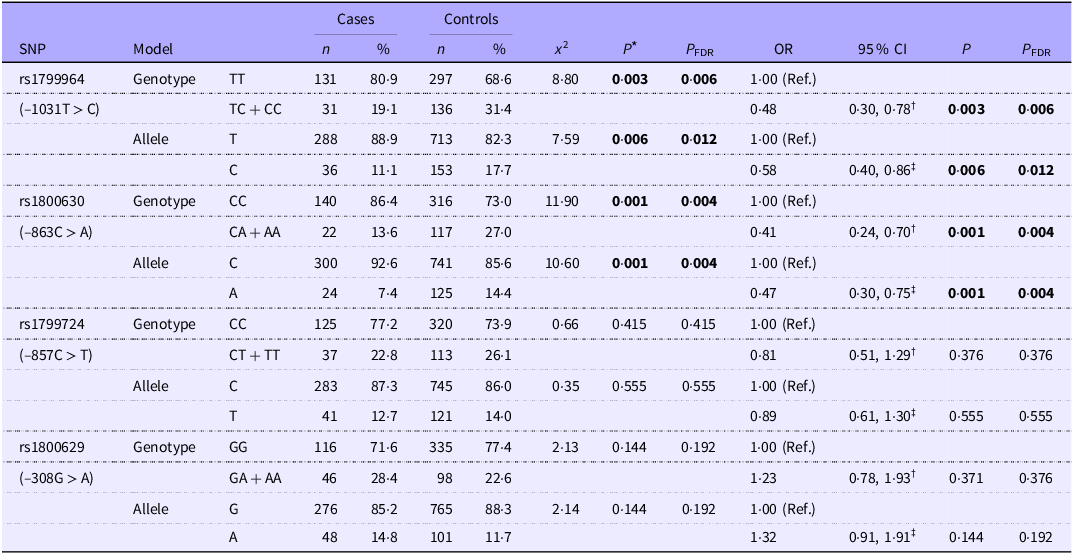
The genotype and allele frequencies of the investigated TNF-α promoter polymorphisms (–1031T > C, −863C > A, −857C > T and −308G > A) are summarised in Table 3. We found that rs1799964 (–1031T > C) and rs1800630 (–863C > A) were significantly associated with dyslipidaemia (genotype and allele frequencies, P FDR < 0·05), while rs1799724 (–857C > T) and rs1800629 (–308G > A) were not significantly associated with dyslipidaemia (genotype and allele frequencies, P FDR > 0·05). After adjusting for factors such as age, sex, BMI, systolic blood pressure, diastolic blood pressure, liver enzymes (alanine aminotransferase, aspartate aminotransferase, glutamyl transpeptidase, alkaline phosphatase), creatinine, uric acid and FBG, the genetic variants −1031T > C and −863C > A remained significantly associated with dyslipidaemia (Table 3). Individuals carrying the TC + CC genotype for −1031T > C had lower odds of dyslipidaemia (OR = 0·48; 95 % CI: 0·30, 0·78; P FDR = 0·006) compared with those with the TT genotype. Similarly, the CA + AA genotype for −863C > A was associated with reduced odds of dyslipidaemia (OR = 0·41; 95 % CI: 0·24, 0·70; P FDR = 0·004) relative to the CC genotype. The C allele at −1031T/C (OR = 0·58; 95 % CI: 0·40, 0·86; P FDR = 0·012) and the A allele at −863C/A (OR = 0·47; 95 % CI: 0·30, 0·75; P FDR = 0·004) further supported these protective associations (Table 3).
Genotype and allelic frequency distribution of TNF-α SNP among dyslipidaemia cases and controls (Numbers and percentages; odds ratios and 95 % confidence intervals)

* Cases v. controls using χ 2 test with a 2 × 2 contingency table.
† Logistic regression analysis adjusted for age, sex, BMI, systolic blood pressure, diastolic blood pressure, liver enzymes (alanine aminotransferase, aspartate aminotransferase, glutamyl transpeptidase, alkaline phosphatase), creatinine, uric acid and fasting blood glucose.
‡ OR was calculated based on a 2 × 2 contingency table, and the P value of χ 2 test was used to assess the significance of the OR. TC + CC: Combine TC and CC genotypes for analysis. Similarly, CA + AA, CT + TT and GA + AA.
Boldface indicates statistically significant results (P < 0.05).
Haplotype analyses of TNF-α polymorphisms
The linkage disequilibrium was defined as D’ ≥ 95, and one haplotype blocks were identified in the TNF-α region (Fig. 1). Haplotype analysis revealed a strong linkage between rs1799964 (–1031T > C) and rs1800630 (–863C > A) within block 1 (D’ = 99). Notably, the C-A haplotype (–1031C and −863A) demonstrated a strong protective association with dyslipidaemia (OR = 0·43; 95 % CI: 0·26, 0·71; P = 0·001), suggesting synergistic effects of these alleles (Table 4).
Construction of haplotypes for TNF-α SNP.

Association analysis of TNF-α polymorphisms haplotypes with dyslipidaemia (Odds ratios and 95 % confidence intervals)

* Adjusted by age, sex, BMI, systolic blood pressure, diastolic blood pressure, liver enzymes (alanine aminotransferase, aspartate aminotransferase, glutamyl transpeptidase, alkaline phosphatase), creatinine, uric acid and fasting blood glucose.
Stratified analysis by sex
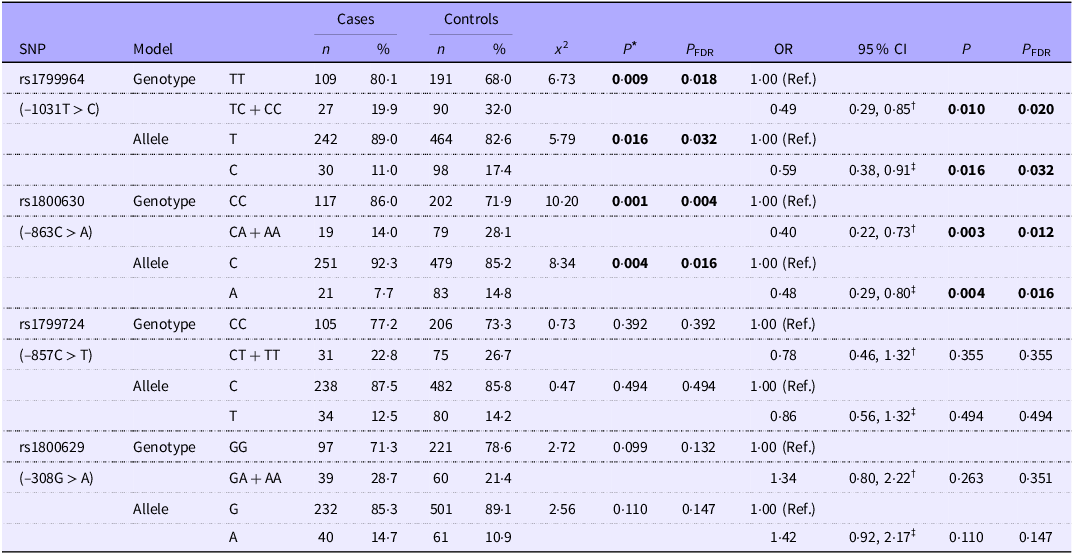
A stratified analysis by sex was conducted for further investigation. Consistent with previous findings, two SNP (–1031T > C and −863C > A) were significantly related to dyslipidaemia among the male population (Table 5). Specifically, the TC + CC genotype of −1031T > C (OR = 0·49; 95 % CI: 0·29, 0·85; P FDR = 0·020) and the CA + AA genotype of −863C > A (OR = 0·40; 95 % CI: 0·22, 0·73; P FDR = 0·012) remained significantly associated with reduced odds of dyslipidaemia in males. Additionally, the C allele at −1031T/C (OR = 0·59; 95 % CI: 0·38, 0·91; P FDR = 0·032) and the A allele at −863C/A (OR = 0·48; 95 % CI: 0·29, 0·80; P FDR = 0·016) also supported these protective associations in males. However, no significant associations were observed in females (online Supplementary Table S2).
Genotype and allelic frequency distribution of TNF-α SNP among male population (Numbers and percentages; odds ratios and 95 % confidence intervals)

* Cases v. controls using χ 2 test with a 2 × 2 contingency table.
† Logistic regression analysis adjusted for age, sex, BMI, systolic blood pressure, diastolic blood pressure, liver enzymes (alanine aminotransferase, aspartate aminotransferase, glutamyl transpeptidase, alkaline phosphatase), creatinine, uric acid and fasting blood glucose.
‡ OR was calculated based on a 2 × 2 contingency table, and the P value of χ 2 test was used to assess the significance of the OR. TC + CC: Combine TC and CC genotypes for analysis. Similarly, CA + AA, CT + TT and GA + AA.
Boldface indicates statistically significant results (P < 0.05).
Association analysis of TNF-α SNP with types of dyslipidaemia
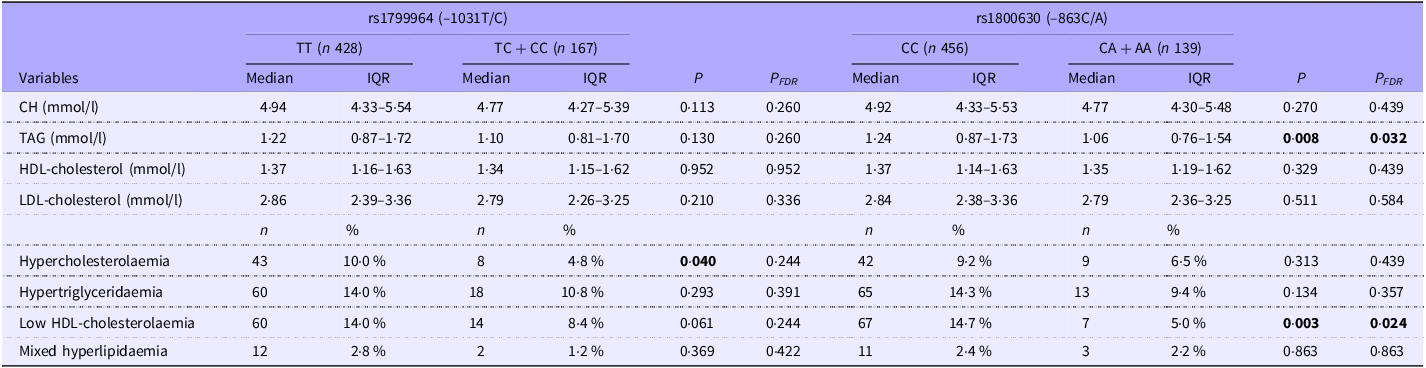
We categorised dyslipidaemia into four clinical types: hypercholesterolaemia, hypertriglyceridaemia, mixed hyperlipidaemia and low HDL-cholesterolaemia. Further analysis was conducted to explore the relationships between the genotypes of two TNF-α SNP (rs1799964 and rs1800630) and blood lipid concentrations, as well as various clinical types of dyslipidaemia. Before FDR correction, the TC + CC genotype of rs1799964 was associated with a lower prevalence of hypercholesterolaemia compared with the TT genotype (4·8 % v. 10·0 %, P = 0·04). However, this association was no longer statistically significant after FDR adjustment (P FDR = 0·244) (Table 6). Additionally, rs1800630 was found to be correlated with TAG concentrations and low HDL-cholesterolaemia. Compared with individuals with the CC genotype of rs1800630, those with the CA + AA genotype had lower TAG concentrations (median: 1·24 (0·87–1·73) mmol/L v. 1·06 (0·76–1·54) mmol/L, P FDR = 0·032) and a reduced prevalence of low HDL-cholesterolaemia (14·7 % v. 5 %, P FDR = 0·024) (Table 6).
Association of TNF-α SNP with blood lipid concentrations and types of dyslipidaemia (Numbers and percentages; median values and interquartile ranges)

Skewed distribution data were denoted by median (quartile spacing) and compared using the nonparametric rank sum test. Categorical variables were denoted by frequencies with percentages and compared using χ 2 test or Fisher’s exact test. CH, cholesterol.
Boldface indicates statistically significant results (P < 0.05).
Post hoc power analysis
Post hoc statistical power analysis was performed for the significant SNP. In the total sample, both the genotype and allele models of rs1800630 (–863C > A) demonstrated high statistical power (0·93 and 0·90, respectively) (online Supplementary Table S3), indicating that the current sample size is sufficient to detect their associations with dyslipidaemia. For rs1799964 (–1031T > C), the genotype model met the statistical power threshold (statistical power = 0·85), while the allele model showed slightly lower power (0·79) (online Supplementary Table S3). In the male subgroup, the genotype and allele models of rs1800630 (–863C > A) also achieved adequate statistical power (0·89 and 0·82, respectively) (online Supplementary Table S3). However, both models for rs1799964 (–1031T > C) fell below the threshold (statistical power = 0·74 and 0·67) (online Supplementary Table S3), likely due to smaller sample sizes or weaker effect sizes, suggesting potential limitations in detecting true associations. Expanding the sample size is recommended to enhance detection capability.
Gene functional annotation and pathway enrichment analysis
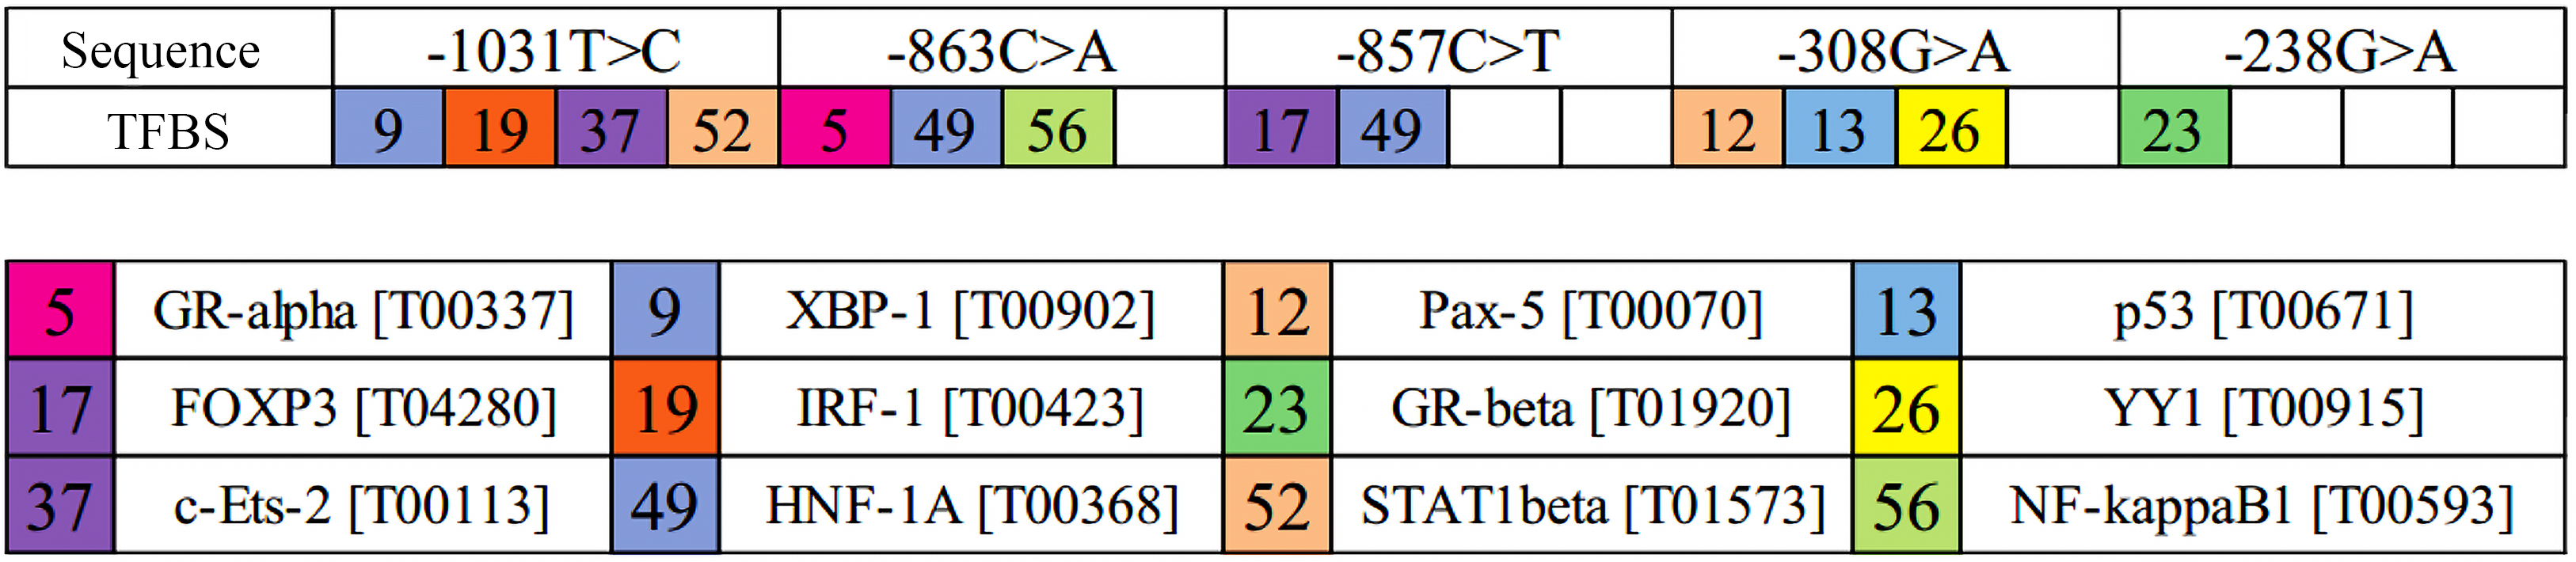
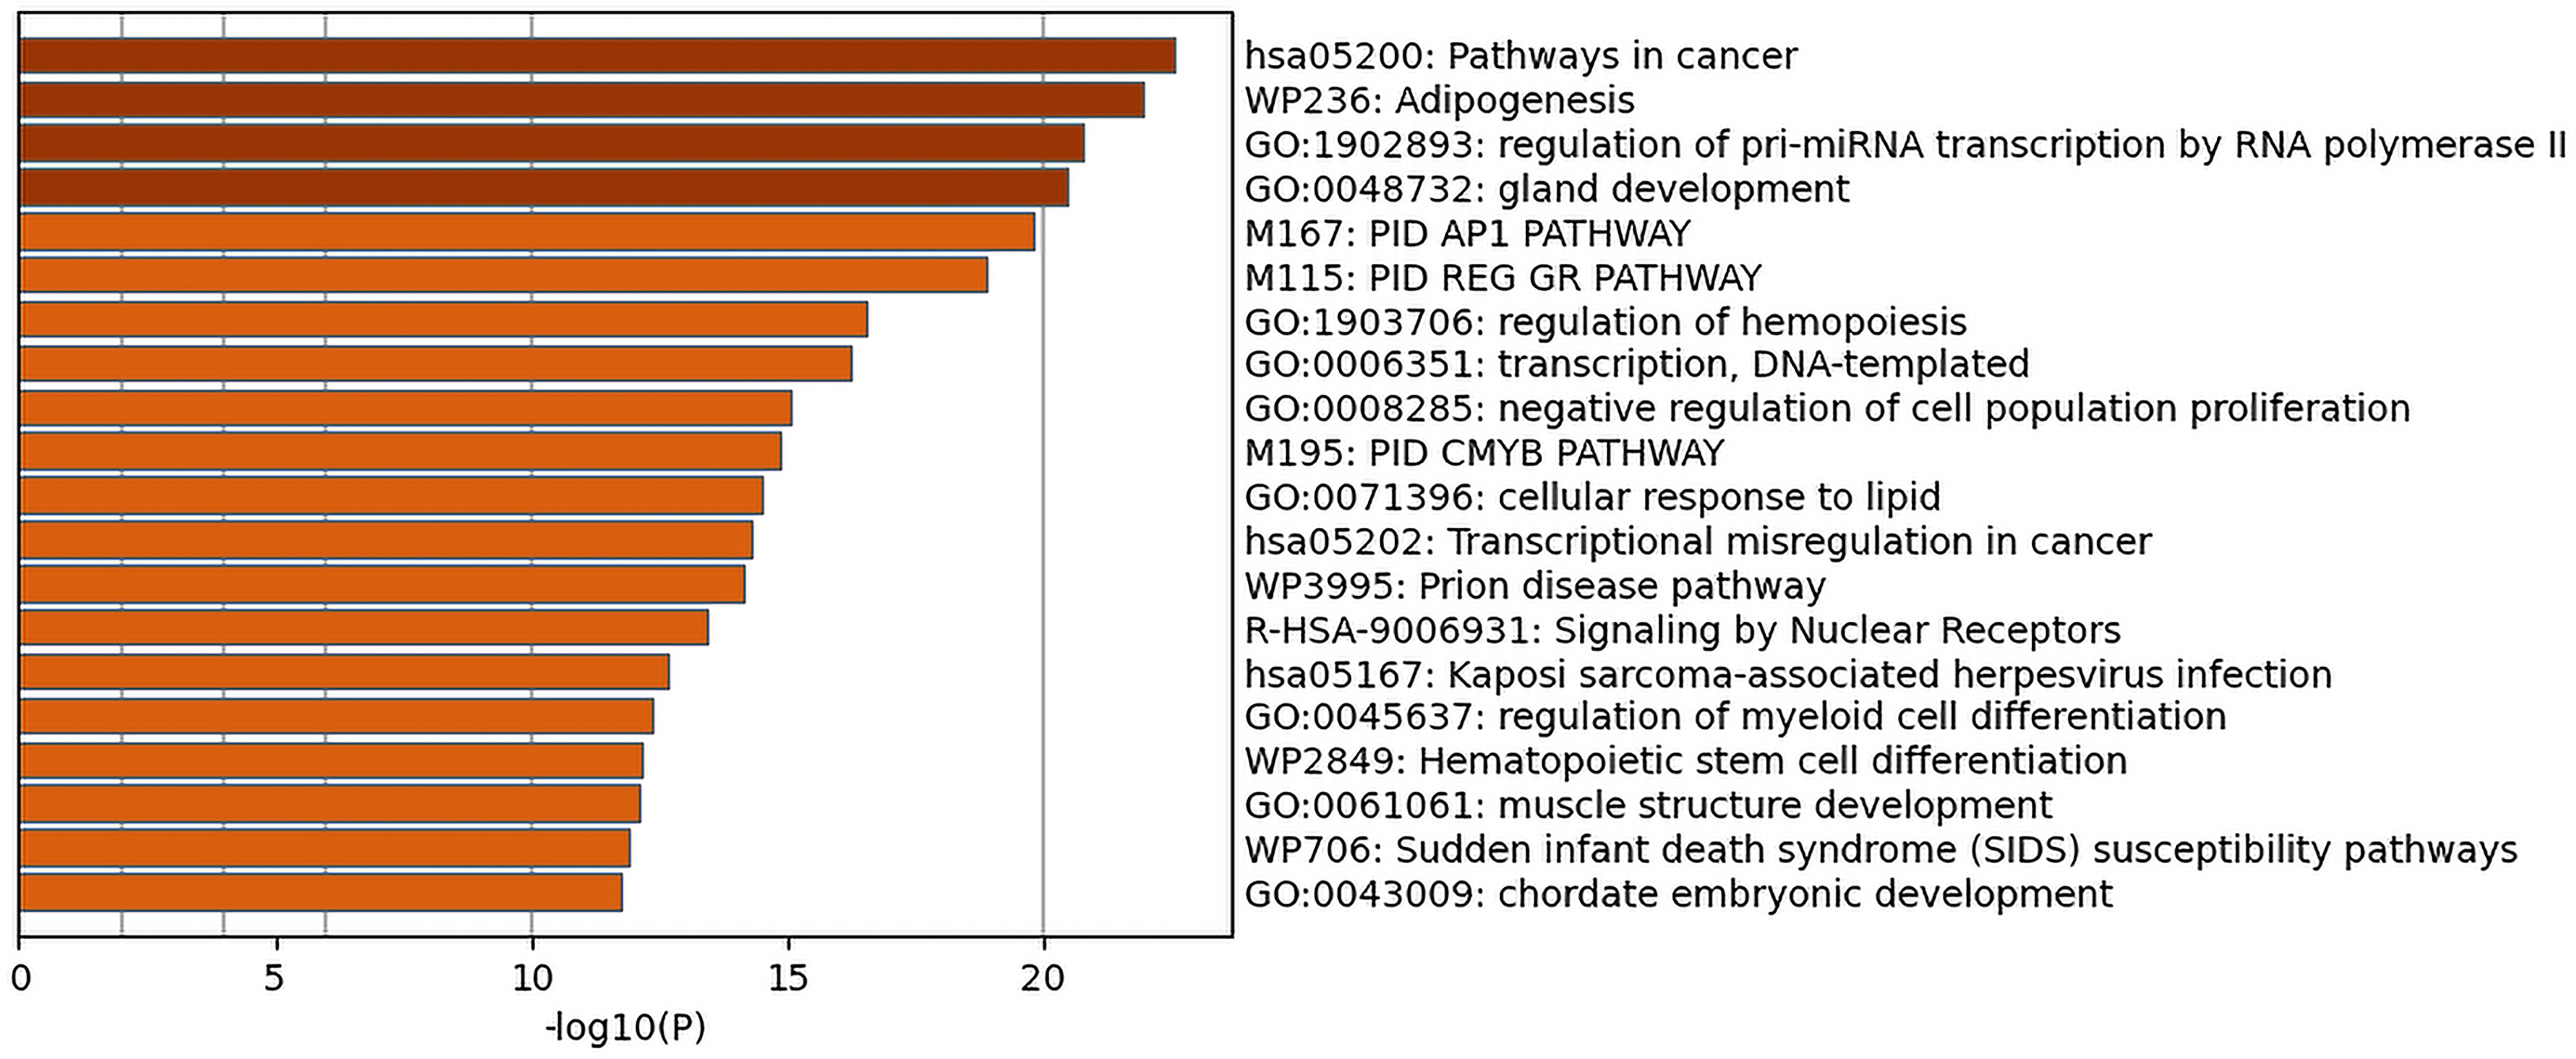
We predicted seventy-three transcription factors within the DNA sequence of the TNF-α gene promoter region using the PROMO online platform (Fig. 2). Among them, the rs1799964 (–1031T > C) site potentially binds to transcription factors including XBP-1, IRF-1, c-Ets-2 and STAT 1β, while the rs1800630 (–863C > A) site potentially binds to HNF-1A, GR-α and NF-κB1 (Fig. 3). The significantly enriched pathways of these seventy-three transcription factors were illustrated in Fig. 4. Notably, our analysis suggested that the transcription factors HNF-1A and STAT 1 may play pivotal roles in WP 236, also known as the adipogenesis pathway.
Predicted transcription factors binding to TNF-α gene promoter region.

The possible transcription factors within the TNF-α gene promoter region. Numbers in the coloured boxes of the upper panel refer to different transcription factors that bind to TNF-α SNP. GR-alpha, nuclear receptor subfamily 3 group C member 1 (Gene ID: 2908); XBP-1, X-box binding protein 1 (Gene ID: 7494); Pax-5, paired box 5 (Gene ID: 5079); p53, tumour protein p53 (Gene ID: 7157); FOXP3, forkhead box P3 (Gene ID: 50 943); IRF-1, interferon regulatory factor 1 (Gene ID: 3659); GR-beta, nuclear receptor subfamily 3 group C member 1 (Gene ID: 2908); YY1, YY1 transcription factor (Gene ID: 7528); c-Ets-2, ETS proto-oncogene 2, transcription factor (Gene ID: 2114); HNF-1A, HNF1 homeobox A (Gene ID: 6927); STAT1 beta, signal transducer and activator of transcription 1 (Gene ID: 6772); NF-kappaB1, NF-κB subunit 1 (Gene ID: 4790).

Gene pathway enrichment analysis of TNF-α gene promoter region.

Discussion
As a pro-inflammatory cytokine, TNF-α could be a potential biomarker in some inflammation-related diseases(Reference Bradley24). Many studies have reported that elevated serum TNF-α concentration was related to dyslipidaemia(Reference Papapanagiotou, Siasos and Kassi10,Reference Jovinge, Hamsten and Tornvall25) . Our initial exploration in this research focused on elucidating the potential link between TNF-α SNP and dyslipidaemia within the Chaoshan region of Guangdong Province. Our findings revealed that the TC + CC genotype for –1031T/C and the CA + AA genotype for –863C/A had lower odds of dyslipidaemia. Protective effects were also observed for the C allele at –1031T/C and the A allele at –863C/A. These results are similar to previous research conducted in other populations. For instance, Sandoval-Pinto et al.(Reference Sandoval-Pinto, Padilla-Gutiérrez and Valdés-Alvarado13) investigated the relationship between –1031T > C and acute coronary syndrome and found that the –1031C allele conferred a lower risk of acute coronary syndrome in a Western Mexican population. Similarly, Anubha Mahajan(Reference Mahajan, Tabassum and Chavali26) observed that mutations at –863C > A among the North Indian population were related to a reduced risk of non-obese type 2 diabetes. However, inconsistent conclusions also exist. A cross-sectional study(Reference Oki, Norde and Carioca27) in Brazil including 281 participants investigated the correlation between TNF-α SNP and plasma fatty acid levels, and the results showed that participants carrying the mutant allele at –1031T > C had higher levels of plasma stearic acid. Kallel et al.(Reference Kallel, Ftouhi and Jemaa14) reported that CA + AA genotype and A allele of –863C > A were significantly associated with the increased risk of type 2 diabetes in the Tunisian population. These conflicting results may arise from differences in population genetic backgrounds, phenotypic definitions across studies (e.g. dyslipidaemia and diabetes) or the modulating effects of environmental factors on gene-phenotype associations.
The other two SNP (–857C/T and –308G/A) were not found to be significantly associated with dyslipidaemia in our study. This may suggest biological neutrality in dyslipidaemia pathogenesis specific to the studied population or population-specific genetic effects mediated by gene–environment interactions. In recent years, many studies have reported conflicting associations between –308G/A and obesity, dyslipidaemia, insulin resistance and diabetes(Reference Gomez-Delgado, Alcala-Diaz and Garcia-Rios28–Reference Phillips, Goumidi and Bertrais32). A meta-analysis revealed that the TNF-α-308G/A polymorphism exhibited ethnic differences in its association with metabolic syndrome risk: the A allele increased susceptibility in Asian populations but correlated with reduced risk in European populations(Reference Wang, He and Zhang33). An updated meta-analysis reported that the TNF-α –308G/G genotype was a risk factor for ischaemic stroke, accompanied by elevated serum TNF-α concentration(Reference Duan, Wang and Shang34). However, another meta-analysis reported no significant relationship between TNF-α polymorphisms (–1031T/C, –863C/A, –857C/T and –308G/A) and coronary artery disease(Reference Huang, Zhao and Li35).
We further performed a stratified analysis by sex and found similar results in men but no significant results in women. On the one hand, the effects of environmental exposure may interact with genetic factors. Females exhibit lower exposure to risk factors like smoking and heavy alcohol consumption, potentially contributing to a decreased prevalence of dyslipidaemia compared with males(Reference Shen, Munker and Wang36). On the other hand, oestrogen exerts a protective effect on lipid metabolism. Specifically, oestrogen can not only directly change the levels of blood lipids but also inhibit 3-hydroxy-3-methyl glutaryl coenzyme A reductase and cholesterol synthesis by regulating the activation of AMP-activated protein kinase(Reference Trapani and Pallottini37). This may partially explain the non-significant results observed in female subjects.
Seventy-three kinds of transcription factors within the TNF-α gene promoter region were predicted. Gene pathway enrichment analysis showed that transcription factors HNF1A and STAT1beta, which bound to −1031T > C and −863C > A sites, respectively, might play important roles in the adipogenesis pathway. Hence, we speculate that the possible mechanisms by which TNF-α SNP affect dyslipidaemia are as follows: (1) Different TNF-α gene polymorphisms can lead to dyslipidaemia by influencing the adipogenesis pathway at the transcriptional level, altering serum TNF-α expression levels and ultimately resulting in abnormal lipid metabolism. (2) The effects of TNF-α gene polymorphisms on dyslipidaemia are independent of serological TNF-α concentration.
For the first speculation, Higuchi et al. found that mutations at TNF-α –1031T > C, –863C > A and –857C/T significantly enhanced the promoter activity of the TNF-α gene(Reference Higuchi, Seki and Kamizono38). Skoog et al.(Reference Skoog, van’t Hooft and Kallin39) reported that –863C/A polymorphism (C to A substitution) was associated with reduced circulating levels of TNF-α. This might result from the fact that the two alleles exhibit different binding affinities for NF-κB, leading to different transcriptional activities. Another report showed that transcription factor OCT1 binds the TNF-α –857T allele but not –857C and interacts with the adjacent binding site of NF-κB (p65 subunit) both in vitro and in vivo, subsequently increasing the expression of TNF-α (Reference van Heel, Udalova and De Silva40). The –308G/A polymorphism, co-localising with the activating protein-2 transcription factor binding site, enhances TNF-α expression through A allele-mediated upregulation of transcriptional activity and mRNA translation, thereby elevating inflammation-related disease risks(Reference Kroeger, Carville and Abraham41,Reference Louis, Franchimont and Piron42) . The A allele of –238G/A polymorphism was found to significantly decrease gene transcriptional activity, resulting in a decrease in the level of TNF-α (Reference Kaluza, Reuss and Grossmann43). However, there are also inconsistent views. Skoog et al. found that in the non-obese group carrying –863A or –857C alleles, TNF-α secretion from adipose tissue was significantly reduced, whereas no such reduction was observed in the obese group(Reference Skoog, Eriksson and Hoffstedt12). Additionally, no association was found between TNF-α secretion and –1031T/C, –308G/A or –238G/A polymorphisms in either group(Reference Skoog, Eriksson and Hoffstedt12). This may be due to the fact that the transcription factor binding sites are located outside the regions of –863C/A and –857C/T, resulting in increased transcriptional activity of obesity-related gene promoters(Reference Skoog, Eriksson and Hoffstedt12). Furthermore, obesity is a complex condition that can be affected by both genetic and environmental factors. Obesity itself may have a stronger effect on TNF-α production(Reference Skoog, Eriksson and Hoffstedt12).
This study has several limitations. First, all participants were recruited exclusively from the Chaoshan region of Guangdong Province, China. This geographical restriction may limit the generalisability of our findings to other regions or ethnic populations, as genetic and environmental factors could differ substantially. Second, in the stratified analysis of the male subgroup, the statistical power for the −1031T > C polymorphism was suboptimal (post hoc power = 0·74 for genotypes and 0·67 for alleles), likely due to the smaller sample size or weaker effect size. Future multi-regional, multi-ethnic studies with larger sample sizes are needed to validate these findings and enhance detection power. Additionally, although adjustments were made for differences in factors such as age, sex, BMI, blood pressure, blood glucose and liver and kidney function indicators in the multivariate analysis, residual confounding from unmeasured variables (e.g. diet, physical activity and other socio-economic factors) and polygenic effects (e.g. unaccounted lipid-related loci such as APOE, LDLR and PCSK9) related to demographic imbalances could not be completely ruled out. Lastly, the genotype distribution of rs1799964 (–1031T > C) in the dyslipidaemia group deviated from HWE (P < 0·05), suggesting potential genetic selection pressure or disease-related effects at this locus in dyslipidaemia, while the control group conformed to HWE (P = 0·25), supporting its population representativeness. Caution should be exercised when interpreting the association results, and further validation of confounding factors or biological mechanisms is necessary.
In conclusion, our study provides evidence that TNF-α polymorphisms (–1031T/C and −863C/A) are significantly associated with dyslipidaemia from the Chaoshan region of Guangdong Province, particularly in males, suggesting a potential role of transcriptional regulation in adipogenesis pathways as an underlying mechanism. Further studies are necessary to elucidate the biological mechanisms and validate these associations in diverse populations.
Supplementary material
For supplementary material/s referred to in this article, please visit https://doi.org/10.1017/S000711452510398X.
Acknowledgements
The authors express gratitude to all participants in this study.
This work was supported by funding from the Medical Scientific Research Foundation of Guangdong Province, China (no. 201811981727429), as well as the 2023 Talent Support Program of the First Affiliated Hospital of Shantou University Medical College (no. YCTJ-2023).
K. L. participated in statistical analyses, interpretation of results, writing of the manuscript and subsequent revisions. C. W. was responsible for data collection and preliminary analysis and contributed to the writing of the first drafts. X. Y. was involved in data verification, validated the data section of the article and provided suggestions for revisions. X. C. designed the research protocol, supervised the team’s work and revised the article. Every author participated in the work of this article and approved the final submission.
The authors declare that there are no conflicts of interest.