Introduction
Lichen colonization of stonework has been extensively investigated (Piervittori et al. Reference Piervittori, Salvadori and Laccisaglia1994, Reference Piervittori, Salvadori and Laccisaglia1996, Reference Piervittori, Salvadori and Isocrono1998, Reference Piervittori, Salvadori and Isocrono2004a, Reference Piervittori, Salvadori, Seaward, St. Clair and Seaward2004b). Various effects, ranging from biodeterioration to bioprotection have been reported, depending on the weathering ability of the species and on the physico-chemical features of the lithotype (Adamo & Violante Reference Adamo and Violante2000; Chenet al. Reference Chen, Blume and Beyer2000; St. Clair & Seaward Reference St. Clair, Seaward, St. Clair and Seaward2004). Aesthetic, chemical and/or physical damage by a particular species depends on its morphology and physiology (Ascasoet al. Reference Ascaso, García del Cura, de los Ríos, St. Clair and Seaward2004; de los Rìos & Ascaso Reference de los Ríos and Ascaso2005), but its impact on the conservation of a monument depends on the quantity of the substratum that is colonized by that species. It is worth noting that lichens colonize both the surface of rocks, where the thalline component (TC, sensu Favero-Longo et al. Reference Favero-Longo, Castelli, Salvadori, Belluso and Piervittori2005) influences aesthetics (Nimis et al. Reference Nimis, Seaward, Ariño and Barreno1998; Seaward Reference Seaward, St. Clair and Seaward2004), and their interior, where the hyphal penetration component (HPC, sensu Favero-Longo et al. Reference Favero-Longo, Castelli, Salvadori, Belluso and Piervittori2005) induces chemical and physical processes (Ascaso et al. Reference Ascaso, García del Cura, de los Ríos, St. Clair and Seaward2004; de los Rìos & Ascaso Reference de los Ríos and Ascaso2005).
Analysis of the cover of lichen species in archaeological, urban and cemetery areas currently requires time-consuming specialist work in the field: an expert eye has to examine one relevé after another, recognize species and estimate their cover, while at the same time limiting or avoiding sampling operations for conservation reasons (e.g. Nimis et al. Reference Nimis, Monte and Tretiach1987). On the other hand, analysis of the penetrating hyphae, which currently combines microscopy and staining methods in the laboratory, mainly focuses on their maximum or average depth of penetration (Pinna et al. Reference Pinna, Salvadori and Tretiach1998; Favero-Longo et al. Reference Favero-Longo, Castelli, Salvadori, Belluso and Piervittori2005), and disregards quantifying their spread. New, user-friendly methods are thus needed to quantify the volume of substratum penetrated by the lichen-forming fungal mycelium.
We have developed two new procedures based on image analysis through colour-based pixel classification to quantify a) the lichen species cover on stonework, and b) the spread of hyphae penetrating within stonework. The applicability of these methods was verified by evaluating whether a) the colours of the substratum and of the different lichen species, as they appear in the field, and b) the colours of the substratum and of the hyphae, as they appear in polished-cross sections stained with periodic acid Schiff regent (PAS), were sufficiently diverse, in terms of hue, saturation or intensity, to allow the image-analysis software to discriminate and measure them. These new methods were tested on historical and culturally significant stone substrata made up of different lithotypes, including marble, travertine and mortar, and with different levels of lichen biodiversity.
Materials and Methods
Method to quantify lichen species cover on stonework
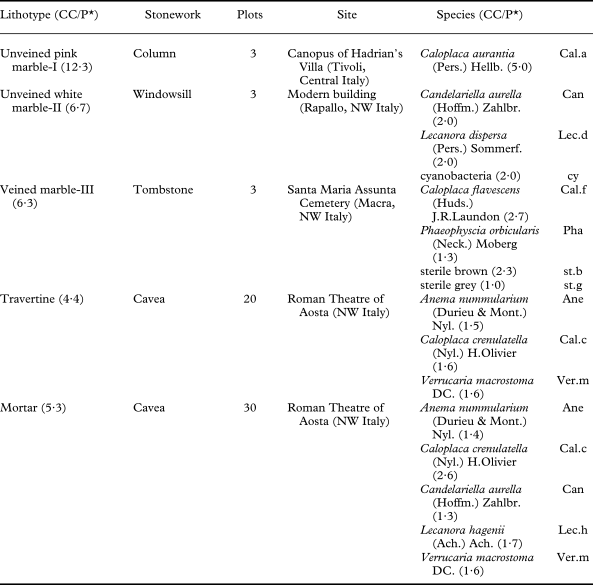
Lichen cover was analyzed on five historical and culturally significant stone substrata of different sizes of veined- and unveined-marble, travertine and mortar in cemetery, urban and archaeological sites in north-western and central Italy (Table 1).
Case studies of stonework analyzed for lichen cover
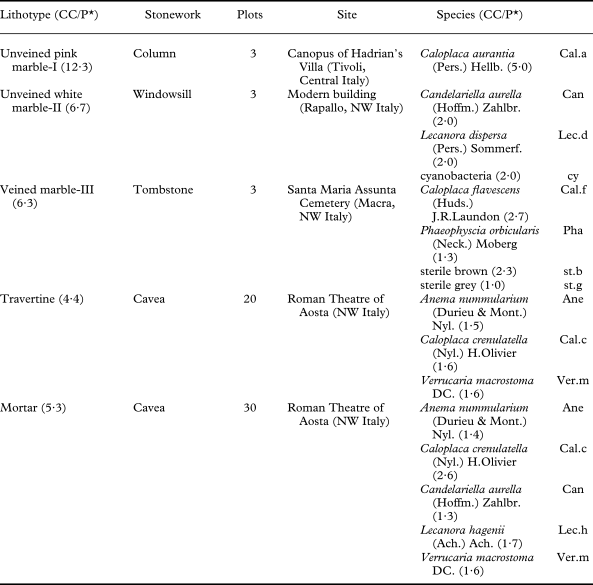
* CC/P: ratio between the number of colour classes used to define the substratum (or the species) and the number of plots in which the substratum (or the species) occurs.
A preliminary floristic study was carried out at each site, i.e. the lichen diversity was evaluated by surveying the site, sampling small thallus fragments without damaging the substratum, and checking their identity in the laboratory. The stone substrata analyzed were colonized by one to five lichen species (Table 1). The nomenclature proposed by Nimis and Martellos (Reference Nimis and Martellos2008) was adopted.
High definition images (400 dpi) of the colonized stonework were then acquired at each site from randomly defined plots using a scanner (Epson V10, with a scanning area of 22 × 30 cm) connected to a laptop computer and supplied with power by a portable generator (Honda EU 10i). The number of plots studied at each site depended on the size of the stone substratum and images of the plot were acquired when the surfaces of the plots were dry.
The images were analyzed in the laboratory using the WinCAM Pro 2007d software (Regent's Instruments). The first step, for each image, was to train the software in which colour classes belonged to the substratum and which belonged to each lichen species, through a selection of representative pixels on the processed images. The substratum and each lichen species were thus defined according to specific colour groups which included several colour classes, identified by hue, saturation and intensity co-ordinates (colour model HSI). Heuristic optimization of the definition of the colour classes in the different case studies led to the selection of a higher number of colour classes per plot, to define the substrata (av. 7·0 ± 3·0 colour classes/plot), than those used to define the different lichen species (av. 2·0 ± 0·9 colour classes/plot) (CC/P in Table 1). Using such information, the software quantified the abundance of pixels pertaining to each colour class, and finally quantified (as a %) the total and specific lichen cover. It is worth noting that the software classified those pixels which did not correspond exactly to the defined colour classes (‘orphan pixels’), in the closest colour class in terms of HSI co-ordinates. A statistical analysis (MANOVA with post-hoc Tukey's test) was then performed for each case study to verify whether the groups of colour classes which distinguished the substratum and each lichen species differed significantly at the P<0·05 level in terms of HSI co-ordinates (i.e. ‘orphan pixels’ were likely classified in the correct class) or not (i.e. ‘orphan pixels’ were possibly classified in an incorrect class). In this latter case, the reliability of the analysis was finally established through a comparison of processed images and graphic outputs, by visually evaluating whether the substratum and/or lichen species which were not significantly different, in terms of HSI parameters, were correctly recognized.
Method to quantify the spread of hyphae penetrating within stonework
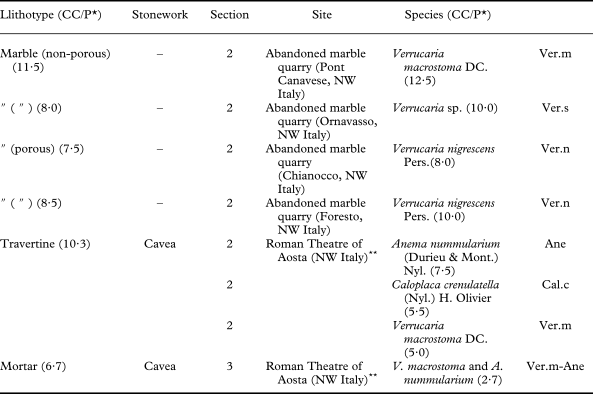
The spread of penetrating hyphae was analyzed within travertine and mortar sampled in the Roman Theatre of Aosta (Italy) and within four kinds of marble (frequently employed in north-western Italy for monuments and historical buildings) sampled in their abandoned quarries (Table 2). It is worth noting that the analysis of samples from sites where stones were once quarried and which are now naturally colonized by microorganisms allows the bioweathering of stonework to be investigated without the drawback of having to sample monuments (Garcia-Vallès et al. 2000; Ascaso et al. Reference Ascaso, García del Cura, de los Ríos, St. Clair and Seaward2004). Five lichen species, were considered because of their dominant occurrence in both the archaeological and/or quarry sites, namely, Anema nummularium, Caloplaca crenulatella, Verrucaria macrostoma, V. nigrescens and Verrucaria sp.
Case studies of stonework analyzed for the spread of hyphae penetrating into the rock (HPC)
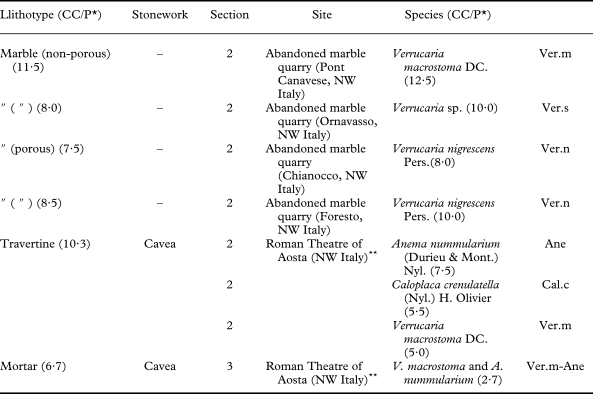
* CC/P: ratio between the number of colour classes used to define the substratum (or the HPC of the different species) and the number of examined plots.
** sections were prepared from small lithic fragments already detached from the ruins, which were sampled in marginal areas of the archaeological site.
Two polished cross-sections were prepared for each case-study (i.e. different lithotypes, different species) according to Favero-Longo et al. (Reference Favero-Longo, Castelli, Salvadori, Belluso and Piervittori2005) and stained using the periodic acid-Schiff method (Whitlach & Johnson Reference Whitlach and Johnson1974) to highlight the HPC. Micro-photographs (150 dpi) of the stained sections were acquired at ×10 magnification under reflected light microscopy using a stereomicroscope (Olympus SZH10) equipped with a digital camera (Olympus DP11).
The images acquired were analyzed in the laboratory using the WinCAM Pro 2007d software (Regent's Instruments), training the software in the allocation of colours to the substratum and to the PAS-stained penetrating hyphae, as described above. A similar number of colour classes per plot was usually selected to define the substratum and the stained HPC (CC/P in Table 2). Using such information, the software measured the abundance of pixels pertaining to each colour class and quantified the spread of penetrating hyphae within the substratum (as a percentage) from the part of the rock immediately beneath the TC down to the maximum depth at which the rock was continuously penetrated by hyphae (i.e. maximum depth of massive penetration sensu Favero-Longo et al. Reference Favero-Longo, Castelli, Salvadori, Belluso and Piervittori2005). A statistical analysis (MANOVA, Tukey's test) was performed for each case study, to verify whether the groups of colour classes which distinguished the substratum and the stained penetrating hyphae differed significantly (P<0·05) in terms of HSI co-ordinates (i.e. ‘orphan pixels’ were classified in the correct class) or not (i.e. ‘orphan pixels’ were possibly classified in an incorrect class).
Results
Measuring lichen species cover on stonework
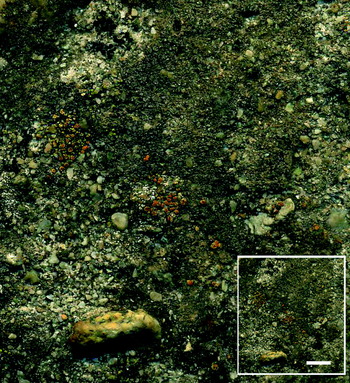
The high definition images acquired by the scanner allowed observations to be made of the lichen colonization similar to those that can be obtained using stereomicroscopy at a magnification of around ×5. These images also offered an observation field 35 times larger than those available from the stereomicroscope at ×5 (660 cm2 vs. 18 cm2, respectively) (Fig. 1).
High definition image (400 dpi) of the surface of a lichenized mortar, acquired in the field by the scanner and compared with the same image observed by the naked eye (inset). Scale = 1 cm.

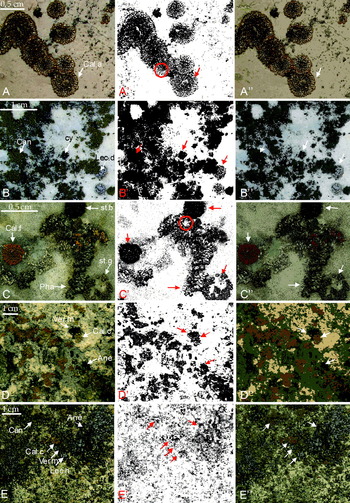
Graphic input (A–E) and outputs (A’–E’ & A”–E”) of image analyses through colour-based pixel classification of lichenized stone surfaces. A, unveined pink marble-I; B, unveined white marble-II; C, veined marble-III; D, travertine, E; mortar. A-E, original images acquired in the field by the scanner (details); A’-E’, recognition of the substratum (white areas) and of the lichen thalli (black areas) by the software; A”-E”, assignment of the original pixels by the software to the different colour classes defined for the substratum and for the different lichen species. The species abbreviations are listed in Table 1. The arrows highlight a high agreement between input and output images for the different species. The red circles mark discoloured parts of the thalli which were consistently not recognized by the software.

The graphic input and outputs of the image analysis performed for the different case studies are illustrated in Fig. 2, which displays the original images acquired by the scanner (Fig. 2A–E), how the software recognizes the substratum and the lichen thalli in these images (white and black coloured areas, respectively; Fig. 2A’–E’), and how it assigns the original pixels to the different colour classes defined for the substratum and for the different lichen species (Fig. 2A”–E”). Black and white graphic outputs offer a reliable visualization of the overall lichen cover, including species that have conspicuous, placodioid or foliose thalli with sharp boundaries (e.g. Caloplaca aurantia, C. flavescens, Phaeophyscia orbicularis), continuous crustose thalli (e.g. Caloplaca crenulatella, Candelariella aurella, Verrucaria nigrescens), scattered squamulose thalli (e.g. Anema nummularium) and/or inconspicuous crustose thalli (e.g. Lecanora dispersa, L. hagenii) (examples highlighted with red arrows inFig. 2A’–E’). The software sometimes mistook the central decayed parts of well-developed individuals for the substratum, because of their discoloured thalli (examples highlighted by red circles in Fig. 2A’ and 2C’).
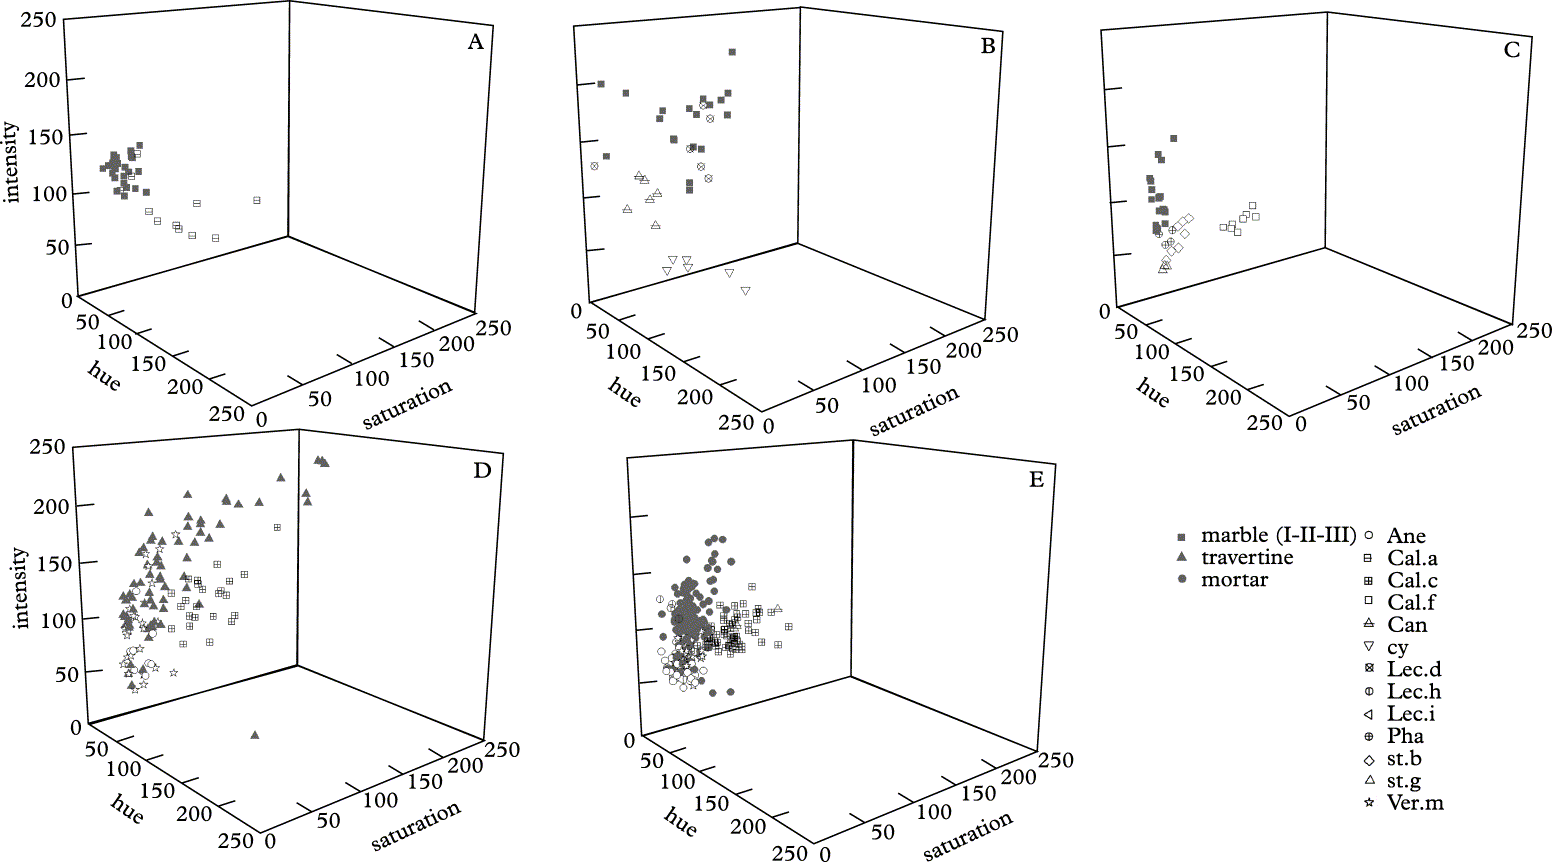
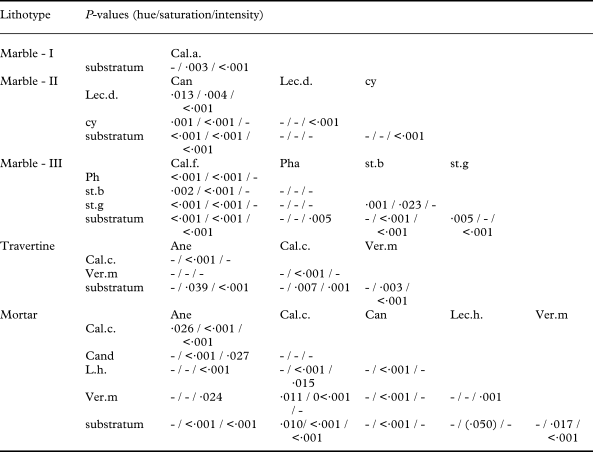
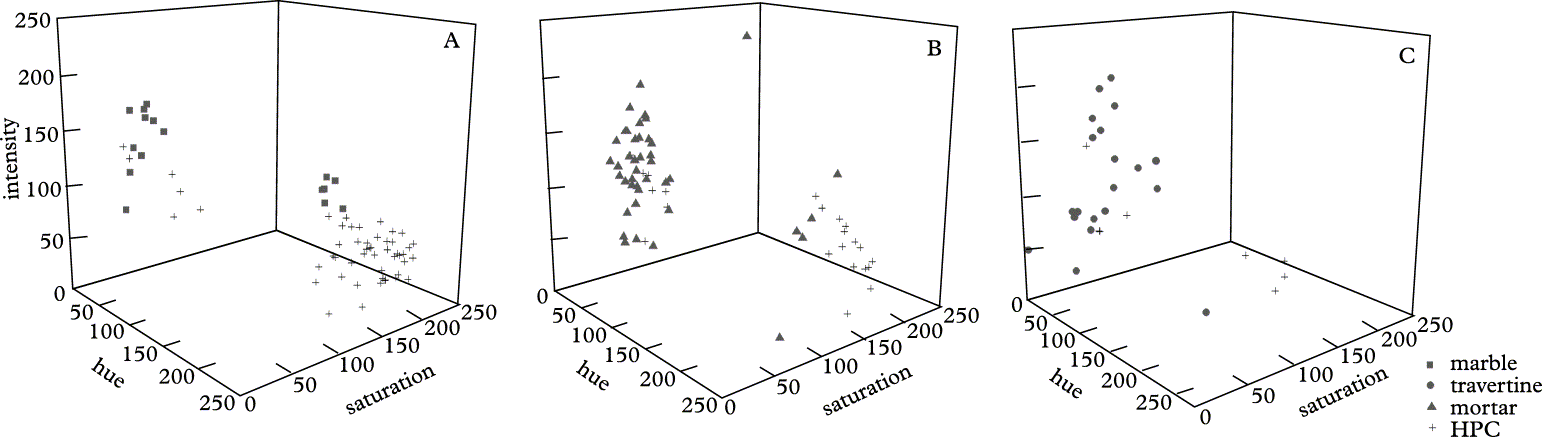
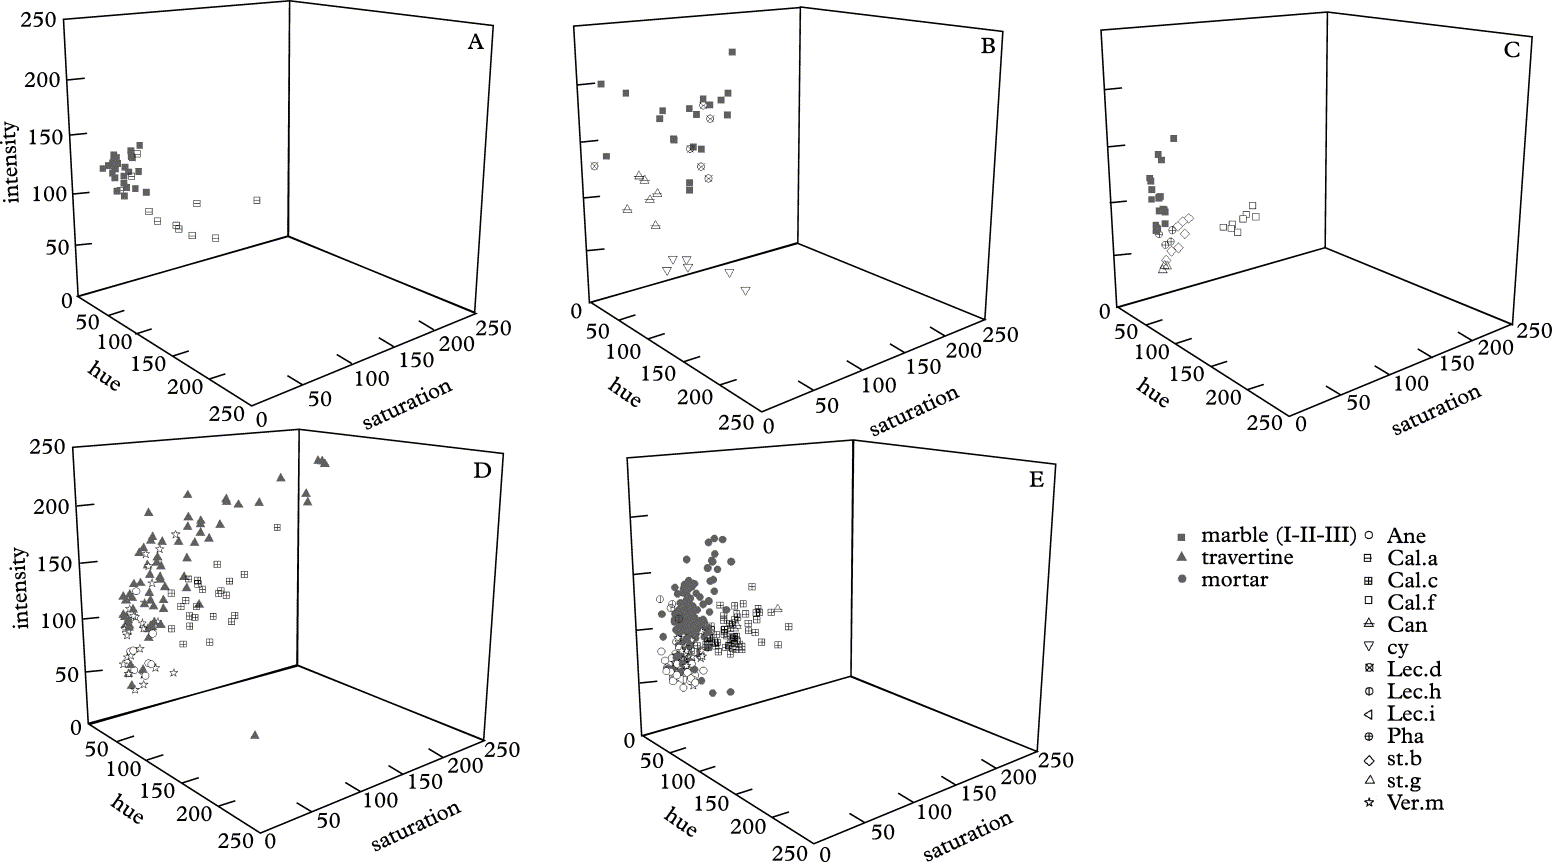
At a first glance, the graphic outputs displaying colour classes closely resemble the images acquired by the scanner, the areas occupied by the different species still being recognizable after the software elaboration (examples highlighted with white and black arrows in Fig. 2A”–E”). Accordingly, the groups of colour classes used for the lithotype and the different lichen species in each case study, mainly scatter separately on the basis of their HSI co-ordinates (Fig. 3). The distribution width of the colour classes in the diagrams reflects the colour heterogeneity of the substratum and lichen species: the former mainly shows a greater colour heterogeneity than the latter, with travertine showing the largest spread of colour classes. Several groups of colour classes that define lichen species are clearly separated from those that define the lithotype (e.g. classes defining Caloplaca species vs. classes that define each lithotype), while in other cases they are nested (i.e. Lecanora hagenii vs. mortar) or partially overlapped (e.g. Lecanora dispersa vs marble, Verrucaria macrostoma vs. travertine and mortar). The groups of colour classes that define different species in the same case-study also sometimes overlap, as in the case of Caloplaca crenulatella and Candelariella aurella on mortar, and of Phaeophyscia orbicularis and the sterile thalli of two undetermined species on marble-III. In the different case studies, the comparison of the groups of colour classes defined for the substratum and lichen species, in terms of HSI co-ordinates, highlights that the groups are significantly different (P<0·05) for at least one parameter (H, S or I) in 87 % of the cases. In particular, 94 % and 82 % of the substratum/species and the species/species comparisons, respectively, show significant differences (Table 3). The specific richness evaluated in the different case studies only slightly influences the number of comparisons which do not show any significant difference in terms of HSI co-ordinates.
Hue, saturation and intensity (HSI) co-ordinates of the colour classes used to train the software to identify the substrata and the lichen species. The species abbreviations are listed in Table 1.
Significant differences (Tukey's test) between the groups of colour classes used to define the substrata and lichen species with reference to the HSI colour model
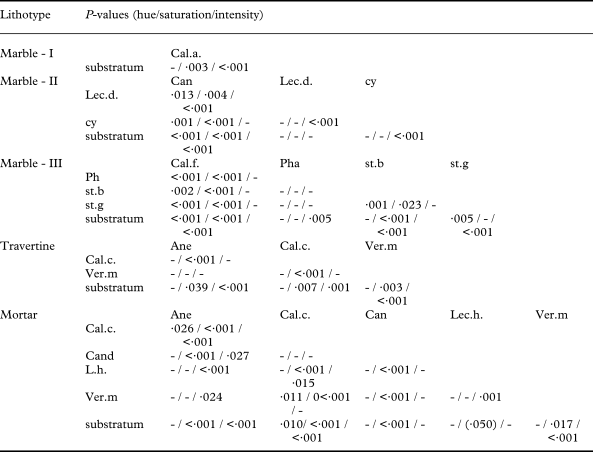
-, not significant; the species abbreviations are listed in Table 1.
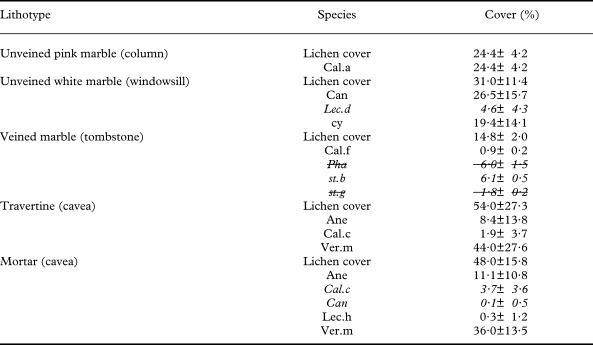
The cover values measured in the different case studies are shown in Table 4. The reliability of the cover data for the species, which are not significantly different from the substratum or from other species, in terms of HSI co-ordinates, was established by visually evaluating the assignment of the pixels in the colour classes in the graphic outputs and the uncertain results were treated collectively (only 2 out of 21 data obtained).
Lichen cover of stonework measured by WinCAM in the examined case studies
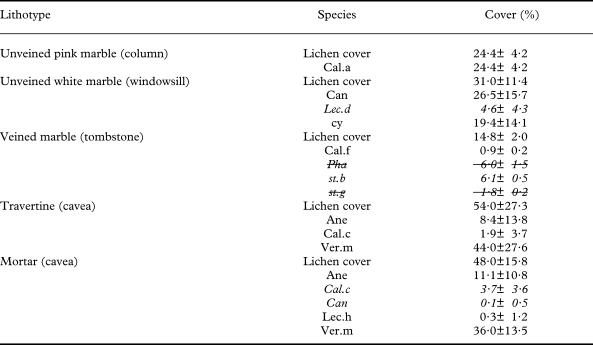
The use of Italics indicates species identified by classes which do not significantly differ in terms of HSI co-ordinates with respect to those defined for one or more other species or for the substratum (see Table 3). The reliability of these analyses is verified by reconsidering the graphic output files, recognizing the incorrect assignment of the pixels and finally collectively considering the related measures (crossed analyses). The species abbreviations are listed in Table 1.
Measuring the spread of hyphae penetrating within stonework
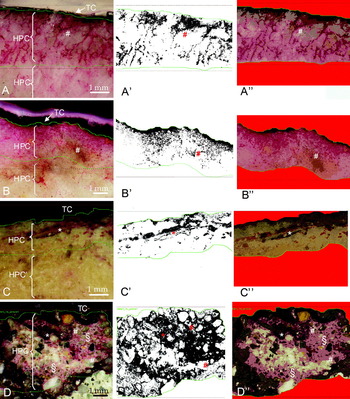
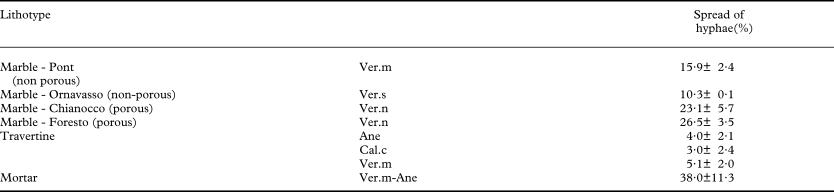
All the samples examined showed a well-developed HPC, that displayed different penetration patterns depending on both the lithotype and the lichen species (PAS-stained hyphae in violet; Fig. 4A–D). The graphic input and outputs of the image analyses performed for the different case studies are illustrated in Fig. 4, which shows the micro-photographs obtained under the stereomicroscope (Fig. 4A–D), how the software recognizes the substratum and the HPC in the micro-photographs (white and black areas, respectively; Fig. 4A’–D’), and how it assigns the original pixels to the different colour classes defined for the substratum and for the penetrating hyphae (Fig. 4A”–D”). The black and white graphic outputs highlight the spread of the HPC within the substratum, the hyphal structures being clearly recognizable in the different kinds of marbles and travertine (Fig. 4A’–C’). In the case of mortar, the software identified both areas occupied by hyphal structures and adjacent areas marked by a violet-halo as HPC (Fig. 4D”). Because of the staining by PAS, the hyphal structures mainly stand out against the white and grey colour of the different kinds of marbles and travertine, respectively. Accordingly, the colour groups used to define HPC and these substrata differed significantly for all the HSI co-ordinates (Table 5). In the case of mortar, only the hue values of the colour groups defined for the stained hyphae and for the heterogeneous substratum, respectively, differed significantly.
Graphic input (A–D) and outputs (A’–D’ & A”–D”) of image analyses through colour-based pixel classification of PAS-stained polished cross sections of lithic substrata colonized by Verrucaria macrostoma (A, C, D) and V. nigrescens (B). A–D, micro-photographs acquired in stereomicroscopy; A’–D’, recognition of the substratum (white areas) and of the hyphal penetration component (black areas) by the software; A”–D”, assignment of the original pixels by the software to the colour classes defined for the substratum (grey) and for the PAS-stained hyphae (violet). A, Pont Canavese non-porous marble; B, Chianocco porous marble; C, travertine; D, mortar. Below the thalline component (TC), analyses deal with the areas of massive development of the hyphal penetration component (HPC; areas delimited by two green lines); areas where the hyphal penetration component develops sporadically (HPC’) were not included in the analyses. Sharp violet-stained structures correspond to hyphae (#), hyphae and bundles of hyphae (*) penetrating the rocks; §, areas showing a pink-violet halo possibly correspond to areas where extracellular polymeric substances surround lichen hyphae.

Hue, saturation and intensity (HSI) co-ordinates of the colour classes taught to the software to identify the substrata and the PAS-stained hyphal penetration component (HPC).
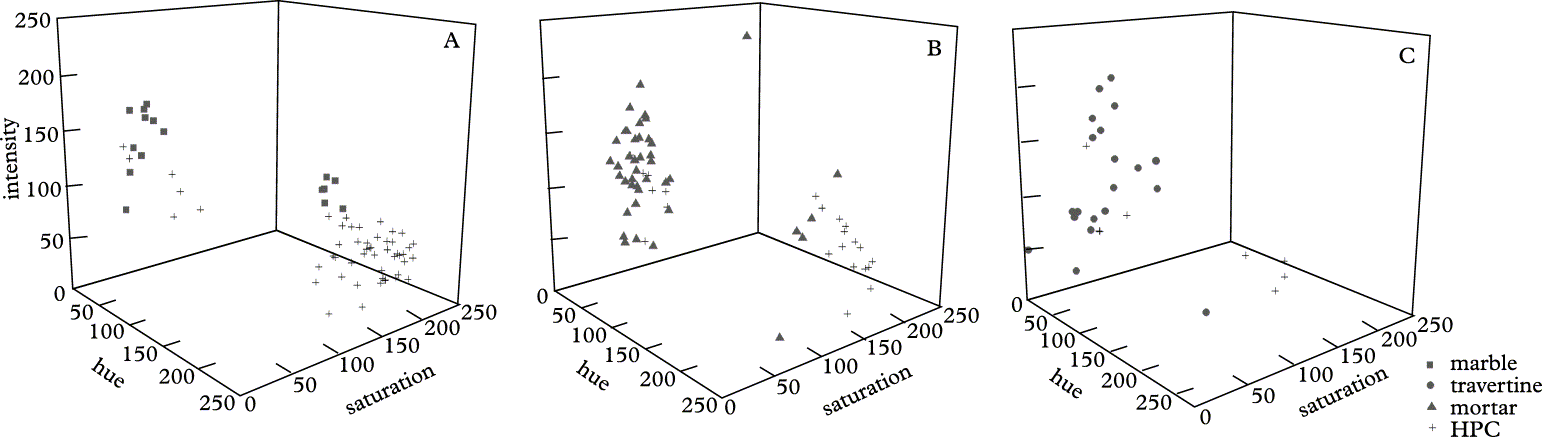
Significant differences (Tukey's test) between the groups of colour classes used to define the substrata and HPC (i.e. PAS-stained hyphae) with reference to the HSI colour model

-, not significant.
The spread of the hyphae penetrating in the different lithotypes is described in Table 6.
Spread of hyphae within stonework measured by WinCAM in the examined case studies
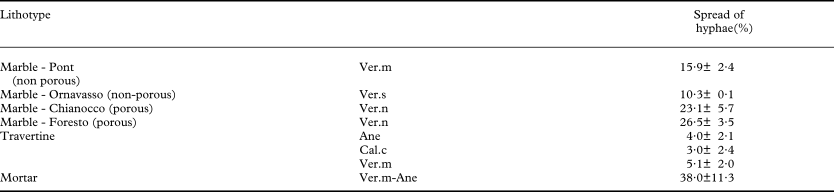
The species abbreviations are listed in Table 1.
Discussion
Lichen cover on stonework
Since the small size of lichens makes their analysis in the field extremely difficult, observation of stone substratra in the laboratory following destructive sampling was the most reliable method for determining species diversity and cover (Roux Reference Roux1990; Nimis Reference Nimis1991). However, as this method is difficult to carry out on any large scale for environmental conservation reasons (Nimis Reference Nimis1991), it is obviously generally inapplicable to the stone cultural heritage, where only conservative approaches are possible.
This study shows that the acquisition of high definition digital images in the field brings information to the laboratory, which partially resembles what could previously only be obtained by destructive sampling, but in a way that is sensitive to the needs of conservation. The digital images do not facilitate species identification, but they allow species already identified during a preliminary (and necessary!) floristic survey to be recognized. The cover of the lichen species can then be quantified in the laboratory using an image-analysis approach. As relevés can be reduced to the acquisition of digital images, i.e. a simple technical activity, fieldwork is less time consuming and does not require expert personnel; furthermore, digital ‘relevés’ can be repeated in the long term and are suitable for random sampling strategies. Moving the relevé analysis out of the field, specialist personnel can then focus their expertise in the laboratory, and substitute the subjective visual estimation of species cover with quantitative image analysis procedures with commensurate improvement in data quality.
Image analysis has been shown to be a useful tool to quantify plant species cover in vegetation studies, mainly concerning the herbaceous layer (e.g. Dietz & Steinlein Reference Dietz and Steinlein1996). Improvements in computers, image analysis software and aerial imagery are presently improving the opportunities for the objective measurement of plant cover in studies on phanerogamic vegetation in large and ecologically diverse landscapes, with reductions in costs and sampling time (Seefeldt & Booth Reference Seefeldt and Booth2006). Digital image analysis techniques were previously applied at the small lichen scale to measure the growth rate of epiphytic species in air-polluted areas (Purvis et al. Reference Purvis, Erotokritou, Wolseley, Williamson, Read, Nimis, Scheidegger and Wolseley2002) and, in lichenometry, to quantify the total lichen cover on rocks from photographs (McCarthy & Zaniewski Reference McCarthy and Zaniewski2001). In this latter case, however, the applicability of the technique was limited to uniformly coloured lithotypes, such as quartzites that are clearly different from the lichens, because of limitations imposed by the adopted software (McCarthy & Zaniewski Reference McCarthy and Zaniewski2001). In the present study, we processed the images of different lithotypes, showing chromatic variations and different lichen biodiversity, through a colour based pixel classification. We have used our expertise to train the software as to which colours pertain to the substratum and which pertain to the different lichen species. It is worth noting that such a definition of colour classes, the subjective step of the method, was performed on images acquired by the scanner, which offers a ×5 magnification of the surfaces, thus enabling a more detailed observation than that possible in fieldwork, and a wider observation field than that observed from macro photos or under stereomicroscopy. Although thallus colour is an important species specific character, its definition is often problematic (Wirth 1995) and a strong intraspecific variability is often recognized; moreover, different colours can characterize different parts of each individual such as the vegetative thallus and the reproductive structures. Accordingly, several colour classes were used to define each lichen species (and the substratum, which also showed different colours in different parts) in each analyzed picture. Graphic outputs offered information on the main critical point concerning each analysis and offered the possibility of checking the recognition of each species by the software and of heuristically adjusting the colour class settings if necessary, thus progressively improving the quality of the analysis. Moreover, by analyzing the distribution of the colour class groups in terms of HSI co-ordinates, it was possible to evaluate which species were recognized and which could not be recognized and, consequently, which species were correctly or wrongly quantified in terms of cover. In particular, groups of colour classes which did not significantly differ in any of the HSI co-ordinates, as they were partially or completely overlapped or nested, could lead to an incorrect classification of the orphan pixels.
Species with colours that differ greatly from those of the substratum and from most other lichen species, such as the brilliant Caloplaca and Candelariella species on the different kinds of marbles examined, were defined using groups of colour classes which differed significantly from those of the substratum and of other lichen species on the basis of two or more HSI parameters. Consequently, each orphan pixel that pertains to these species is likely to be correctly recognized. On the other hand, species with colours which closely resembled those of the substratum and/or of other species, such as Lecanora dispersa on the unveined white marble-II, Caloplaca crenulatella and Candelariella aurella on the mortar, and Phaeophyscia orbicularis and the grey sterile thalli on the veined marble-III, were defined using groups of colour classes which did not differ significantly on the basis of any of the three HSI parameters. In these cases, orphan pixels might be wrongly or correctly assigned, depending on their dispersion amplitude around the taught colour classes; the presence of no statistical difference between two colour groups, in terms of HSI parameters, can thus signal critical cases which have to be verified directly on the images. By reconsidering such cases, it was possible to establish that the software correctly distinguished Lecanora dispersa apothecia with respect to their substratum and Caloplaca crenulatella and Candelariella aurella, respectively. Pixels assigned to Phaeophyscia orbicularis and sterile grey thalli were instead assigned to the same colour classes in the output images, suggesting that the covers of these two species should be considered together or that their colour classes should be redefined. Such examples not only illustrate that the image-analysis technique quantifies a lichen species' cover, but that it is also possible to check the calculation.
Species overlooked during a preliminary floristic examination may be found in the images using the ×5 magnification and their cover can be quantified. In this case, however, new fieldwork is necessary to take samples for their identification. On the other hand, rare or inconspicuous species can be overlooked, but they are likely to have a limited influence on stonework and could be disregarded with minimum risk when decisions are taken on the preservation of stone cultural heritage.
Spread of hyphae penetrating within stonework
Light and electron microscopy observation of fractured samples and polished cross sections of lichen-encrusted rocks has allowed us to investigate the lichen-rock interactions in situ (Ascaso et al. Reference Ascaso, García del Cura, de los Ríos, St. Clair and Seaward2004; de los Rìos & Ascaso Reference de los Ríos and Ascaso2005). Several workers have highlighted the volume of lichen influence within stone substrata with reference to the average or maximum depth of the HPC (e.g. Chen et al. Reference Chen, Blume and Beyer2000 and references therein; Favero-Longo et al. Reference Favero-Longo, Castelli, Salvadori, Belluso and Piervittori2005). On the other hand, to the authors' knowledge, the spread of hyphae within rocks has never been considered, even though this three-dimensional spread is intuitively a more appropriate measure of how much a lichen might affect the rock conservation through physical and chemical processes.
In this study, the development of HPC was first quantified, in terms of hyphal spread, using colour differences between the substratum and the stained hyphae to perform image analysis based on pixel classification. Image analysis of PAS-stained tissues has already been performed in the medical research field (Becerra et al. Reference Becerra, Soares, Bruno, Siqueira, Oppenheim, Offner and Troxler2003; Vielhauer et al. Reference Vielhauer, Berning, Eis, Kretzler, Segerer, Strutz, Horuk, Gröne, Schlöndorff and Anders2004). In our research, strong differences in colour, that resulted from the HSI analysis, and the characteristic hyphal structure prevented any potential misrecognitions, similar to those described for cover analyses. Even mortar, with a more composite structure than the other lithotypes, was clearly distinguished from the stained hyphae. Although the hyphae observed in cross sections beneath a thallus probably develop from the thallus, the occurrence of hyphae of other lichenized or free living fungi cannot be ruled out (Bjelland & Ekman Reference Bjelland and Ekman2005). The result of the analysis might thus be interpreted as the quantification of the spread of hyphae associated with a lichen thallus and its complex associated microcosm, which is increasingly being taken into account in literature on bioweathering (Banfield et al. Reference Banfield, Barker, Welch and Taunton1999; de los Rìos & Ascaso Reference de los Ríos and Ascaso2005). Accordingly, microorganisms associated with the lichen microcosm could be responsible for the violet halos observed adjacent to hyphae within mortar, where PAS probably stains extracellular polymeric substances (Vicente-García et al. Reference Vicente-García, Ríos-Leal, Calderón-Domínguez, Cañizares-Villanueva and Olvera-Ramírez2004) which extend the lichen weathering action.
Since image analysis through colour-based pixel classification allows a quantification of both the lichen species cover on the surface of stone substrata and of the hyphal spread within them, this technique appears to be the best suitable to the evaluation of the volume of influence of lichens on stonework and, consequently, to support decisions on the preservation of our stone cultural heritage.
The authors express their gratitude to Lorenzo Appolonia and Gaetano De Gattis (Soprintendenza per i Beni e le Attività Culturali della Valle d'Aosta) for their kind permission to carry out fieldwork in the Roman Theatre of Aosta. This research was funded by the CRT Bank – Alfieri Project.