Raw ewes' milk semi-soft cheese (RESS-cheese) constitutes an important manufactured product in Portugal, with high added value. Serpa is one of the most appreciated Portuguese RESS-cheeses and it is produced in the south eastern region of Portugal. It is a creamy, fat and semi-soft cheese, originated from a slow curd syneresis after coagulation with a vegetable rennet infusion (Cynara cardunculus L.) (Roseiro et al. Reference Roseiro, Garcia-Risco, Barbosa, Ames and Wilbey2003a). Because Serpa cheese is made from raw ewes' milk, on traditional farms, a minimum ripening period of 30 d is necessary to ensure food safety. The production of lactic acid during this ripening period reduces the pH, improves whey expulsion from the curd, affects cheese flavour and inhibits the growth of the pathogenic bacteria. This is one of the several control methods available to the cheesemaker to prevent disease outbreaks caused by cheese (Zottola & Smith, Reference Zottola and Smith1991). Therefore, Serpa cheese can only be sold after this period, which is required to fulfil Serpa cheese Appellation of Origin regulation (Portuguese legislation). For these safety reasons, the estimation of the ripening time, i.e., how many days of ripening the cheese has undergone during maturation (cheese age), has recently become an important issue, since cheeses do not display the manufacture date (Pinho et al. Reference Pinho, Mendes, Alves and Ferreira2004; Poveda et al. Reference Poveda, Garcia, Martin-Alvarez and Cabezas2004; Ferreira et al. Reference Ferreira, Veiros, Pinho, Veloso, Peres and Mendonca2006).
For consumers, the most important feature of RESS cheeses is the creamy mouth feel attribute. The structural properties of cheese can be described by its viscoelastic behaviour and are mostly dictated by the properties of the continuous network formed by the protein crosslinks. Other important cheese constituents that contribute to the overall viscoelastic behaviour, while modifying the properties of the protein network, are fat and moisture (Zalazar et al. Reference Zalazar, Zalazar, Bernal, Bertola, Bevilacqua and Zaritzky2002). Measurements using small amplitude oscillatory shear (SAOS) allow the quantification of the elastic and viscous contributions to the cheese properties. Elastic response in cheese is primarily due to the protein-protein bonds. In contrast, the viscous dissipation in cheese may be due to the lubrication effect of fat on this matrix material (Park, Reference Park2007).
Cheese texture is affected by factors that determine structure, such as milk composition, moisture content, salt, pH and degree of proteolysis during ripening (Da Cunha et al. Reference Da Cunha, Viotto and Viotto2006). Proteolysis is the most complex of these events and, possibly, the most important in the flavour and texture development (Sousa et al. Reference Sousa, Ardo and McSweeney2001). Cheese textural changes during ripening results in smoothing and softening, due to a prevalence of proteolysis of the αs1-casein (Al-Otaibi & Wilbey, Reference Al-Otaibi and Wilbey2006), or hardening, when the drying process dominates (Awad, Reference Awad2006). These opposing effects on the rheological properties of the cheese were explained by Dewettinck et al. (Reference Dewettinck, Deroo, Messens and Huyghebaert1999) : proteolysis reduces the storage modulus while drying has the opposite effect. However, it is well established that cheese softening, induced by proteolysis, prevails when cheese is made from raw milk (Rosenberg et al. Reference Rosenberg, Wang, Chuang and Shoemaker1995).
Little is known about the physical and biochemical mechanisms that underline the ripening process of the traditional Serpa RESS-cheese. Therefore, the aims of this study were: (i) to monitor the structural changes of Serpa RESS-cheeses during ripening, considering a range of rheological (mechanical spectrum – G′1Hz, tanδ1Hz, log α and b; texture analysis parameters – hardness and adhesiveness), colour (L*, a* and b*) and chemical parameters (moisture, fat, acidity, pH, total nitrogen, water soluble nitrogen, non-protein nitrogen and amino acidic nitrogen), and (ii) to develop a multiple linear regression model that will allow the estimation of the duration of the ripening period (cheese age), using chemical, colour an rheological data. In this study, the use of cheeses manufactured by two different producers was studied to overcome the variability inherent in an essentially traditional process.
Materials and methods
Cheese samples
For this study, two producers were selected for sample collection on the basis of the quality and regularity of their Serpa cheese production. Cheeses were manufactured from slow curd syneresis, after raw ewes' milk coagulation (30°C/45 min) with a Cynara cardunculus L. infusion. The curd was pressed and subjected to 42 d ripening, performed in two successive controlled rooms: two weeks of ripening performed in a controlled temperature (8–9°C) and relative humidity (92–97%) room and, afterwards, in a second ripening room, at 10–13°C and at 85–90% relative humidity (Roseiro et al. Reference Roseiro, Wilbey and Barbosa2003b). From each producer, samples were collected at different ripening stages. At producer 1, groups of 2 cheeses were picked after 0, 7, 14, 21, 28 and 35 d ripening. At Producer 2, groups of 2 cheeses were picked after 0, 3, 7, 14, 21, 28, 35 and 42 d ripening. Cheese samples were sent to the laboratory in refrigerated boxes and analysis started on the same day. One cm layer of the upper surface of each cheese was removed in order to expose a homogeneous surface of the inside allowing colour, pH and texture determinations. Furthermore, a cheese portion (approximately 0·15 kg) was removed and conserved (4°C) in a Petri dish to be used for the rheometer determinations.
Dynamic rheology
Rheological measurements were performed at 20±1°C using a controlled-stress Rheometer RS-75 (Haake, Germany), with a serrated parallel plate geometry of 20 mm diameter, in order to prevent slippage (Rosenberg et al. Reference Rosenberg, Wang, Chuang and Shoemaker1995). A stress sweep determination was performed on a different aliquot to ascertain linearity. The mechanical spectrum (frequency sweeps) was performed on another aliquot of the same sample at a constant shear stress of 200 Pa (samples of 0–14 d) and at 50 Pa (samples of 21–42 d). All frequency sweeps were conducted with oscillation frequencies ranging from 0·001 to 100 Hz in three different samples (triplicate). The output of the rheometer measurements was the variation of storage modulus G′ (Pa), loss modulus G″ (Pa), loss tangent tanδ (G″/G′) and complex viscosity |η*| (Pa.s), as a function of the frequency f (Hz). From the later, log α and b values were obtained by logarithmic fitting of experimental data to the Power Law, according to eqn (1) (Kasapis et al. Reference Kasapis, Paraskevopoulou, Kiosseoglou and Alevipoulus1997):

The log α value is a function of the viscoelastic proprieties that depend on the material consistency while the b value reflects the dependency of viscoelastic properties on the frequency variation.
Texture analysis
A texture analyser TAHDi (Stable Micro Systems, Godalming, UK), equipped with a 250 N load cell, was used to perform the texture analysis at 20±1°C. The procedure was implemented by puncture with a 20 mm diameter aluminium cylindrical probe, at a penetration depth of 20 mm (the height of the sample was 50 mm), with a crossed speed of 1 mm s−1. Texture measurements were performed in triplicate: one was performed in the core and the two others were performed in the rind of the cheese. From the force vs. time texturograms, two parameters were obtained: hardness and adhesiveness (Van-Hekken et al. Reference Van-Hekken, Tunick and Park2005).
Colour measurement
The colour analysis was performed using a colorimeter CR 300 (Minolta, Osaka, Japan). The L*, a*, and b* colour measurements were determined according to the CIELAB colour space, using a standard white tile (L*=97·10, a*=−4·88, b*=7·04) for calibration (Pinho et al. Reference Pinho, Mendes, Alves and Ferreira2004). Colour measurements were repeated ten times: five measurements in the core and another five in the rind of the cheese.
Chemical characterization
Titrable acidity, moisture content and total nitrogen (TN) were determined according to AOAC (1990) methods. In addition, pH was measured using a penetration electrode (Metrohm, Switzerland) and fat content through the Van Gulik method (ISO 3432, 1975). Water soluble nitrogen (WSN) was quantified performing an aqueous extraction of the N-components (Kuchroo & Fox, Reference Kuchroo and Fox1982), followed by nitrogen determination using the micro-Kjeldahl method using a Kjeltec System 1030 distilling+titration unit system (Tecator, Höganäs, Sweden). Non-protein nitrogen (NPN) was determined by the N-component precipitation with a trichloroacetic acid solution (1·2 g kg−1) and N determination of the filtrate (filter paper Whatman No. 42) using the micro-Kjeldahl method (Freitas et al. Reference Freitas, Fresno, Prieto, Malcata and Carballo1997). Aminoacidic nitrogen (AN) was determined by the ninhydrin method (Pearce et al. Reference Pearce, Karahalios and Friedman1988). All chemical analyses were performed in triplicate.
Statistical treatment of data
The average, standard deviation, and 0·95 confidence interval values were determined for each parameter. Experimental data were subjected to One-way ANOVA (pairwise comparison of means with Scheffé test), to correlation analysis and to principal component analysis (PCA), which will allow the evaluation of RESS-cheese changes during ripening. Estimation of Serpa cheese length of the ripening period was performed with a stepwise MLR, which combines the backward elimination and forward selection regression methods (Draper & Smith, Reference Draper and Smith1998). The level of significance, chosen for variable selection, was 0·05. Data were analysed using STATISTICA 6.0 (StatSoft, Tulsa, USA).
Results and discussion
Structural and chemical monitoring
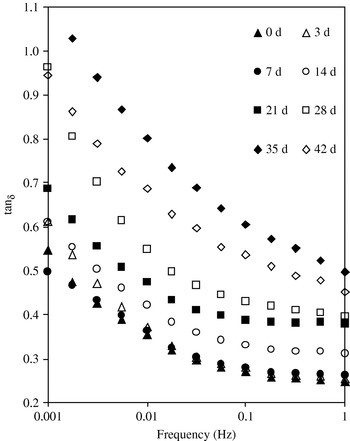
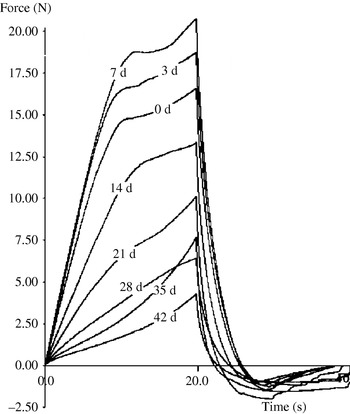
Structural changes occurring during the ripening period of the traditional Serpa cheese were evaluated. Data (not shown) concerning the mechanical spectra and loss tangent profile (Fig. 1), indicated a relatively strong structure, comparable to a gel, with a low dependence on frequency, at the beginning of ripening period, especially in samples 0–21 d. However, the cheese got less and less structured to the end of ripening as can be observed in Fig. 1, by the increased dependence of G′ and G″ on frequency after long periods of ripening, 28, 35 and 42 d. The critical crossing point, G′=G″, is well shown at 35 d and this is the spectre of a very weak gel, sometimes considered too weakly structured to form a gel, being usually found in emulsion systems (Franco et al. Reference Franco, Raymundo, Sousa and Gallegos1998). As expected, texture data were in agreement with the observed mechanical spectra: in the first 14 d, the curves were characteristic of a soft solid with a fracture point in the first peak (Fig. 2) (Szczesniak, Reference Szczesniak1963). Subsequent curves for 21 and 28 d showed a small shoulder as a consequence of smooth texture and, further ripening time (35 and 42 d), showed the typical profile for a highly viscous fluid under penetration.
Loss tangent profiles for samples with 0, 3, 7, 14, 21, 28, 35 and 42 d (producer 2, mean values, n=6).

Texture profile for samples with 0, 3, 7, 14, 21, 28, 35 and 42 d (producer 2, mean values, n=6).

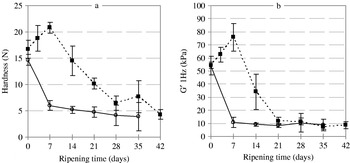
Hardness values decreased during ripening, from around 15 N, at the beginning, to values around 5 N at the end of the ripening period (P<0·05; Fig. 3a). In the same manner, the storage modulus at 1 Hz changed from about 54 kPa at the beginning to a value of around 10 kPa (P<0·05), which remained stable until the end of ripening (Fig. 3b). However, in producer 2 these variables presented a slight increase at the beginning of the ripening process and a delayed decrease in hardness and G′ 1 Hz. Nevertheless, at the end of the ripening period, hardness and storage modulus were similar for cheeses originated from both producers. According to the results observed in those figures, hardness and storage modulus can be considered as cheese structural indicators.
Changes in the hardness (a) and storage modulus (b) for the producer 1 (—○—) and producer 2 (- - - -■- - - -) during ripening. Y error bars shows the 95% confidence level.

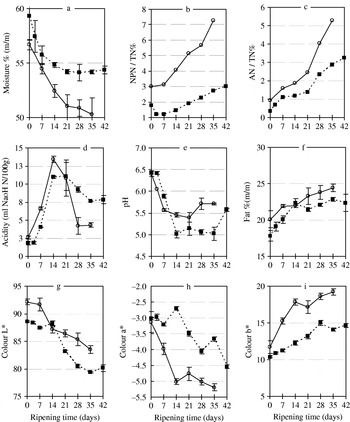
At the start of the study (0 d) cheeses from both producers presented similar structural indicators (Fig. 3). However, a delay in the ripening process was evident in the cheese of producer 2, which could be explained by the higher drying rate observed in the first week (−0·31% moisture/day for producer 1 and −0·51% moisture/day for producer 2; Fig. 4a) and by the initial decrease verified in the proteolysis indicator NPN/TN% (Fig. 4b). Roseiro et al. (2003a), studying RESS-cheeses, identified a proteolysis dependence during the production/ripening process. Therefore, differences in the ripening dynamics of raw ewes' milk cheeses seem to depend primarily on the quantity and quality of its natural enzymes which can, therefore, be considered main attributes of the raw milk quality (Tavaria et al. Reference Tavaria, Reis and Malcata2006).
Changes in: moisture (a), non-protein-N fraction (b), aminoacidic-N fraction (c), acidity (d), pH (e), fat (f) and colour parameters: L* (g), a* (h) and b* (i) for the producer 1 (—○—) and producer 2 (- - - -■- - - -) during ripening. Y error bars shows the 95% confidence level.

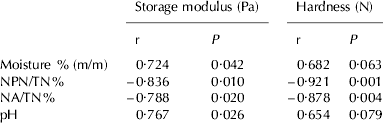
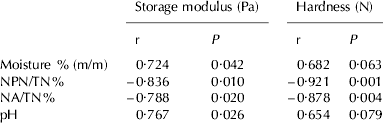
The proteolysis indicators and pH showed a high correlation (P<0·05) among the structural indicators (Table 1). In addition, the highest correlation observed was between hardness and NPN/TN (−0·92), suggesting that proteolysis explained the Serpa cheese softening. The correlation between moisture and structural indicators was positive. If structural changes were influenced by the drying process, we could have expected a negative correlation between those properties. This means that the effect of drying, on the cheese structural changes, was overtaken by the pH and proteolysis effects. Taken together, these data and the information in Fig. 4a–e, suggest that softening of Serpa cheese is essentially characterized by an increase in proteolysis rate and a considerable pH decrease.
Correlation results (r) and P values between structural indicators (storage modulus and hardness) and proteolysis indicators (NPN/TN% and NA/TN%) and pH
The pH profile was different in Serpa cheeses originated from the different producers (Fig. 4e). The minimum pH value was higher for cheeses coming from producer 1 (pH 5·4) compared with cheeses coming from producer 2 (pH 5·1). Nevertheless, the final pH at the end of the ripening period was similar in cheeses of the two producers: 5·7 for producer 1 and 5·6 for producer 2. Therefore, the main difference between cheeses originated from the two producers was the time taken to achieve the final pH rise: 28 d for producer 1 and 42 for producer 2. In addition, due to lactose metabolism acidity increased during cheese ripening up to d 14, and then decreased until the end of the ripening period (Fig. 4d). The falling pH (Fig. 4e) induced an effect of micelle demineralization (Ca bonds) and consequent dissociation, which were also responsible for cheese softening. This phenomenon causes a progressive dissociation of para κ particles into small casein aggregates and, therefore, in the protein links of the cheese matrix (Ramkumar et al. Reference Ramkumar, Campanella, Watkinson, Bennett and Creamer1998; Boutrou et al. Reference Boutrou, Famelart, Gaucheron, Graet, Gassi, Plot and Leonil2002; Hassan et al. Reference Hassan, Corredig, Frank and Elsoda2004). Therefore, a reduction of the solid-like properties can be observed in samples presenting low pHs (28–42 d; Fig. 1).
Finally, the evolution of cheese colour was monitored during the ripening period. The data, presented in Fig. 4g–i, revealed a decrease in luminosity and a slight increase in both greenness and yellowness during cheese ripening, a similar result has been reported (Pinho et al. Reference Pinho, Mendes, Alves and Ferreira2004). In addition, the highest average values presented by the b* value in producer 1 could be connected to the higher fat content of their cheeses (Fig. 4f).
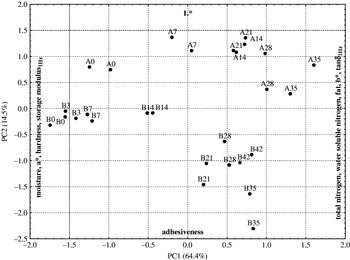
Ripening dynamic using PCA approach
PCA results, presented in Fig. 5, suggest that samples from the different producers showed differences in adhesiveness and luminosity. Samples from producer 1 were, in general, more luminous and less adhesive than those from producer 2 and these parameters were mostly explained by PC2. These were the main parameters that allow the differentiation of origin. In contrast, changes in Serpa cheese properties during ripening were mostly explained by PC1. For all parameters explained by this principal component, changes occurred faster at the beginning of the ripening process (14 d for producer 1 and 21 d for producer 2), and slowed down progressively towards the end of ripening. This can be deduced from the relative distance among the plotted samples: large distances between 0 d and 14 d (producer 1) or 21 d (producer 2) samples, and shorter distances between the other samples collected at the end of the ripening. This higher rate of the biochemical reactions at the beginning of the ripening process may derive from the use of raw milk, as suggested by other authors (Rosenberg et al. Reference Rosenberg, Wang, Chuang and Shoemaker1995; Awad, Reference Awad2006).
PC1 vs. PC2 projection of samples. A0, A7, A14, A21, A28 and A35 are the samples of producer 1 with different ripening day times, and B0, B3, B7, B14, B21, B28, B35 and B42 are the samples of producer 2 with different ripening day times.

Estimation of Serpa cheese ripening time
A MLR analysis using the collected structural, chemical and colour data, was performed with the objective of developing a model that could allow the estimation of Serpa cheese ripening time (cheese age). This model might be useful to predict and guarantee food safety in Serpa Cheese. For this purpose, the model described by eqn (2), was followed (Draper & Smith, Reference Draper and Smith1998).

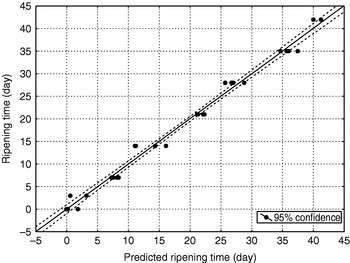
In eqn (2), Rt represents ripening time, χ1 … χn are structural, chemical, and colour parameters, β0 … βn represent model coefficients and ε is the additive error term. The data demonstrated that ripening time (age of cheeses) could be estimated with the 8 parameters (SN/TN, AN/TN, pH, a*, b*, log α, b and tanδ1Hz). A graphical representation of the observed ripening time values vs. the predicted ripening time values was performed and it is presented in Fig. 6. The estimation of the cheese ripening period was performed for other types of ewes' milk cheeses using only chemical parameters based on quantification of protein fractions of αS1-casein and αS1-I peptide. This ripening time prediction model showed an estimation error of 2·5 d (Ferreira et al. Reference Ferreira, Veiros, Pinho, Veloso, Peres and Mendonca2006), and this was the smallest value found. When only dry matter, pH and aW parameters were used, the prediction of the ripening period suffered an estimation error as high as 11·9 d (Poveda et al. Reference Poveda, Garcia, Martin-Alvarez and Cabezas2004). Using both instrumental texture and colour parameters the error obtained forecasting ripening time was 4·2d (Pinho et al. Reference Pinho, Mendes, Alves and Ferreira2004). In the present proposed model, observed in eqn (3), the estimation error was 1·74 d and the adjusted R2 was 0·98 (P<0·0001). Therefore, using a combination of chemical, colour and rheological parameters we were able to obtain a MLR with a more satisfactory quality.
Estimation of cheese ripening time.


For safety reasons the model obtained in this study can assume a remarkable importance since, although it is not mandatory to display cheese age, it can be checked using the described approach. It is important to emphasize that this equation is valid only for Serpa Cheese and must be checked when an extrapolation to other RESS-cheeses is considered.
Conclusion
In this study a comprehensive analysis of several physical and biochemical parameters that characterize the ripening process of Serpa cheese was performed. Together the data suggest that from the several rheological parameters analysed, hardness and storage modulus were the most adequate indicators of the RESS-cheeses softening process during ripening. In addition, softening of Serpa RESS-cheeses occurring during ripening can be explained by changes in the protein network, such as the breakage of the protein-protein bonds, which occurred during proteolysis, and to the dissociation of sub-micelles caused by a pH decrease. Data presented here confirm that these processes occur mainly during the first 2–3 weeks of Serpa cheese ripening. Estimation of the ripening period, using 3 chemical, 2 colour and 3 rheological parameters, was possible with a standard error of 1·74 d and an adjusted R2 of 0·98 (P<0·0001). In the future, this equation should be used to assess the safety of Serpa cheese; this product is obtained from raw ewes' milk and, therefore, should not be sold before completing at least 30 days of ripening.