I. INTRODUCTION
Radiofrequency identification (RFID) has gained considerable growth in the last decade and remains in the front end of the general research and development sector concerning the remotely receiving and transmitting data using radiofrequency (RF) waves. Nowadays the RFID technology providing automated wireless identification and tracking capability and being more robust than the barcode system, has shown a commercial worldwide deployment following frequency allocation in the ultra-high-frequency (UHF) band, ranging from 860 to 950 MHz [Reference Duroc, Andia Vera and Garcia Martin1–Reference Duroc, Andia Vera and Garcia Martin3].
One of major challenges in today’ s RFID technologies that could potentially impede their practical implementation is the design of small-size tag antennas with high efficiency and effective impedance matching to IC chips with typically capacitive reactance [Reference Rao, Nikitin and Lam3]. These antenna requirements are essential to optimize the RFID system power performance, especially for passive configurations where the only energy source is the incoming reader energy.
Evolutionary algorithms (EA) are suitable optimization tools for solving the above-described design problem. Several EAs have been used to antenna design problems [Reference Basu4–Reference Dib6]. Genetic algorithms (GA) have been applied successfully to RFID antenna design [Reference Marrocco7]. The Artificial Bee Colony (ABC) algorithm [Reference Karaboga and Basturk8] models the foraging behavior of honey bee swarm. The ABC algorithm has been applied successfully to RFID tag design [Reference Goudos, Siakavara and Sahalos9, Reference Goudos, Siakavara and Sahalos10]. The guided Artificial Bee Colony (GABC) [Reference Zhu and Kwong11] is an improved ABC algorithm, which modifies the solution search equation by applying the global best (gbest) solution to guide the search of new candidate solutions in order to improve the exploitation.
In this paper, we extend our earlier work [Reference Goudos, Siakavara and Sahalos9, Reference Goudos, Siakavara and Sahalos10] to design new RFID tags. We propose a new structure using meander lines and loads. This new structure offers the ability to control the tag input impedance by modifying the spiral layout or shape and the number of loads or meander lines. We apply a different algorithm namely the GABC algorithm. Additionally, GABC is compared with other EA. The comparison is performed on a spiral tag antenna design case. Our goal is to design printed tag antennas printed on thin dielectric with high gain and conjugate matched at 867 MHz to the IC chip Higgs_3 of Alien Com.
II. PROBLEM FORMULATION
The first difficulty in designing a tag antenna arises from the requirement to be conjugate matched to the IC chip, which has input impedance with relatively low real part and high capacitive imaginary part. Therefore, the antenna's input impedance must have an inductive imaginary part of equal value. This requirement leads the antenna, inevitably, to operate out of resonance and entails downgraded indices of operation, such as low gain, not good efficiency, etc. Moreover, the demand for the tag antenna to be of small size is also opposed to the desired attribute of relatively high gain.
Therefore, the optimization goals for RFID tag design are gain maximization, conjugate matching, and small size. The objective function is therefore defined by:
 $$\eqalign{& F(\bar x) = - G(\bar x) + \Xi \times \vert \max \{ 0,\vert \Gamma \vert - 0.3\} \vert, \cr & {\rm subject}\,{\rm to} \cr & {L_x}(\bar x) \le {L_{x\max}}, \cr & {L_y}(\bar x) \le {L_{y\max}},}$$
where  $\bar x$ is the vector of the antenna geometry, G is the antenna Gain calculated,
 ${L_x}(\bar x)$ and
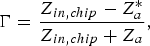
 ${L_y}(\bar x)$ are the calculated antenna dimensions along the x- and y-axes respectively, L xmax and L ymax are the corresponding maximum allowable tag dimensions, Ξ is a penalty factor, and Γ is the (load-dependent) reflection coefficient of the tag antenna–load system, which is computed by
 $$\Gamma = \displaystyle{Z_{in,chip} - Z^{\ast}_a \over Z_{in,chip} + Z_a},$$
where Z in, chip = R in, chip + jX in, chip is the chip input impedance and Z a = R a + jX a the tag input impedance, respectively. The computation of the objective function requires the use of a full-wave numerical method. The spiral antenna design case is modeled in FEKO. To integrate the in-house source code of the EA with FEKO, a wrapper program is created. All algorithms are compiled using MS Visual C++ 2010.
III. RFID TAG STRUCTURE
Several geometrical configurations have been employed for the design of tag antennas and have been proved effective in meeting the operating requirements [Reference Rao, Nikitin and Lam3]. In the present work, the spiral-shaped antenna printed on a dielectric slab was selected because this configuration depends on several geometrical parameters such as the number and the length of the spirals, the distance between them, the width of the printed lines, etc. Thus, it is expected that among the large number of combinations of these parameter values at least one would lead to a tag antenna with not simply satisfactory performance but with really a very good one, especially when the design follows an optimization procedure.
Our motivation was to explore the potential of a spiral shaped antenna to meet the requirements of operation of a RFID tag. A theoretical study was conducted first. A spiral of ordinary shape was initially considered. Its input impedance was calculated approximately by a hybrid combination of the Transmission Line Model and the low of electromotive force induced to the spiral. To apply this model it was supposed that the spiral comes from an open terminated transmission line of two conductors bend around the input terminals of the line at which a generator or, in the case of a tag, the IC element is connected conductively. At this point also the input impedance is calculated. The radiated field and the gain were calculated via the ordinary method of Green functions.
Based on the above theory, the performance of the spiral antenna versus the number and the length of its turns, the distance between them, and the modification of the shape of its segments in meander configuration, instead of straight lines, was studied. The results showed that dense spirals of small size and with large number of turns have larger gain than that of less dense spirals with smaller number of turns and larger size. It was also ascertained that two modifications of the layout of the ordinary spirals would lead to further reduction of their size without downgrading of their performance. The first one was the formation of the spirals’ branches by the meander shape. In this way, the spirals fill the area they occupy more effectively and as they acquire larger length, while the space they take up would be smaller. The second modification concerns to the loading of the spirals at their open ends via parts of transmission printed strips with characteristic impedance different from that of the spirals. Applying the Transmission Line model and describing approximately the current as that of an ordinary line terminated to these loads, it was found that the spirals resonate at lower frequencies, depending on the length of the loads, on the width of the strips etc. So, in order for a loaded spiral to resonate at a frequency equal to the respective unloaded, the size of the loaded one had to be reduced. Concluding, this procedure would work as a minimization process.
It was considered that both the above techniques when applied simultaneously would lead to spirals with small size and satisfactory performance. To obtain this, the trial and error method would be inadequate as such spirals are geometrically defined by several parameters and additionally conjugate matching to the IC had to be achieved. To solve this problem, an optimization algorithm had to be used. The optimization algorithm as a robust and effective process gave us the potential to further modify the spirals inserting loads not only at their terminals but also along their branches. In the following, we present the details of the spirals’ shape geometrical description. The comparison between spirals with the same size but with different shapes is reported in the “Numerical Results” section.
Figure 1 shows the spiral geometry. The chip is placed between the two first vertical spiral branches as it is indicated in Fig. 1 with red color. The horizontal spacing between the two first vertical branches is fixed and denoted as 2r 0.The meander lines are constructed at the middle of each spiral branch. Each spiral branch is either meandered (modeled by binary “0”) or loaded (modeled by binary “1”). Thus, the number of unknown variables is 2m 1 + 2m 2 for this case, where m 1 and m 2 are the branch number (i.e. the number of the horizontal and vertical sections) of spiral one and two, respectively.
RFID tag geometry.

The other optimization parameters include the first vertical spiral length, SLv, the first horizontal spiral length, SLh, and the spacing between the two spirals, D 0. The use of two additional design parameters is required due to the meander lines. These are the vertical to the spiral branch length, Df, and the parallel to the spiral branch length, sf, which is defined as a percentage of the total branch length. Therefore, the total number of optimization variables is 7 + 2m 1 + 2m 2.
The length of a vertical spiral branch is given by the following recursive formula:
 $$\eqalign{{L_{vi}}(m) &= {L_{vi}}(m - 1) + 2{D_0}\,\,\,{\rm for}\,m \gt 2 \cr {\rm with}\,{L_{v1}}(1) &= S{L_v}, \cr {L_{v1}}(2) &= S{L_v} - {D_0}, \cr {L_{v2}}(1) & = S{L_v} + {D_0}, \cr {L_{v2}}(2) & = S{L_v} + 3{D_0},} $$
where m is the branch number.
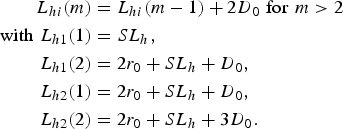
The length of a horizontal spiral branch is given by the following recursive formula:
 $$\eqalign{{L_{hi}}(m) & = {L_{hi}}(m - 1) + 2{D_0}\,\,{\rm for}\,\,m \gt 2 \cr {\rm with}\,\,{L_{h1}}(1) &= S{L_h}, \cr {L_{h1}}(2) &= 2{r_0} + S{L_h} + {D_0}, \cr {L_{h2}}(1) &= 2{r_0} + S{L_h} + {D_0}, \cr {L_{h2}}(2) &= 2{r_0} + S{L_h} + 3{D_0}.} $$
IV. ABC OPTIMIZATION
The ABC algorithm models and simulates the honey bee behavior in food foraging. In ABC algorithm, a potential solution to the optimization problem is represented by the position of a food source while the nectar amount of a food source corresponds to the quality (objective function fitness) of the associated solution. For population-based optimization algorithms, both exploration and exploitation are necessary for the population-based optimization algorithms. The exploration refers to the ability to investigate the various unknown regions in the solution space to discover the global optimum, while, the exploitation refers to the ability to apply the knowledge of the previous good solutions to find better solutions [Reference Trelea12].
To find the best solution the algorithm defines three classes of bees: employed bees, onlooker bees, and scout bees. The employed bee searches for the food sources, the onlooker bee makes a decision to choose the food sources by sharing the information of employed bee, and the scout bee is used to determine a new food source if a food source is abandoned by the employed bee and onlooker bee. For each food source exists only one employed bee. The employed bees search for new neighbor food source near of their hive.
A) GABC
The GABC differs from the original ABC algorithm in new solution generation equation. A new position of the  ${\bar x_i} = ({x_{i,1}}, \ldots, {x_{i,j}}, \ldots, {x_{i,D}})$ solution, where D is the problem dimension, is generated using
 $${u_{i,j}} = {x_{i,j}} + {\varphi _{i,j}}({x_{i,j}} - {x_{k,j}}) + {\psi _{i,j}}({y_j} - {x_{i,j}}),$$
where k ∈ {1, 2, …, SN}, k≠i, j ∈ {1, 2, …, D} are randomly chosen indices, where SN is the number of food sources, φ i, j is a uniformly distributed random number within [−1,1], y j is the jth parameter of the gbest solution, and ψ i,j is a uniform random number in [0,C], where C is the non-negative constant. GABC uses a greedy selection operator, which for minimization problems is defined by
 $${\bar x_i}^{\prime} = \left\{ {\matrix{ {{{\bar u}_i},} & {{\rm if }\, f({{\bar u}_i}) \lt f({{\bar x}_i}),} \cr {{{\bar x}_i},} &{{\rm otherwise},} } } \right.$$
where  ${\bar x_i}^{\prime} $ is the new position of the food source.
An onlooker bee chooses a food source depending on the probability value associated with that food source, p i, given by
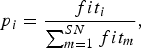 $${p_i} = \displaystyle{{fi{t_i}} \over {\sum\nolimits_{m = 1}^{SN} {fi{t_m}}}}, $$
where fit i is the fitness value of the ith solution, which is proportional to the nectar amount of the food source in the ith position. When a food source (solution) cannot be improved anymore then the scout bee helps the colony to randomly generate create new solutions
 $${x_{i,j}} = ran{d_{j(0,1)}}({x_{j,U}} - {x_{j,L}}) + {x_{j,L}}{\rm,}\ j = 1,2, \ldots, D,$$
where x j, L and x j, U are the lower and upper bounds of the jth dimension, respectively and rand j(0,1) is a uniformly distributed random number within (0,1).
V. NUMERICAL RESULTS
The RFID tag presented is designed for operation in Europe, where the minimum EIRP requirement is P EIRPrd = 3.28 W. The power threshold for the chip to run on is −18 dBm (15.84 μW). The tag is structured with copper strips of 1 mm width, printed on dielectric substrate with ε r = 3.25 and thickness h = 0.5 mm. It must be pointed out that in our previous work [Reference Goudos, Siakavara and Sahalos9, Reference Goudos, Siakavara and Sahalos10] the tags were printed on different dielectric substrates with different thicknesses. Additionally, the tags presented in [Reference Goudos, Siakavara and Sahalos9] were the first preliminary results using only the GABC algorithm. In this paper, the GABC is compared with three other algorithms and the obtained results are the best out of 20 independent trials. FEKO is the EM solver used in the optimization process. To validate the final results another commercially available EM solver is used to simulate the best tags found.
B) Case 1
The first RFID tag case presents a comparison of GABC with other popular EA. We compare GABC with particle swarm optimization (PSO) [Reference Dieter, Fischer and Menzel13], a binary-coded GA [Reference Marrocco7], and the original ABC algorithm. The control parameters for these algorithms are those that commonly perform well regardless of the characteristics of the problem to be solved. For the GA the crossover probability and the mutation probability are set to 0.9 and 0.1, respectively. In the PSO algorithm, the cognitive learning factor and the social learning factor are both set equal to 2.05. The inertia weight was linearly decreased from 0.9 to 0.4. For both ABC algorithms, the limit parameter is set to 100. In the GABC algorithm, the C parameter is set to one. All the algorithms ran for 20 independent trials. A population of 20 vectors was selected and the total number of iterations was set to 400. The stopping criterion was the iteration number. The best value, the worst value, the mean, and the standard deviation of the last generation computed by each algorithm are presented here. The same initial conditions are used for all algorithms. Additionally, the antenna size, in the optimization process was restricted to 50 × 50 mm2.
The design parameters of the best case found by the GABC algorithm are presented in Table 1. We have obtained a tag gain of 2.06 dBi and |Γ| = 0.05 at 867 MHz. The maximum read range between 865 and 869 MHz is 7.5 m. The tag size is 43.75 × 41.11 mm2. One may notice that the tag gain is higher than those of all the tags reported in our previous work [Reference Goudos, Siakavara and Sahalos9, Reference Goudos, Siakavara and Sahalos10], while the reflection coefficient value is the lower. Figure 2 depicts the geometry and the surface current distribution of the best tag found by the GABC at 867 MHz. The chip position is indicated by an arrow.
Case 1. Surface current distribution of best Spiral design with total size 43.75 × 41.11 mm2.
Case 1. RFID tag best design geometry obtained by GABC.

The three-dimensional (3D) radiation pattern at 867 MHz for both FEKO and the other EM solver is shown in Figs 3(a) and 3(b). We notice that the maximum direction is perpendicular to the tag level. Figures 3(c) and 3(d) show the radiation pattern at different phi planes for the same frequency for FEKO and the other EM solver. We notice that the results for both EM solvers are in good agreement.
Case 1. (a) 3D radiation pattern by FEKO, (b) 3D radiation pattern by other EM solver, different phi-cuts for the best RFID tag at 867 MHz by (c) FEKO and (d) other EM solver.
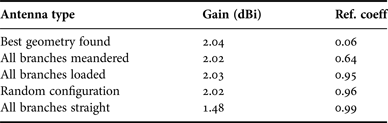
Table 2 holds comparative results of same antenna if the meandered lines and loads are configured differently. We notice that the best configuration found is the configuration with the highest gain value. It is also evident that the correct selection of the configuration plays an important role regarding conjugate matching. Additionally, a spiral with straight lines without meandered lines or loads, would have significantly lower gain than the others. Figure 4 depicts a comparison of the input impedances for tags of equal size and different geometries. The impedance graphs present peak values at different frequencies depending on the tag shape. The peak value of the tag with straight lines is at the highest frequency among all above 975 MHz. It means that the size of this type of tag has to be increased to resonate at the frequencies at which the other ones resonate. So, the modifications made to the ordinary spiral result in tags with smaller size. This figure again demonstrates the need for optimization to find the best possible geometry regarding conjugate matching.
Comparative results of input impedance versus frequency for different tag geometry.
Comparative results for different spiral geometries.
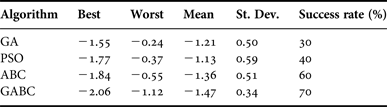
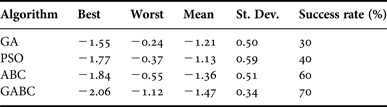
Figure 5(a) plots the read range and the reflection coefficient versus frequency. It is clear that the tag presents maximum read range larger than 7 m between 865 and 868 MHz. In Fig. 5(b), the detailed plots of the tag input impedance versus frequency between 800 and 900 MHz are shown. Table 3 presents the statistical results of the objective-function values for each algorithm and the success rate percentage. We define the success rate percentage as the percentage of the ratio successful runs/total runs. The GABC algorithm seems to perform better than the other algorithms. GABC obtains the best objective-function value, the highest mean value, and the smallest standard deviation value. The ABC original algorithm obtains the second best result close to that of GABC. Additionally, we notice that the GABC algorithm has achieved the highest success rate of 70%. The convergence rate plot of the algorithms is shown in Fig. 6. GABC and ABC converge at similar speeds faster than PSO and GA. GABC converges at the lower objective-function value.
Case 1. (a) Reflection coefficient and maximum read range. (b) Input impedance versus frequency.
Convergence rate plot.
Comparative results for the RFID tag design in case 1.
B) Case 2
The second design example is a tag with smaller dimensions than the previous one. We set L xmax = L ymax = 30 mm. We apply the GABC for 20 independent runs. The best result obtained is that of a tag with gain value of 1.4 dBi and |Γ| = 0.29 at 867 MHz. Table 4 reports the design parameters of this case. The obtained tag size is 27.45 × 27.87 mm2. The geometry of this tag and the surface current distribution at 867 MHz is shown in Fig. 7. The chip position again is indicated with an arrow. Figures 8(a) and 8(b) depict the 3D radiation patterns obtained by FEKO and the other EM solver, respectively. Figures 8(c) and 8(d) present the radiation patterns at different phi planes for both EM solvers. Again the results indicate good agreement between FEKO and the other EM solver.
Case 2. Surface current distribution of best Spiral design with total size 27.45 × 27.87 mm2.
Case 2. (a) 3D radiation pattern by FEKO, (b) 3D radiation pattern by other EM solver, different phi-cuts for best RFID tag at 867 MHz by (c) FEKO and (d) other EM solver.
Case 2. RFID tag best design geometry obtained by GABC.

Figure 9(a) depicts the read range and the reflection coefficient versus frequency. It is clear that the tag presents maximum read range about 7 m between 865 and 868 MHz. Figure 9(b) plots the tag input impedance versus frequency between 800 and 900 MHz.
Case 2. (a) Reflection coefficient and maximum read range. (b) Input impedance versus frequency.
VI. MEASUREMENT RESULTS
To validate the design procedure, the tags presented at the previous section were fabricated and measured. The tag prototypes were fabricated on a Rogers 3003 laminate. The fabricated prototypes were tested using the reader MTI Wireless Edge/MT – 242032/NRH. Figures 10(a) and 10(b) show the fabricated tags for cases 1 and 2, respectively.
Photographs of the fabricated prototypes of the proposed tags. (a) Case 1, (b) Case 2.
The reader antenna characteristics are: emitted power 1 W, gain 7 dBi, and circular polarization. The measurements were received by positioning the tag parallel and perpendicular to the horizontal plane and by rotating it around the x, y, and z axes. Each tag is rotated in an angle from 0° to 330° with 30° step. Thus, a total of 36 measurements is obtained for each reader distance. The measurements consisted of the readability of the tag versus its distance from the reader. Figures 11(a) and 11(b) show the statistical results of all measurements for both tags. It is evident that the maximum read range for tag 1 is about 7.8 m at 867 MHz, while for tag case 2 the corresponding measurement is 7 m. The theoretically expected maximum read range at 867 MHz for tag 1 is much higher. For this estimation, polarization loss factor equal was not taken into account, as the fabricated antenna has linear polarization and the reader circular. The theoretical estimation for tag 2 is about 8 m for 867 MHz, whereas the measured one is 7 m which seems to be in good agreement. Overall, measurement results confirm that the proposed design technique is suitable for obtaining efficient RFID tags.
Statistical results, received experimentally for the reading efficiency of the fabricated tags at 867 MHz. (a) Case 1 and (b) Case 2.
VII. CONCLUSION
Modified spiral antennas with meander lines and loads for passive RFID UHF tags were designed and optimized using the GABC algorithm, which is an improved ABC algorithm. GABC includes gbest solution information into the search equation to improve the exploitation. The designed tags were proven efficient for the design of this type of printed antennas as they have led to small sized configurations. Furthermore, they offer the potential to control the input impedance of the structure by modifying the spiral layout or shape and the number of loads or meander lines. It has been shown that the correct selection of the loads and meander lines configuration is important for achieving the goal of conjugate matching. The designed tags exhibit satisfactory read distances and the antennas. The first design exhibits high-gain value of 2.06 dBi and low reflection coefficient value at 867 MHz. The second design has a gain value of 1.4 dBi and has dimensions <3 cm. The GABC algorithm compared with other popular algorithms has obtained the best results. Thus, the GABC algorithm has proven to be quite efficient and powerful for RFID tag design.
ACKNOWLEDGEMENTS
This research has been co-financed by the European Union (European Social Fund – ESF) and Greek national funds through the Operational Program “Education and Lifelong Learning” of the National Strategic Reference Framework (NSRF) – Research Funding Program: THALES: Reinforcement of the interdisciplinary and/or inter-institutional research and innovation.
Sotirios K. Goudos received the B.Sc. degree in Physics in 1991 and the M.Sc. of Postgraduate Studies in Electronics in 1994 both from the Aristotle University of Thessaloniki. In 2001, he received the Ph.D. degree in Physics from the Aristotle University of Thessaloniki and in 2005 the Master in Information Systems from the University of Macedonia, Greece. In 2011, he obtained the Diploma degree in Electrical and Computer Engineering from the Aristotle University of Thessaloniki. He joined the Department of Physics, Aristotle University of Thessaloniki, in 2013 as a Lecturer. His research interests include antenna and microwave structures design, electromagnetic compatibility of communication systems, evolutionary computation algorithms, and mobile communications.
Katherine Siakavara received the B.Sc. degree in Physics in 1977 and the M.Sc. degree in Electronics, in 1979, from the Aristotle University of Thessaloniki, Greece. She was awarded the Ph.D. degree in Electrical Engineering from the same university in 1982. She is currently an Associate Professor in the Department of Physics of the University of Thessaloniki, Greece. Dr. Siakavara, is author or co-author of 42 international journal papers, 43 papers in proceedings of international conferences, two book chapters in English, and two book chapters in Greek. Her research interests are in the areas of (a) Applied Electromagnetism, (b) Analysis and Design of Antenna Systems, (c) Microwaves, and (d) Radio-wave propagation and radio-communications.
 Argiris Theopoulos received the B.Sc. degree in Physics in 2005 and the M.Sc. degree in Electronic Physics in 2008 from the Aristotle University of Thessaloniki. He has been working as an Electronics Engineer at Radiocommunications Laboratory of Aristotle University of Thessaloniki since 2013. His main fields of interest are design and development of Embedded Systems.
Elias E. Vafiadis was born in Thessaloniki, Greece in 1952. He received the B.Sc. degree in Physics in 1975 and the diploma of Postgraduate Studies in Electronics in 1979, both from the Aristotle University of Thessaloniki. On February 1981, he joined the Democritus University of Thrace, as a research associate at the Electrical Engineering Department, Xanthi, Greece. He received the Ph.D. degree in Electrical Engineering, from the Democritus University of Thrace, in 1985. From 1986 to 1993 he served as a Lecturer and as an Assistant Professor at Microwaves Laboratory, Xanthi, Greece. From 1993 to 2003 he was an Assistant Professor and since 2003 he is an Associate Professor in the Department of Physics at the School of Science of the Aristotle University of Thessaloniki, Greece. His research interests include application of electromagnetic theory to waveguiding and radiating structures, and CAD techniques for microwave circuits design.
John N. Sahalos received his B.Sc. and Ph.D. degrees in Physics. He also received the Diploma (BCE + MCE) in Civil Engineering and the professional Diploma of postgraduate studies in Radio-Electrology. He worked at the ElectroScience Laboratory, the Ohio State University, Columbus, as a Postdoctoral University Fellow. He was a Professor at the University of Thrace and a Professor at the AUTH. Dr. Sahalos is now Professor at the ECE Department of the University of Nicosia, Cyprus and director of the Radio & Telecommunications Laboratory (RTeLab). He was a visiting Professor at several Universities in USA and Europe. He is the author of four books (three of them in Greek), seven book chapters, and more than 400 articles published in the scientific literature.