


INTRODUCTION
This study examines shifting socioeconomic relations at the end of the Classic period through the analysis of decorated and imported ceramics at the lowland Maya site of Ucanal, Peten, Guatemala. The Terminal Classic (ca. a.d. 810–950/1000) was a period of significant political, economic, and social change as the dominant Classic period political powers, such as those centered around Tikal, Calakmul, Naranjo, Piedras Negras, and Yaxchilán, began to unravel, and previously subordinate polities, such as those centered around Ceibal, Nakum, and Ucanal, among others, began to assert their independence and changing political affiliations. It is not always clear, however, if social relations within these new Terminal Classic centers continued as in Late Classic times or if status distinctions fundamentally shifted.
Decorated ceramics provide one perspective on the ways in which social relations were constituted and reworked (Halperin and Foias Reference Halperin and Foias2010; LeCount Reference LeCount1999, Reference LeCount2001; Rice Reference Rice2009a). In Classic period Maya society, elaborate ceramics were used not only to display social prestige, but to forge alliances and relationships of dependence through feasting and gifting practices. Furthermore, not all households had the same networking capacities and purchasing power, as elite households often possessed greater access to more elaborate and non-local ceramics (Ball Reference Ball, Sabloff and Henderson1993; Foias and Bishop Reference Foias and Bishop1997, Reference Foias, Bishop, Varela and Foias2005, Reference Foias, Bishop, Pool and Bey2007; Reents-Budet Reference Reents-Budet1994, Reference Reents-Budet1998). Nonetheless, at the end of the Classic period, elaborate polychrome ceramics became less common, and other decorated and fine ware ceramic types began to be produced (Helmke Reference Helmke2001; López Varela and Foias Reference López Varela and LeCount2005; Rice and Forsyth Reference Rice, Forsyth, Demarest, Rice and Rice2004; Ting et al. Reference Ting, Martinón-Torres, Graham and Helmke2015). Thus, the examination of the way decorated and imported ceramics were distributed across different households and how these distributions changed over the course of the Late Classic (ca. a.d. 600–810) and Terminal Classic periods can help identify the ways in which social roles and statuses shifted during this time. To accomplish these goals, our study (1) compares decorated ceramic types in relation to household status categories determined by architectural volumetric rank classifications, and (2) identifies the presence of non-local ceramics from different households across the site of Ucanal, through chemical analysis using portable X-ray fluorescence (pXRF). These decorated ceramics were excavated by the Proyecto Arqueológico Ucanal (PAU) during the 2016–2019 field seasons (Halperin and Garrido López Reference Halperin and López2017, Reference Halperin and López2018, Reference Halperin and López2019, Reference Halperin and López2020). Chemical analysis of a subset of the Ucanal ceramic collection comprised 924 ceramics that were compared to ceramic reference samples from 14 other lowland Maya sites from the Upper Belize Valley (N = 43), the Usumacinta Valley (N = 16), the Petexbatun region (N = 74), the Peten Lakes region (N = 39), and the Holmul River region (N = 83).
SOCIAL STATUS CHANGES IN THE MAYA LOWLANDS DURING THE LATE CLASSIC AND TERMINAL CLASSIC PERIODS
The political, economic, and environmental struggles at the end of the Classic period were unevenly experienced across the Maya area. While some major centers were fraught with conflict, others appeared to have prospered. Some regions were more heavily affected by environmental challenges than others. In turn, settlement centers were abandoned in different ways: some were first abandoned by royal families, others primarily by commoner populations, and finally, some stayed on, but moved their residences to more defensible areas (Aimers Reference Aimers2007; Arnauld et al. Reference Arnauld, Andrieu and Forné2017; Carter Reference Carter2014; Chase and Chase Reference Chase, Chase, Demarest, Rice and Rice2004, Reference Chase, Chase, Varela and Foias2005; Demarest Reference Demarest2004; Graham Reference Graham, Awe, Morris and Jones2004; Hendon Reference Hendon, Hendon and Joyce2004; Laporte Reference Laporte, Demarest, Rice and Rice2004). Previous social relations between different households, lineages, or social statuses may have been called into question as certain segments of the population were under increased stress and some groups “voted with their feet” by migrating elsewhere (Ashmore et al. Reference Ashmore, Yaeger, Robin, Demarest, Rice and Rice2004; Lamoureux-St-Hilaire et al. Reference Lamoureux-St-Hilaire, Macrae, McCane, Parker and Iannone2017; Pierce Reference Pierce2016; Robin et al. Reference Robin, Yaeger, Ashmore, LeCount and Yaeger2010; Sharer and Traxler Reference Sharer and Traxler2006).
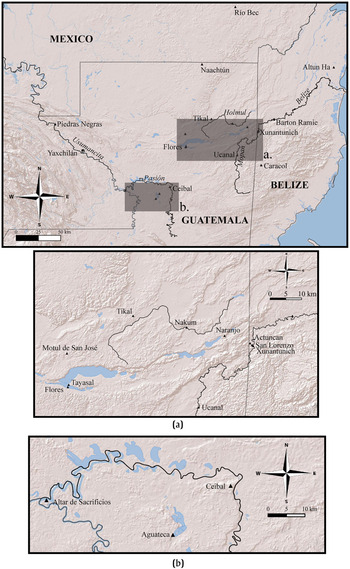
In turn, different regions appear to have engaged in diverse social strategies for either maintaining existing social hierarchies or attempting to challenge or diffuse them. For example, at the site of Piedras Negras in the Usumacinta River region, ruling families increasingly engaged in power-sharing strategies over the course of the Late Classic period, allowing the sajal or governors to be more independent and creating more extensive alliance networks between centers of different political rankings (Figure 1; Golden Reference Golden2010:378; Golden et al. Reference Golden, Scherer, Muñoz and Vásquez2008). In contrast, the nearby ruling dynasty of Yaxchilán imposed its architecture and monumental style among its subordinate nobility, creating a “collective memory and history” that fostered more hegemonic power relations (Golden Reference Golden2010:379–381). Nonetheless, the two polities were engaged in continued conflict with each other, and both sites were heavily depopulated over the course of the Terminal Classic period. Furthermore, none of the smaller secondary or tertiary centers within their kingdoms rose to prominence in the wake of their decline (Golden et al. Reference Golden, Scherer, Muñoz and Vásquez2008).
Map of the southern Maya lowlands with sites mentioned in this article. General map (top) shows major sites and rivers; (a) map centered on the Belize River, Holmul River drainage zone, and Lake Peten Itza; (b) map centered on the Pasión River and the Petexbatun region. Digitized by LeMoine.

Elsewhere, some smaller political centers took advantage of the weakened positions of their previously dominant overlords. For example, the site of Xunantunich experienced a short florescence at the end of the Late Classic period in the wake of dynastic struggles at Naranjo, a polity that previously held a dominating role in eastern Peten and western Belize (Awe et al. Reference Awe, Helmke, Slocum and Tilden2020; LeCount and Yaeger Reference LeCount and Yaeger2010a; LeCount et al. Reference LeCount, Yaeger, Leventhal and Ashmore2002). LeCount's (Reference LeCount1999) analysis of the distribution of fine ware and exotic ceramics across different architectural groups at the site revealed that inequalities were most evident during the Late Classic II phase, but that this differential access disappeared during the Terminal Classic. During this latter period, exotic ceramics, as well as decorated and skillfully crafted vessels, were found in commoner household contexts, and all households had equal access to ash ware ceramics (LeCount Reference LeCount1999:252–253).
In contrast, at the site of Caracol, social distinctions appear to have been accentuated over the course of the Late to Terminal Classic periods (Chase and Chase Reference Chase and Chase2009). During the Late Classic period, both epicentral elite groups and smaller residential groups across its hinterland had access to polychrome pottery and imported goods and likewise engaged in similar ritual practices, such as the caching of fingers in ceramic pots with modeled faces, and the use of Jaguar God of the Underworld effigy incensarios, items mostly restricted to elite and public ceremonial contexts at other Maya sites (Rice Reference Rice1999). Chase and Chase (Reference Chase and Chase2009) suggest that these patterns manifested a “symbolic egalitarianism,” since they masked other inequalities, such as divergent diets whereby elites from the palace possessed the healthiest diets at the site. During the Terminal Classic period, however, social distinctions increased, as fine ware and imported ceramics were largely restricted to epicentral contexts and relatively absent in hinterland residential contexts (Chase and Chase Reference Chase, Chase, Demarest, Rice and Rice2004; Chase and Chase Reference Chase and Chase2017).
Social inequality and hierarchy in archaeology are difficult to evaluate as social status was highly varied, porous, and constantly shifting (Ames Reference Ames, Bentley, Maschner and Chippindale2009; Carter Reference Carter2014; Flannery and Marcus Reference Flannery and Marcus2012; Foias Reference Foias2013; Gintis et al. Reference Gintis, Schaik and Boehm2014; Kintz Reference Kintz2004; Marcus Reference Marcus, Lohse and Valdez2004; Price and Feinman Reference Price and Feinman2012). In the Maya area, access to titles and privileges based on one's birth as a part of particular houses or lineages may or may not have corresponded with relative wealth. Such wealth may have been constituted in many different ways that included differential access to resources (landholdings, labor, imported and luxury goods, textiles and agricultural products, and so on), tribute rights, and relationships with sacred or spiritual entities. Furthermore, relationships of dependence, alliances, and tribute obligations were constantly negotiated through practices of affiliation, conflict, and resistance. Archaeologists have used various proxies to try to understand these relationships, including the access to imported goods and prestige items, feasting and ceremonial ritual, distance of residence from the ceremonial center, assessments of agricultural landholdings, diet and health, building elaboration (e.g., vaulted versus non-vaulted structures; qualities of plaster applications), and the size of residential groups, among others (Chase and Chase Reference Chase, Chase, Varela and Foias2005; Foias et al. Reference Foias, Halperin, Moriarty, Castellanos, Foias and Emery2012; Gonlin Reference Gonlin, Lohse and Valdez2004; Hayden Reference Hayden1998; Helmke Reference Helmke2001; Hendon Reference Hendon1991; Hutson and Welch Reference Hutson and Welch2019; Joyce Reference Joyce, Hendon and Joyce2004; LeCount Reference LeCount1999; LeCount et al. Reference LeCount, Walker, Blitz and Nelson2019; O'Rourke Reference O'Rourke2002). With the case of the site of Ucanal, we examine below architectural group volumes as an independent variable from which we compare changing patterns in the access and use of decorated and imported ceramics.
UCANAL
The Maya site of Ucanal is situated in the Mopan River Valley in eastern Peten, Guatemala, and flourished politically and economically during the Terminal Classic period (Halperin et al. Reference Halperin, López, Salas and LeMoine2020; Laporte Reference Laporte, Demarest, Rice and Rice2004; Laporte and Mejía Reference Laporte and Mejía2002). As identified in hieroglyphic inscriptions, the site was the seat of the K'anwitznal polity, which for most of its history was politically subordinate to other larger political powers. During the Early Classic period, it may have been under the domain of Tikal (Martin and Grube Reference Martin and Grube2000:34). Later during the Late Classic period, Ucanal was subordinate to Naranjo for at least the first half of the eighth century (Houston Reference Houston and Houston1983). Nonetheless, Ucanal likely took advantage of its strategic location between different regions and centers of power. It was, for example, an important link to other sites in southeastern Peten (Carter Reference Carter2016; Carter and Santini Reference Carter and Santini2019; Laporte Reference Laporte, Demarest, Rice and Rice2004), and was situated directly between Caracol and Naranjo, two powerful kingdoms that were in conflict with each other for much of the Late Classic period (Halperin et al. Reference Halperin, López, Salas and LeMoine2020; Helmke and Awe Reference Helmke and Awe2016; Martin and Grube Reference Martin and Grube2000). Although the K'anwitznal king, Xub Chahk, was captured by Yaxha's ruler, K'inich Lakamtuun, in a.d. 796 (Stuart Reference Stuart2019), and then by Caracol's king, Tum Yohl K'inich, in a.d. 800 (Martin and Grube Reference Martin and Grube2000:97), Ucanal gained its political independence by a.d. 820. It appears to have had ties to the renewed political center of Ceibal, as one day before the turning of Baktun 10 in a.d. 830, an individual from Ucanal, Kan Ek' Jo' Pet, helped oversee the arrival of the Ceibal king Wat'ul K'atel to power in the Petexbatun region (Schele and Mathews Reference Schele and Mathews1998:179–183).
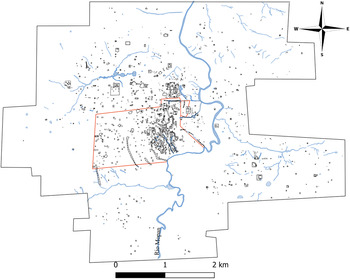
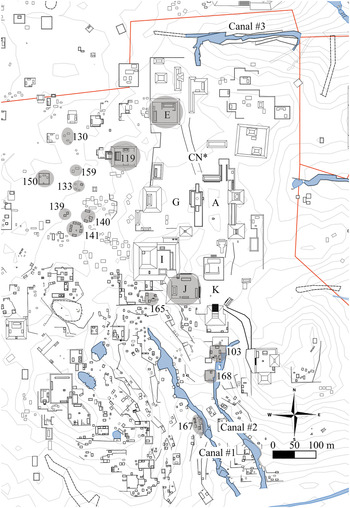
Since 2014, archeological research at the site of Ucanal by the PAU, building on the foundational work by the Atlas Arqueológico de Guatemala project, directed by Juan Pedro Laporte, has excavated and mapped an area of 26 km2, to offer a more comprehensive understanding of the history and character of the site (Figure 2; Corzo et al. Reference Corzo, Tulio Alvarado and Pedro Laporte1997; Halperin et al. Reference Halperin, López, Salas and LeMoine2020; Laporte and Mejía Reference Laporte and Mejía2005; Mejía Reference Mejía, Laporte, Escobedo and Arroyo2002). At the end of the 2019 field season, a total of 814 groups composed of over 2,052 structures have been mapped, and 34 architectural groups and features have been excavated in the highly nucleated ceremonial center (Figure 3; Halperin and Garrido López Reference Halperin and López2014, Reference Halperin and López2017, Reference Halperin and López2018, Reference Halperin and López2019, Reference Halperin and López2020; Laporte et al. Reference Laporte, Mejía, Acuña, Alvarado, Alvarez, Arroyave, Gómez, Marroquín, Menéndez and Salazar2002). This research reveals that the core of the site was at least 7.5 km2, and was occupied from the Middle Preclassic to Postclassic periods. Its most intensive occupation, however, was during the Late Classic and Terminal Classic periods. In addition to its continued occupation during the Terminal Classic period, most of its public ceremonial plazas and major buildings were newly refurbished, and in some cases, newly built. A large system of drainage canals was also added to its urban layout during this time (Halperin et al. Reference Halperin, LeMoine and Zambrano2019), and multiple stone monuments continued to be erected well into the ninth century (Halperin and Martin Reference Halperin and Martin2020).
Map of the site of Ucanal (digitalization by the PAU, with 2014–2019 data using Total Station, GPS, UAV photogrammetry, and LiDAR); red lines denote the national park boundary and black lines denote the survey boundary. Digitized by LeMoine.

Part of the Ucanal site core showing architectural groups excavated by the PAU. Groups excavated by PAU are labeled and highlighted with gray circles. *CN, Calzada Norte. Digitized by LeMoine.

To provide a heuristic classification for identifying social status, the PAU project created an architectural group ranking system, based on the volume of mound size derived from topographic survey data and calculated using the geographic information system's (GIS) spatial analysis function (Halperin and LeMoine Reference Halperin, LeMoine, Halperin and López2019; see also Halperin and Garrido López Reference Halperin and López2014, Reference Halperin and López2017, Reference Halperin and López2018, Reference Halperin and López2019, Reference Halperin and López2020). Architectural volume, as a heuristic classification, is imperfect since it compresses construction phases of multiple time periods and may not necessarily address emic understandings of status and social-signaling. Nonetheless, multiple construction phases often reflect the presence of founding families and greater access to longstanding resources, such as land, based on the “principal of first occupancy” (McAnany Reference McAnany1995:96–99). In addition, it combines multiple variables, such as mound height, mound numbers, and presence or absence of platform foundation considered in other architectural typologies used to identify status distinctions (Ashmore Reference Ashmore and Sarah M.2007; Palka Reference Palka1997; Robin Reference Robin2012; Willey and Leventhal Reference Willey, Leventhal, Hammond and Willey1979). In general, mound size is often correlated with the ability of inhabitants to mobilize labor (see also Foias et al. Reference Foias, Halperin, Moriarty, Castellanos, Foias and Emery2012).
The largest architecture groups, Rank 1 groups, were significantly larger in size than the majority of groups, at between 1,001 and 100,000 m3 (Table 1). They include both the city's public, ceremonial architecture and large residences likely belonging to the city's elite inhabitants. An intermediate rank architectural group size, Rank 2, was identified by groups between 201 m3 and 1,000 m3, and may be associated with lower-level nobility or higher-status commoner households. Excavations reveal that these groups often contained buildings with masonry walls or large platform foundations on which structures with masonry foundations sat. In turn, Rank 3 groups, all of which are under 200 m3 in size, comprised the majority of the architectural groups at the site (67 percent of the groups measured for architectural volume). These groups had less formal stone foundations and platforms, generally comprised only two to four mounds, and were likely inhabited by the city's commoner households.
Architectural groups and features excavated by the PAU (2016–2019) and their volumetric ranking. Op = Operation excavated.

UCANAL CERAMIC TYPES AND DISTRIBUTIONS BY RANK
In this study, our consideration of decorated ceramics was restricted to serving vessels (vases, bowls, plates/dishes) with bichrome and polychrome slip painting, as well as incised, molded-carved, gouged, and fluted decorations. Ceramic types with simple decorative techniques (e.g., Camaron Incised, Pantano Impressed, Pasos Impressed, Azucar Impressed, Candalaria Striated) were not included in the sample. Although more specific ceramic phase designations (early and late phases of the Late Classic corresponding to Tepeu 1 and 2 phase spheres from the Uaxactun ceramic sequence and Early and Late Terminal Classic phases) were identified during ceramic analysis, we consider only compressed Late and Terminal Classic periods here to draw out general trends, leaving more refined diachronic patterns for future analyses. The decorated ceramic types from Ucanal primarily include types that belong to Peten Gloss wares, but types with wares common to western and central Belize (British Honduras Volcanic Ash, Vinaceous Tawny) and Fine Orange ceramics from the Usumacinta River region were also present.
These ceramic types were not only highly conducive to social signaling through their decorative treatments, but generally required more labor than simpler undecorated monochrome and non-slipped ceramic types (LeCount Reference LeCount1996:198, 203, Reference LeCount1999; Ting Reference Ting2017). As serving dishes, these vessels played central roles in feasting and ceremonies, practices that were integral in the production and maintenance of hierarchical and heterarchical social relations (Halperin and Foias Reference Halperin and Foias2010; LeCount Reference LeCount2001; Rice Reference Rice2009b). Furthermore, vases and bowls may have been gifts, the material glue that cemented alliances and created social and political debts (Foias Reference Foias, Wells and Davis-Salazar2007; Helmke and Reents-Budet Reference Helmke and Reents-Budet2008).
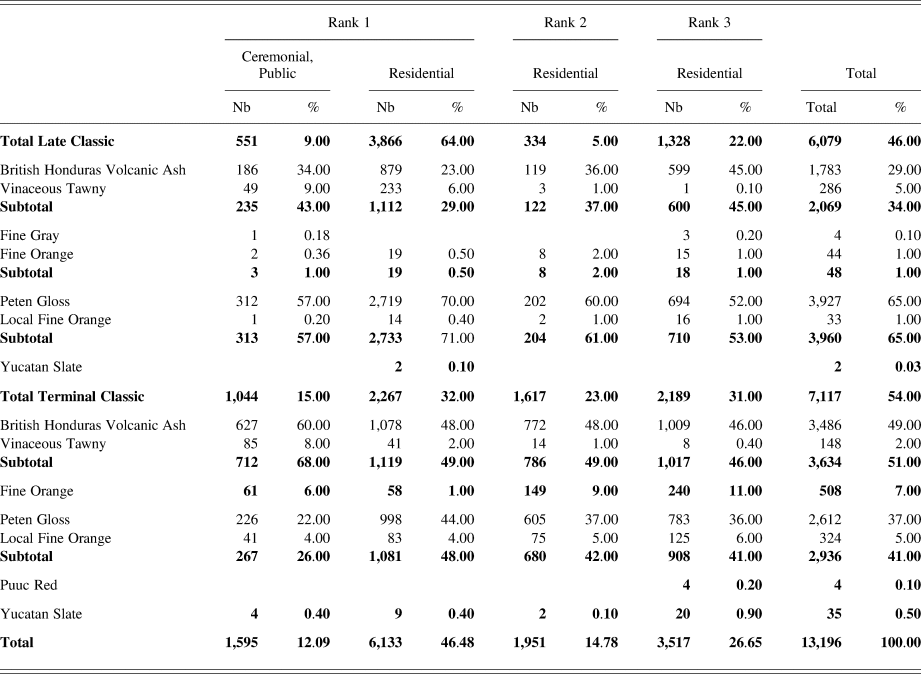
Analyses indicate that decorated ceramics at Ucanal represent 8 percent of the entire collection of identified ceramics from the Late and Terminal Classic periods, consistent with general patterns observed at other Lowland Maya sites during this time (Foias and Bishop Reference Foias and Bishop1997:278, Table 3). There was a large decrease in decorated ceramics during the Terminal Classic period (from 12 to 6 percent), a well-known pattern underscored in previous studies (Callaghan and Neivens de Estrada Reference Callaghan and Neivens de Estrada2016:219; Eppich Reference Eppich and Pérez2017:313–314; LeCount Reference LeCount, LeCount and Yaeger2010:218, Table 10.11; López Varela and LeCount Reference López Varela, Foias, López Varela and Foias2005; Rice and Forsyth Reference Rice, Forsyth, Demarest, Rice and Rice2004). Polychrome ceramics (e.g., Juleki, Saxche Orange, and Zacatal cream types) at Ucanal decreased drastically, from 71 percent during the Late Classic to 39 percent for the Terminal Classic, while incised ceramics (e.g., 22 types), a decorative technique that generally requires less labor than painting, became more popular (from 8 to 18 percent; LeCount Reference LeCount, Varela and Foias2005). This shift to less elaborate ceramics may reflect an aesthetic choice on the part of ancient inhabitants of Ucanal as much as a loss of knowledge or the need for more expedient manufacturing processes.
During the Terminal Classic period, decorated ceramic types common to western and central Belize appeared in higher proportions at Ucanal, including the decorated Belize Red types, which represent more than 80 percent of the total of the British Honduras Volcanic Ash ware from Ucanal. This ware category, characterized by a high content of volcanic ash with relatively few calcite inclusions, comprises more than half of the total wares present during the Terminal Classic, underscoring Ucanal's pivotal role in the east–west trading network along the Mopan and Belize River Valleys (Aimers Reference Aimers2002; LeCount Reference LeCount1996). Interestingly, the decorated ceramics belonging to the Vinaceous Tawny ware category were scarce at Ucanal. When they were encountered, they were primarily associated with high-status residential contexts during the Late Classic period and ceremonial contexts during the Terminal Classic period, a pattern also found at Xunantunich (Gifford Reference Gifford1976:267; LeCount Reference LeCount1999:250–251; Smith Reference Smith1955:174). Of the Vinaceous Tawny ware ceramics, polychromes decreased from 44 to 25 percent, in contrast to the more simple bichromes of the Chunhuitz Orange and Xunantunich Black-On-Orange, which increased over the course of the Late to Terminal Classic periods (55 to 75 percent).
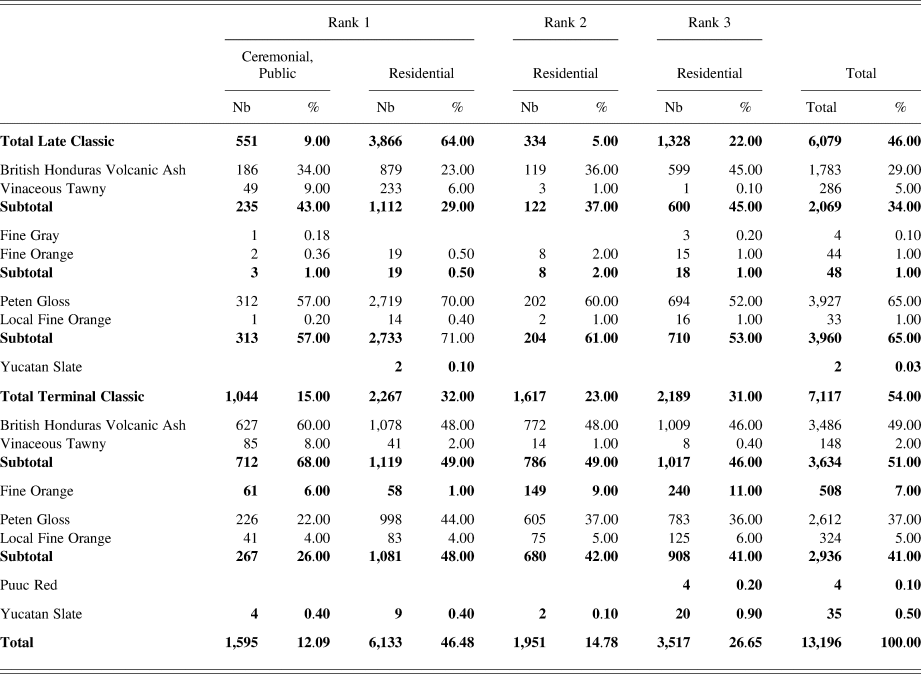
In contrast, fine paste ceramics from the western Maya lowlands, particularly Fine Orange and Pabellón Molded Carved types, which are often considered prestige goods and which had an important stylistic impact in the Maya area, were present in all contexts at the site of Ucanal (Table 2; Adams Reference Adams1971; Aimers Reference Aimers and Braswell2014:312–313; Smith Reference Smith1958; Straight Reference Straight, Gonlin and French2015:243). A local variety of Fine Orange, which is characterized by a distinctive orange paste, but has slightly larger inclusions and is less compact than Fine Orange wares, was also identified during the Terminal Classic, but these ceramics were rarely decorated (less than 7 percent). These ceramics are difficult to characterize because existing sherds are small and fragmentary.
Distribution of Ucanal decorated ceramic types by ware category and compared by architectural group rank and function.
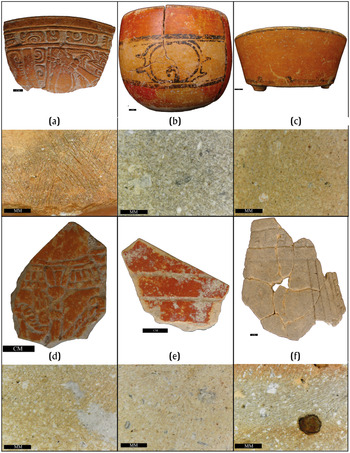
Interestingly, despite the fact that Ucanal shared many decorative ceramic types with sites in western and central Belize, relatively few Ahk'utu' molded-carved vessels (N = 26), which are common to sites in the eastern Maya lowlands, have been found at the site (Figure 4d; Helmke Reference Helmke, Griffith, Ishihara and Awe2000; Ting and Helmke Reference Ting and Helmke2013; Ting et al. Reference Ting, Martinón-Torres, Graham and Helmke2015). Ahk'utu' molded-carved vessels, produced from both calcite and volcanic ash pastes, are distinguished from other Terminal Classic molded-carved vessels as they exhibit tripod oven feet with rattles, highly formulaic and legible glyphic texts, and a standardized two-part iconographic program, usually one of a war captive scene presided over by a Maya lord, and the other a vision quest scene (Helmke and Reents-Budet Reference Helmke and Reents-Budet2008; Helmke and Ting Reference Helmke, Ting and Powis2017). In contrast, Pabellón molded-carved bowls and vases, as well as local varieties of molded-carved vases produced with Peten Gloss pastes, are more common to Ucanal (N = 123). These vessels do not have readable glyphs, their vases often have pedestal bases, and they possess more varied iconographic scenes that conform more closely to Terminal Classic period trends seen on stone monuments (Adams Reference Adams1971; Aimers Reference Aimers and Braswell2014; Just Reference Just2007; López Varela and Foias Reference López Varela and LeCount2005; Werness Reference Werness2003).
Photos and paste microphotos of decorated ceramics from Ucanal. (a) UCA-163, Pabellón Molded-Carved; (b) UCA-2732 (UCMC-10), Saxche Orange Polychrome; (c) UCA-2733 (UCMC-11), Xunantunich Black/Orange; (d) UCA-0818, Ahk'utu' Molded-Carved, showing torso and loincloth of ruler (British Honduras Volcanic Ash paste); (e) UCA-1021, Martins Incised; (f) UCA-1292, Toro Gouged Incised. (a–c) are bowls; (d–f) are vases. (b and c) Late Classic; (a, d–f) Terminal Classic. Photographs by LeMoine.

Decorated ceramics were more common in residential contexts (more than 86 percent) than public, ceremonial contexts. Such a finding is not surprising, since the latter contexts were often regularly swept clean, and other ceramic types, such as coarse ware incensarios, were better represented in public, ceremonial contexts than in residential contexts (Halperin et al. Reference Halperin, LeMoine and Zambrano2019).
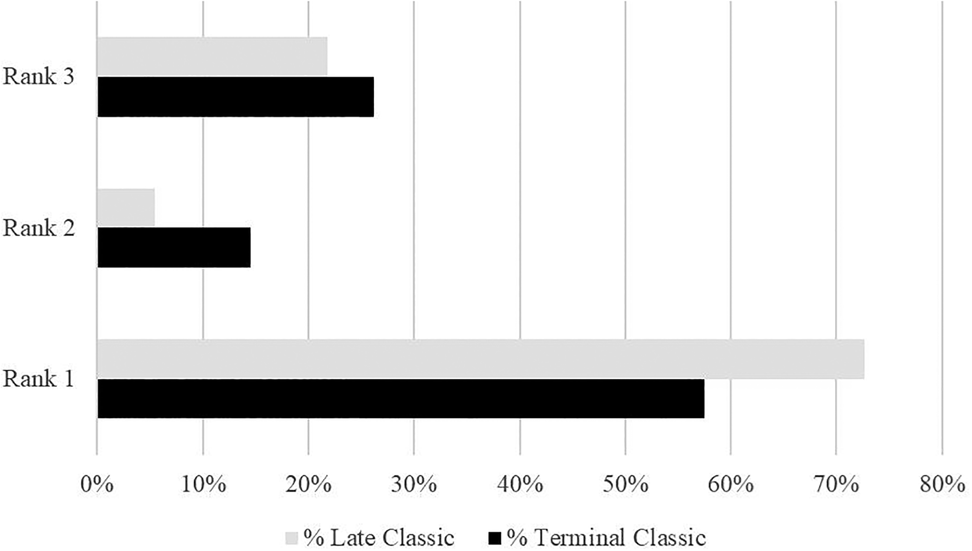
In terms of architectural group rank, more than half of all decorated ceramics were found in Rank 1 groups in both periods. Interestingly, Rank 3 possessed more decorated ceramics than Rank 2 groups, indicating that smaller, commoner households had better access to decorated serving wares than middle-status households (Figure 5). During the Terminal Classic period, access to decorated ceramics increased among both lower-ranked groups. Although Rank 1 groups possessed larger frequencies of decorated ceramics during both temporal periods, these frequencies diminished over the course of the Late Classic to Terminal Classic periods.
Percentage of decorated ceramic types within the Ucanal ceramic assemblage by architectural group rank and temporal period.

CHEMICAL CHARACTERIZATION OF UCANAL DECORATED AND IMPORTED CERAMICS
Ceramic samples were chemically analyzed with pXRF to identify how access to non-local ceramics differed between social contexts and over time. Although portable X-ray fluorescence instruments (pXRF) lack the same precision and range of detectable elements as other chemical analysis methods (e.g., INAA, ICP-MS) necessary for provenance research on archaeological ceramics, previous studies using pXRF have been able to identify chemically different paste compositions between regions, especially when geologic variations between regions are distinct (Emmitt et al. Reference Emmitt, McAlister, Phillipps and Holdaway2018; LeMoine and Halperin Reference LeMoine and Halperin2021; Speakman et al. Reference Speakman, Little, Creel, Miller and Iñañez2011; Wilke et al. Reference Wilke, Rauch and Rauch2016). In particular, a previous study by LeMoine and Halperin (Reference LeMoine and Halperin2021) has revealed that ceramics from the Mopan River Valley are chemically distinct from those from the Usumacinta region and from sites from central Peten, as local clays from these regions have different elemental compositions due to their distinct geological origins. The study included a comparison of pXRF and INAA chemical analysis methods and revealed that the majority of chemical groups detected with INAA were also detected by pXRF when comparing the more limited range of elements detectable with pXRF instruments. Nonetheless, within the Mopan River Valley itself, regional variation was exceedingly difficult to identify as the local bedrock is relatively homogeneous (Laporte and Mejía Reference Laporte and Mejía2005). As such, our use of pXRF provides only broad, regional comparisons that lack site-level specificities and more refined provenance designations detected through more precise instrumentation methods.
The Ucanal samples were compared to reference samples from 14 sites in the southern Maya lowlands, grouped by region related to their riverine or lacustrine characteristics. The Belize River region was represented by three neighboring sites in western Belize, less than 5 km apart from each other: Xunantunich, Actuncan, and San Lorenzo (Table 3). Samples were from sealed contexts and represent British Honduras Volcanic Ash (N = 24), Vinaceous Tawney (N = 18), and Peten Gloss ware (N = 1) samples from both Late Classic (N = 25) and Terminal Classic (N = 18) periods. Samples include fluted, polychrome, incised, and monochrome ceramics. Tikal, Nakum, and Naranjo are located on or near the Holmul River. These samples primarily comprised polychromes with British Honduras Volcanic Ash (N = 10), Vinaceous Tawney (N = 3), and Peten Gloss (N = 70) wares. Tikal and Naranjo samples were mostly polychromes with Peten Gloss wares, and those from Nakum were all molded-carved vessels with Peten Gloss or British Honduras Ash wares. Sites from the Peten Itza Lake region were represented by polychrome samples, with Peten Gloss wares from Flores, Motul de San José, and Tayasal. Ceramics from the Petexbatun region, represented by four major sites, consisted of polychrome and monochrome Peten Gloss ware samples (N = 53), Fine Orange ceramic samples from Altar de Sacrificios (N = 13), and a small sample of volcanic ash paste ceramics (N = 8; four of which were identified as an undetermined group with volcanic ash pastes, and four as Belize Red sherds). Samples from Piedras Negras in the Usumacinta river region were represented by polychromes (N = 12) and monochromes (N = 4) belonging to the Peten Gloss ware category.
List of samples and sites chemically analyzed with pXRF.

Samples from Ucanal were selected to characterize the local chemical composition of the region and included a large sample of Peten Gloss ware (N = 405) and Local Fine Orange (N = 91), which was likely manufactured locally. To get a better understanding of the local chemical signature from Ucanal, reference samples from a Ucanal pottery workshop (Group 133, Op. 8; Halperin Reference Halperin2019; Halperin et al. Reference Halperin, LeMoine, Flynn-Arajdal, Halperin and Garrido2017) were analyzed and consisted of three unfired vessels, an unfired figurine, and one raw clay sample. These reference samples were fired at 800 °C in a Université de Montréal laboratory kiln before analysis. In addition, Ucanal samples belonging to British Honduras Volcanic Ash (N = 177), Vinaceous Tawny (N = 15), and Fine Orange (N = 97) ware categories, but without signs of decoration, were also included in the chemical analysis sample to bolster the sample for which local and non-local ceramics could be assessed.
Chemical analysis was conducted with a Bruker Tracer Vi with a rhodium anode, a 40 mm2 silicon drift detector with <140 eV @ 250,000 cps Mn Kα, and an 8 mm collimator. The analysis was conducted using the Mudrock Dual setting, a factory calibration setting of matrix-matched materials that targets both trace and major elements (trace element 40keV, 21μA, 25 seconds exposure and Ti/Al filter; major element 15 keV, 19μA, no filter 60 seconds exposure; 6 mm collimator window). Analysis targeted a fresh break of the sherd, which was cleaned and flattened to prevent air attenuation. Three assays were taken on different locations of the sample to control for the heterogeneity of the ceramic pastes. Data were then cleaned of aberrant elemental readings by using the mean, standard deviation, and relative standard deviation on each element for each sample (RSD lower than 25 percent; Dussubieux et al. Reference Dussubieux, Golitko, Ryan Williams, Speakman, Glascock, Speakman and Popelka-Filcoff2007; Rowe et al. Reference Rowe, Hughes and Robinson2012). Elements with high composition values (Al, Ca, Fe) were used in percentages and those with lower values were transformed in ppm (Ti, Cr, Mn, Zn, Rb, Sr, Zr, Nb, Mo). Data were then transformed to LOG 10 and then submitted to a hierarchical cluster analysis to identify major groups, with group structures further refined using discriminant analysis (Druc et al. Reference Druc, Inokuchi and Dussubieux2017; Stroth et al. Reference Stroth, Otto, Daniels and Braswell2019). All chemical composition groups were then processed separately, selecting elements in order to identify subgroups using the same methods noted above (Druc et al. Reference Druc, Inokuchi and Dussubieux2017).
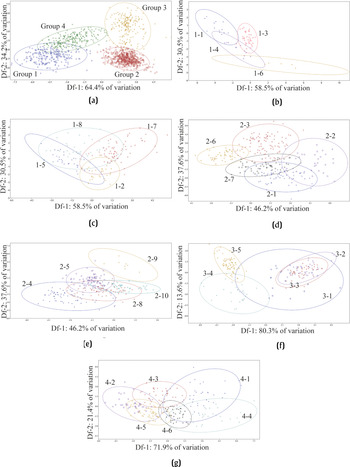
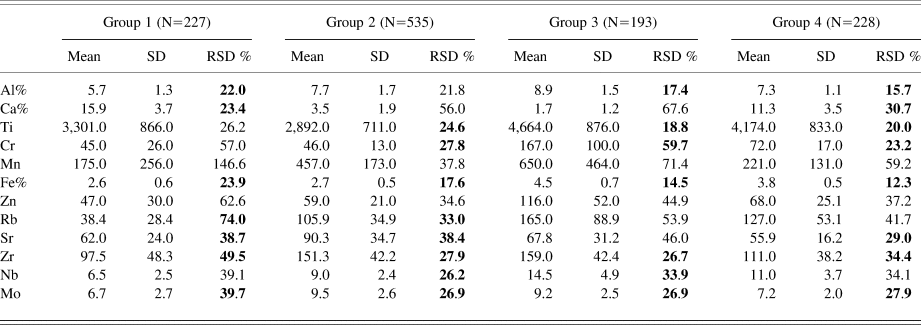
We were able to identify four main chemical composition groups and 29 subgroups (Table 4; Figure 6). Group 4 is mainly composed of Peten Gloss wares (75 percent), Local Fine Orange ceramics (22 percent), and one of the unfired vessel samples from the Ucanal pottery production context (Group 133). Based on the provenance postulate and the presence of the local pottery production sample, this chemical composition group likely represents ceramics local to Ucanal or within the surrounding Mopan River Valley region. A small minority of the samples from Group 4 were excavated from Piedras Negras in the Usumacinta River zone (N = 1) and Naranjo in the Holmul River region (N = 2), suggesting that Mopan region ceramics may have been exchanged or transported to these sites.
Byplots of chemical composition groups and subgroups. (a) Groups 1–4; (b–c) subgroups from Group 1; (d–e) subgroups from Group 2; (f) subgroups from Group 3; (g) subgroups from Group 4 (all ellipses are at 95 percent confidence intervals). All chemical data will be available at the project website: https://www.ucanal-archaeology.com.

Summary of group's statistics. Percentages of elements in bold were used to form subgroups. RSD, relative standard deviation; SD, standard deviation.

Group 1 is primarily composed of Peten Gloss wares with calcite inclusions, as characterized by their high content of calcium (mean 16 percent). Of the eight subgroups identified, four appear to have been local to Ucanal (Subgroups 1-3 and 1-6 to 1-8), based on the provenance postulate. In addition, Subgroups 1-6, 1-7, and 1-8 contained local reference samples from the Ucanal ceramic workshop (Op. 8, Group 133). Small quantities of ceramics belonging to these three chemical composition subgroups, but excavated from Naranjo (N = 1), Piedras Negras (N = 1), and the Upper Belize Valley (N = 1), may suggest that these sites received ceramics from Mopan Valley sites. Subgroups 1-1 and 1-4 cluster with samples from the Petexbatun region. Subgroup 1-2 is most closely associated with reference samples excavated from Naranjo, and thus may have been produced in the Holmul River drainage area. Subgroup 1-5 primarily contains ceramic samples excavated from Piedras Negras, indicating that these ceramics may have been produced in the Usumacinta River region.
Group 2 (N = 535) is more complex as it largely contains samples with volcanic ash pastes (British Honduras Ash and Peten Gloss wares), which possess a high variability of Chromium and Zirconium. Nonetheless, we were able to identify ten subgroups. The majority of samples from the first Subgroup (2-1) are ceramics excavated from the Lake Peten Itza, particularly Motul de San José, although some ceramics from the Petexbatun region and Ucanal also belong to this group. Significant chemical distinctions between the Petexbatun and Peten Lakes regions are more challenging since they share a similar bedrock geology (Vinson Reference Vinson1962). Subgroup 2-2 is composed of ceramics primarily from Ceibal. Since some ceramics belonging to this subgroup were excavated from Ucanal (N = 5), it is possible that they represent imports from the Petexbatun region to Ucanal. In turn, Subgroups 2-4, 2-5, and 2-8 are clearly from the Belize Valley region and Naranjo. Although the Belize Valley sites are located relatively close to the site of Naranjo, their political-economic histories were also intimately intertwined during the Late Classic period with known exchanges between them (Helmke et al. Reference Helmke, Polyukhovych, Reents-Budet and Bishop2017; LeCount and Yaeger Reference LeCount, Yaeger, LeCount and Yaeger2010b). Subgroup 2-6 appears to represent ceramics manufactured at or near Naranjo, and Subgroups 2-3, 2-6, and 2-9 were likely produced in the Holmul region, with Subgroup 2-3 particularly associated with Nakum's locally produced molded-carved ceramics (see Źrałka and Hermes Reference Źrałka and Hermes2012; Figure 6). These subgroups also comprised a small quantity of ceramics from Tikal and Ucanal, as identified previously, and thus may indicate that Holmul sites received ceramics from Tikal and the Mopan River Valley region, as noted previously (Halperin and Bishop Reference Halperin and Bishop2016; LeMoine and Halperin Reference LeMoine and Halperin2021). Subgroups 2-10 and 2-7 are too heterogeneous to assign a secure provenance.
Group 3 is composed of samples with high levels of chromium and iron, which are characteristic of the chemical signatures of Usumacinta River and Petexbatun regions, and contrast significantly with the chemical compositions of ceramics of the Mopan River Valley (Bishop et al. Reference Bishop, Sears and Blackman2005; Foias Reference Foias1996:965; Foias and Bishop Reference Foias and Bishop1997:283). This group is primarily comprised of Fine Orange ceramics. A large quantity of Subgroup 3-2 samples were excavated from Altar de Sacrificios, and if these Fine Orange ceramics were produced at this site, inhabitants from Ucanal and Ceibal also had access to these. Petexbatun region ceramics are heavily represented in chemical Subgroups 3-1 and 3-3, and as such, Ucanal ceramics belonging to these subgroups likely represent imports from that region. The last subgroups, 3-4 and 3-5, contain slightly lower concentrations of chromium and iron than the other Group 3 subgroups, and have similar rubidium and strontium values to Ucanal ceramics Group 4, suggesting that they may represent different paste recipes from the Mopan River region, but from a different clay source or some other region not represented in our reference samples.
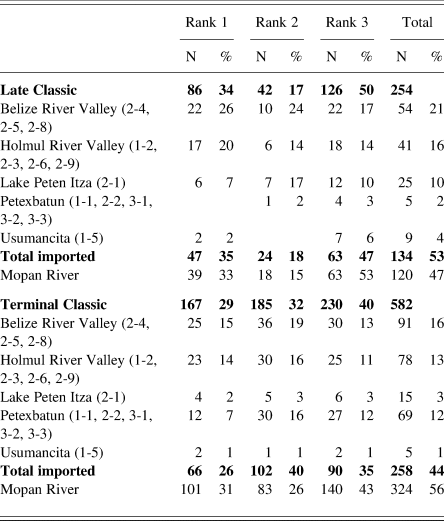
An analysis of the spatial distribution of non-local chemical composition groups and subgroups reveals that all excavated residential contexts had access to non-local ceramics. Surprisingly, non-local ceramics are particularly well-represented among Rank 3 residential groups during the Late and Terminal Classic periods (47 percent and 35 percent of the total imported ceramics; Table 5). During the Late Classic period, 18 percent of Rank 2 residential ceramic assemblages were likely imports, but over time, the frequency of imported ceramics in Rank 2 contexts increased to 40 percent of the total imported ceramics. The opposite trend occurred among Rank 1 ceramic assemblages, where a decrease in non-local ceramics (from 35 percent to 26 percent) are noted. In general, non-local ceramics from all contexts decreased slightly from the Late Classic to Terminal Classic periods (53 percent down to 44 percent).
Distribution of non-local chemical paste groups from Ucanal by residential group rank. Chemical subgroup names are in parentheses.

Our interpretation of ceramic provenances based on the reference sample collections is that Ucanal had strong ties with sites from the Upper Belize River Valley and the Holmul region during both the Late and Terminal Classic periods, and less frequent or weaker ties with the Peten Lakes region and the Usumacinta region during the Late Classic period (Table 5). Ucanal's ties with both regions appear to have declined to different degrees during the Terminal Classic period. While Ucanal continued to have access to ceramics that were likely produced in the Upper Belize Valley and Holmul regions, Ucanal's access to ceramics from the Petexbatun region increased significantly during the Terminal Classic period.
DISCUSSION
Analyses of ceramics from the site of Ucanal reveal a leveling out of social status distinctions between different households over the course of the Late Classic to Terminal Classic periods. While elite households did not monopolize access to decorated or imported ceramics during either period, their more privileged access to these items diminished over time. In turn, medium-sized architectural groups that may have been home to secondary elites or more established commoner households appear to have increasingly engaged in feasting, gift-giving networks, and market exchanges to obtain fine ceramics as a means to promote their increasing social standing. Interestingly, commoners from Rank 3 architectural groups were active in regional exchanges, gift-giving, and the use of imported ceramics during both periods. The relatively substantial level of access to non-local ceramics, regardless of household size, implies that decentralized and open commercial market systems were in place during both temporal periods, as has been underscored in many previous studies (Cap et al. Reference Cap, Peuramaki-Brown and Yaeger2015; Foias and Bishop Reference Foias and Bishop1997; Halperin et al. Reference Halperin, Bishop, Spensley and Blackman2009; Marino et al. Reference Marino, Fargher, Meissner, Martindale Johnson, Blanton and Heredia Espinoza2020:784; Masson and Freidel Reference Masson and Freidel2012; Sheets Reference Sheets2000). Although the physical location of a market place, similar to that discovered at the southeastern Peten site of Pueblito (Laporte and Chocón Reference Laporte, Chocón, Laporte, Arroyo and Mejía2008), has not been identified at Ucanal, it is likely that one existed somewhere at the site or nearby.
Although middle-status and commoner households in some regions of the Maya lowlands, such as at Caracol (Chase and Chase Reference Chase and Chase2009:21), became increasingly estranged from long-distance networks, other sites across the southern Maya lowlands experienced a rise of secondary elites or non-noble families who had increasing access to highly valued items and imported ceramics from afar during the Terminal Classic. The latter pattern, which is found at Ucanal, is evident elsewhere, such as Ceibal, Xunantunich, and other sites in the Belize Valley. For example, Sabloff (Reference Sabloff1975:238) and Tourtellot (Reference Tourtellot1988:400–407) noted that Terminal Classic fine paste sherds at Ceibal were more frequent in small structure residential groups than in all other contexts in the site combined. Likewise, Helmke's (Reference Helmke2001:38–40) distribution analysis of Terminal Classic molded-carved vessels from multiple sites in Belize reveals that, with the exception of Altun Ha, these vessels were found primarily in medium-sized residences rather than the smallest domestic contexts or the largest residences and palatial contexts. And as mentioned, at the site of Xunantunich, decorated ceramics decreased among palace and elite contexts and increased among plazuela groups, large-sized residential contexts associated with commoner households during the Terminal Classic (LeCount Reference LeCount1999). Not only were many non-royal households increasingly upwardly socially mobile, but the basic assumptions on how social privilege was constituted had shifted.
Arnauld et al. (Reference Arnauld, Andrieu and Forné2017) have suggested that with the weakening power of the k'uhul ajaw, non-royal elites were able to prosper, in part, through the coalescence of large co-residence groups that forged their own alliances outside dynastic ruling hierarchies. In the Río Bec region, non-royal elite households located in dispersed locations throughout the landscape continued to refurbish and make improvements to their monumental residential complexes, efforts that relied on the labor and support of smaller households (Arnauld et al. Reference Arnauld, Michelet, Andrieu, Lacadena, Lemonnier, Vannière, Nondédéo and Patrois2014a, Reference Arnauld, Michelet and Nondédéo2014b; Nondédéo et al. Reference Nondédéo, Arnauld and Michelet2014). At the site of Naachtún, many of the elite residences in the site core were still occupied during the Terminal Classic (Sion Reference Sion2016). Excavations indicate that these spaces were substantially reordered, and their inhabitants engaged in new, long-distance economic exchanges with northern Yucatan, Belize, and the Usumacinta region. The abandonment of smaller residences in the site periphery during this time may indicate that some of the elite households absorbed those living in more dispersed locations (Nondédéo et al. Reference Nondédéo, Patiño, Sion, Michelet, Morales-Aguilar, Arnauld and Breton2013). In the case of the site of Ucanal, however, the new socially mobile households, as seen from the ceramic data, did not occupy monumental residential compounds, but medium-sized residences in the highly nucleated ceremonial core (LeMoine and Herrera Reference LeMoine and Herrera2020). Unlike other sites, smaller households at Ucanal were not abandoned, but continued to be occupied throughout the Terminal Classic period, and in some cases, into the Postclassic period. Thus, the changes and causes that created the sociopolitical climate of the Terminal Classic period varied considerably from region to region (Peregrine Reference Peregrine and Smith2011).
At the site of Ucanal, less emphasis was placed on the ostentatious display of elite grandeur during its final occupation phases. For example, the changes in the distribution of finely decorated ceramic vases, bowls, and dishes were accompanied by shifts in architecture wherein less effort was placed on displaying social distinctions between social groups (Halperin and Garrido Reference Halperin and Luis Garrido2019). During the Terminal Classic period, masonry buildings with thick walls and vaulted roofs located in the site core were replaced by perishable wooden buildings that stood on large masonry platforms (Halperin Reference Halperin2021). Many of the Terminal Classic structure foundations re-used building materials from these earlier buildings, and the quality of the construction, in general, was of lower quality. Thus, while major distinctions in household size remained, they were not highlighted by fundamentally different types of architecture, such as distinctions in masonry and wooden buildings. These architectural shifts were not a result of diminishing access to labor, since major infrastructural investments were made at the site during this time, including the construction of new plaza surfaces, new temple-pyramid buildings, at least one ballcourt (over 40 m long), and massive water drainage canals (Halperin Reference Halperin2021; Halperin and Garrido Reference Halperin and Luis Garrido2019; Halperin et al. Reference Halperin, LeMoine and Zambrano2019; Laporte and Mejía Reference Laporte and Mejía2002). Similar to the site of Ucanal, stone masonry buildings at the site of Lamanai were razed and replaced by perishable buildings on masonry platforms during the Terminal Classic period (Graham Reference Graham, Awe, Morris and Jones2004:232). Unlike many other lowland sites, Lamanai also had a healthy occupation during the Terminal Classic period, a pattern that continued into the Postclassic and Colonial periods. Thus, the changes in both ceramics and architecture may have been part of social strategies that challenged previous forms of performing social difference and contributed to a porosity of social frontiers.
The chemical analysis of ceramics from Ucanal also underscores that the prosperity of the K'anwitznal polity during the Terminal Classic period was linked to new alliances and political-economic networks with the western Maya lowlands, as well as its continuation of political and economic relationships in the Holmul and Belize River Valley regions (Carter Reference Carter2016; Halperin et al. Reference Halperin, López, Salas and LeMoine2020; Laporte et al. Reference Laporte, Mejía, Escobedo, Wanyerka, Laporte and Mejía2006). Its inhabitants took advantage of its strategic position on the Mopan River that linked the Caribbean Sea with a small overland zone to the Usumacinta River, allowing it to forge new routes of exchange as previous trading nodes controlled by Tikal and Naranjo, among other sites, declined (Arnauld et al. Reference Arnauld, Andrieu and Forné2017; Halperin and Martin Reference Halperin and Martin2020; Halperin et al. Reference Halperin, López, Salas and LeMoine2020; Helmke Reference Helmke2001:12, Figure 2; Laporte and Mejía Reference Laporte and Mejía2005; Laporte et al. Reference Laporte, Adánez and Mejía2008). Ucanal's close relationship with Xunatunich, located just downstream, likely continued, as Ucanal's Terminal Classic monochrome pottery comprised many Mount Maloney Black type bowls, a particular type of Pine Ridge Carbonate wares that was a hallmark of domestic and cache vessels from Xunantunich and its hinterlands (Douglas et al. Reference Douglas, MacDonald, Ebert, Awe, Dussubieux and Klesner2021:2; Halperin et al. Reference Halperin, López, Salas and LeMoine2020; LeCount Reference LeCount, LeCount and Yaeger2010:220, Table 10.12). In turn, imitation Tinaja Red slipped tripod dishes, a ceramic group more typical of Peten sites, are newly found at Xunantunich during the Terminal Classic period (LeCount Reference LeCount, Varela and Foias2005:101). The site of Ucanal also sat at the intersection of different Terminal Classic molded-carved exchange networks, as its ceramic inventories included local Peten Gloss versions, imported Fine Orange from the west, and Ahk'utu' molded-carved vessels from the east (Reents-Budet et al. Reference Reents-Budet, Bishop, Audet, Awe, Blackman, Awe, Morris, Jones and Helmke2005; Ting et al. Reference Ting, Martinón-Torres, Graham and Helmke2015).
Nonetheless, the chemical analysis data underscore that exchange networks to sites in the Petexbatun region and down the Usumacinta River to the west had become increasingly more important during the Terminal Classic. Such shifts are evident in the epigraphy, with the mention on Ceibal Stela 11 of Kan Ek' Jo' Pet from Ucanal, who oversaw the arrival of the Ceibal lord, Wat'ul K'atel, to Ceibal at the beginning of the Terminal Classic period (Rice and Rice Reference Rice, Rice, Demarest, Rice and Rice2004; Schele and Mathews Reference Schele and Mathews1998); and Ucanal's Terminal Classic monuments show stylistic and epigraphic elements that are characteristic of both Gulf Coast and northern Yucatecan zones (Halperin and Martin Reference Halperin and Martin2020). The ceramic data, however, highlight that these political and diplomatic ties were grounded in exchange networks in which even modest households participated. Chemical analysis research that incorporates reference samples from the Gulf Coast region, most notably Campamento Fine Orange ceramics, is currently ongoing and will undoubtedly yield more detailed understandings of these western ties (Ronald Bishop, personal communication 2019). Inhabitants of the site undoubtedly took advantage of its strategic location along a key riverine route eastward to the Caribbean, and close to riverine routes that facilitated trade westward to the Gulf Coast. The success of Terminal Classic centers in the lowlands, however, cannot be simplistically reduced to its location along a river system, as other sites, such as Aguateca, Dos Pilas, Piedras Negras, and Yaxchilan likewise were located in strategic riverine locations, but did not fare as well during this period.
CONCLUSIONS
The present study provides an example of the way in which social status and political-economic relations shifted over the course of the Late and Terminal Classic periods. Although both lower-status and elite inhabitants of the ancient city of Ucanal had access to imported and decorated vessels during both periods, access to these goods diminished among elite households and increased among middle-status households over time. As observed at other Terminal Classic sites, non-royal elites or upwardly mobile commoners begun to assert themselves more intensely through the gifting of highly valued vessels, through the hosting of feasts involving these serving vessels, and through the development of long-distance ties to other regions. More extensive chemical sampling and comparative analysis of ceramics from Guatemala, Mexico, and Belize could help to better identify the extent of these interregional exchanges within the limitations of pXRF instrumentation, which offers a lower resolution, but relatively efficient and accessible chemical composition analysis technique, than more traditional chemical analysis methods (e.g., INAA, LA-ICP-MS). Thus far, chemical analyses using pXRF indicate that Ucanal engaged in more extensive contacts with sites in the Petexbatun and Usumacinta region over the Late Classic to Terminal Classic period, highlighting the site's prominent political-economic position between eastern and western riverine trade routes during this moment in Maya history.
RESUMEN
Este artículo investiga el final del período clásico, un momento tumultuoso en la historia maya, no sólo porque el poder de muchos centros políticos dominantes se desvaneció, sino porque las formas en que las élites y la gente común se relacionaban habían cambiado. Para mejor comprender la naturaleza de las transformaciones de los relaciones sociales, políticas y economicas en las tierras bajas mayas del sur durante este período, este estudio examina la distribución y procedencia de las cerámicas decoradas durante el clásico tardío (ca. 600–830 d.C.) y el clásico terminal (ca. 830–950/1000 d.C.) al sitio arqueológico de Ucanal, Petén, Guatemala. Las comparaciones de cerámicas de diferentes grupos residenciales revelan que las diferencias en el acceso a cerámicas decoradas e importadas disminuyeron entre estos períodos, lo que sugiere que las distinciones socioeconómicas se nivelaron a lo largo del tiempo. A su vez, el análisis químico de la cerámica, utilizando un instrumento portátil de fluorescencia de rayos X (pXRF), revela que el sitio cambió sus redes político-económicas, con mayores vínculos con las regiones de Petexbatún y Usumacinta y los vínculos continuos con el occidente de Belice.
ACKNOWLEDGMENTS
This work had been supported by an SSHRC Insight #435-2015-0645 and CFI J. Evans Leaders Fund #35632 grant (to Halperin). We would like to thank Lic. Mara A. Reyes from the Proyecto Atlas for access to the ceramics from the Mopan Valley and help at the laboratory in Dolores. We would like to thank Lisa LeCount for generously sharing her knowledge of Belize Valley ceramics and for access to Xunantunich, San Lorenzo, and Actuncan ceramic collections. We are also very grateful to Vilma Fialko for sharing her expertise in Peten ceramics and for her support of this research through the lending of reference samples from Naranjo. We would also like to thank Antonia Foias from the Proyecto Arqueológico Motul de San José, Timothy Pugh from the Proyecto Arqueológico Tayasal, the late T. Patrick Culbert from the University of Pennsylvania Tikal Project, Mario Enrique Zetina Aldana from the Rescate Arqueológico de Isla de Flores Phase I, Yovanny Hernandez from the Rescate Arqueológico de Isla de Flores Phase II, and Jarosław Źrałka and Bernard Hermes from the Proyecto Arqueológico Nakum, for allowing us to analyze ceramics from their collections. We are very thankful to Lic. Jorge Mario Ortiz of the Departamento de Monumentos Prehispánicos y Coloniales for granting us access to the Ceramoteca in Guatemala Ciudad, which allowed us to expand our chemical reference materials to the Petexbatun region. We are grateful to Proyecto Arqueológico Ucanal team members, particularly José Luis Garrido López, Miriam Salas, Marta Lidia Perea Carrera, Miguel Ángel Cano, and Delmi Herrera, for their hard work and their help at every level of this analysis. We would also like to thank four anonymous reviewers for their helpful and constructive comments, although all errors are our own.