


In a previous paperReference Wexler 1 an attempt was made to analyze the effect of geothermal heat transmitted to a growing ice layer in Byrd Land, Antarctica. During the U.S. International Geophysical Year investigations in this area unexpectedly thick ice was found, in some places over 4,000 m. thick and extending as much as 2,500 m. below present sea-level.
At the time of these first discoveries when it was not known how extensive was the area of below sea-level ice, the model adopted for thermal analysis was based on accumulation of snow in an initially dry, snow-free basin extending 1,500 m. below present sea-level. With an assumed constant annual accumulation of 30 cm. of ice, a geothermal heat flux of 31.6 cal. cm.−2 yr.−1, and no motion of the ice, a series of curves was found showing vertical temperature profiles as functions of time. In absence of geothermal heat conduction, the vertical temperature gradient within the ice was taken as 0.15° C. decrease per 100 m. of depth, which was the average gradient observed in February 1958 in the top 300 m. of ice at Byrd Station, lat. 80° S., long. 120° W.Reference Marshall and Gow 2 During the initial 2,000 yr. of growth, practically all of the geothermal heat was conducted through the thin ice layer and lost to the atmosphere and space. As the ice thickened, all of the geothermal heat was retained by the ice for many thousands of years, not even reaching the surface after another 8,000 yr. when the ice had grown to a thickness of 3,000 m. During this interval, the bottom temperature of the ice increased from −32.6° C. to −20.6° C.
With the discovery of the new and significant information on the structure of West Antarctica,Reference Bentley 3 it appears desirable to re-examine the situation. The principal new fact revealed is the existence of a sub-ice channel, extending from the Ross Sea probably to the Bellingshausen Sea and bisecting West Antarctica. The rock floor of this channel varies from 500 m. to over 2,500 m. below present sea-level, the deepest part being found about 200 km. east of Byrd Station. Even if the ice should melt and the rock surface rebound to isostatic equilibrium, the deepest part of the channel would still be as much as 1,500 m. below present sea-level.Reference Bentley 4
One of the purposes of this paper is to estimate the minimum time it would take for the ice to build up to its present thickness in the neighbourhood of Byrd Station, where the elevation is 1,515 m. above sea-level and which is situated on an ice layer extending 800 m. below sea-level.Footnote * Computations will also be carried out in the region of the 4,300 m. thick ice discovered 200 km. east of Byrd Station. The ice temperatures observed in the top 310 m. will be used to estimate the speed of motion of the ice down the ice slope whose crest is 180 km. east and north-east of Byrd Station.
Accordingly, a new model will be examined having the following properties:
-
i. Initially, no ice exists in West Antarctica which is bisected by a channel connecting the Ross and Bellingshausen Seas.
-
ii. The period of glacierization begins as the sea in the channel freezes permanently and acquires accumulation, both from local precipitation and transport from the adjacent mountains.
-
iii. As glacierization continues, snow and ice accumulation, together with freezing from below, gradually thickens the floating ice over the channel until it becomes grounded.
-
iv. Annual ice accumulation is constant throughout growth of the ice.
We shall examine the growth of the ice in two stages using ice accumulation rates of a = 10 and a = 20 cm. yr.−1, respectively:Footnote †
-
Freezing of the sea-water and accumulation until the resulting ice shelf becomes grounded.
-
Subsequent accumulation until the ice reaches its present thickness.
Ice shelf grounding. At Byrd Station 2,300 m. of ice rest on rock 800 m. below present sea-level. If the ice should melt and the rock bottom be restored to isostatic equilibrium with no water above it, the rebound would be 2300 × 0.3 = 625 m., where 0.+9 g. cm.−3 is the ice density and 3.3 g. cm.−3 is taken as the rock density. Thus the rock surface would be 175 m. below present sea-level. But at the beginning of glacierization, sea-level would be higher by another 75 m., say, corresponding to the melting of all present Antarctic ice. The additional weight of 250 m. of sea-water would depress the ocean bed by about 75 m. Thus, the original rock surface at lat. 80° S., long. 120° W. would be 325 m. below the then prevailing sea-level.
Now, if a period of glacierization occurs, the resulting ice shelf would be grounded when its thickness reaches 400 m. This is computed from buoyancy considerations, using a density of sea-water of 1.027 g. cm.−3 and an average density of the ice shelf of 0.83 g. cm.−3, the latter being the observed value of the 260 m. thick ice shelf at Little America V.Reference Wexler 7 The 400 m. thick ice shelf will project 75 m. above sea-level.
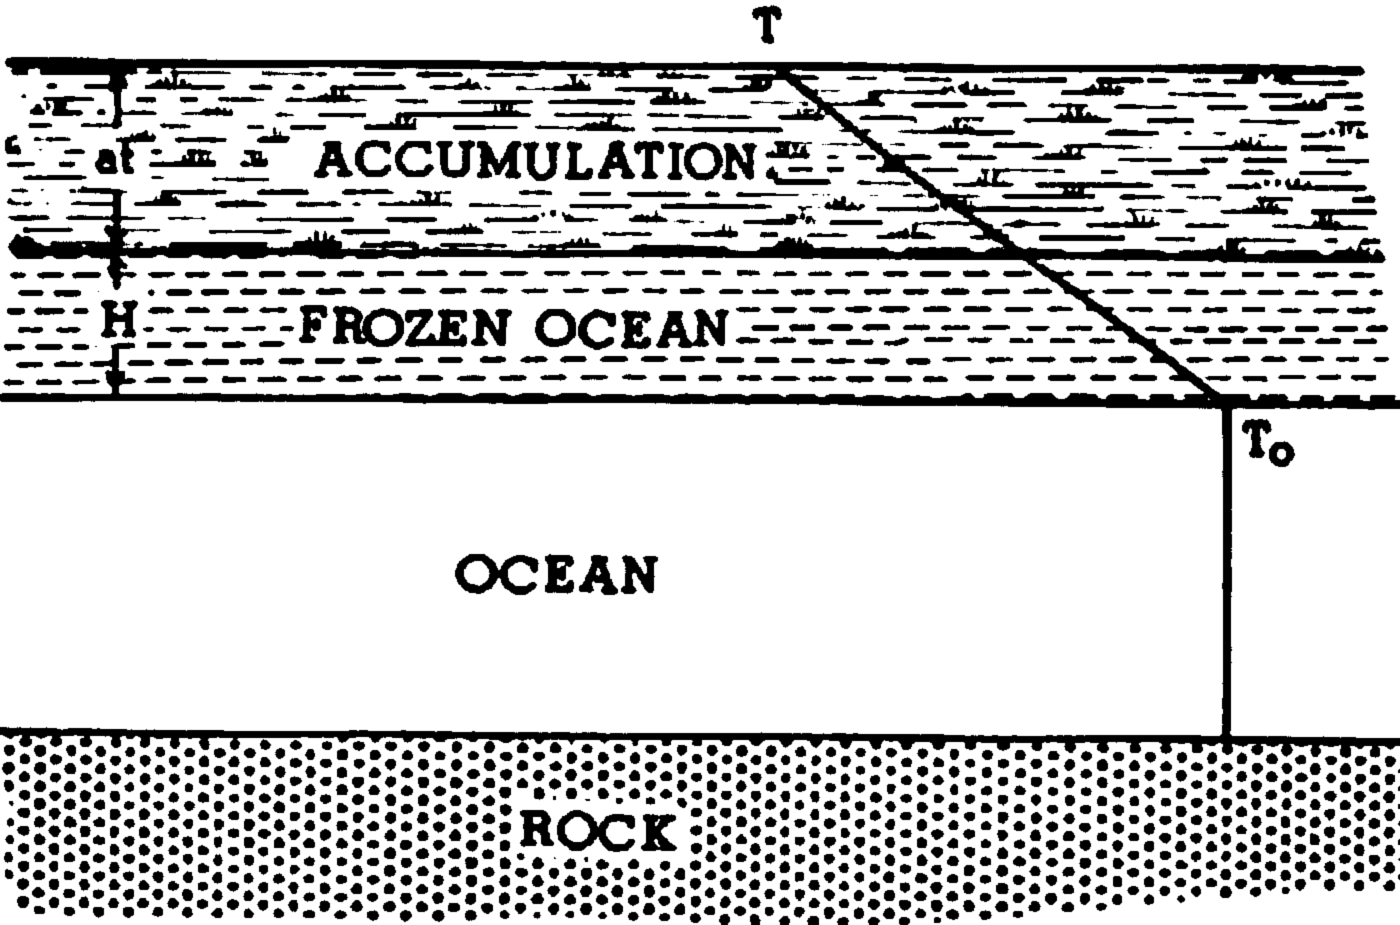
Ice shelf growth. Let Ts be the average annual temperature at the surface of the ice, T 0 the freezing point of sea-water at the bottom of an ice shelf of thickness (H+at), where H is the frozen portion of the shelf and at is the accumulated portion (Fig. 1). If the water temperature is at its freezing point, then the latent heat of fusion equals the heat conducted through the ice; assuming a constant temperature gradient in the ice, the following equation results:

Growth of the ice shelf by free zing and accumulation
where a is the accumulation rate,
-
T s = T s0 − γat is the cooling of the surface as it rises at the rate of a,
-
T s0 is the average air temperature at sea-level when the ice begins to grow,
-
γ is the rate of cooling as the ice accumulates, generally close to the adiabatic rate of 10−4 ° C. cm.−1,
-
L is the latent heat of fusion of sea-water = 80 cal. g.−1,
-
ρ is the density of ice = 0.92 g. cm.−31,Footnote * and
-
K is the conductivity of ice = 5.3 × 10⁻³ cal. cm.−1 sec.−1,
In this preliminary analysis, no account is taken of effects of salinity on K or L. 20
Equation (1) can be transformed to a type solved by ChiniReference Kamke 21 and the result is given below:

where

This transcendental equation was solved by inserting values for (H+at) and solving for t. Special cases were also computed by omitting the adiabatic cooling of the surface as the ice sheet thickened:
Case i. If in equation (1) we let γ = a = 0, we obtain

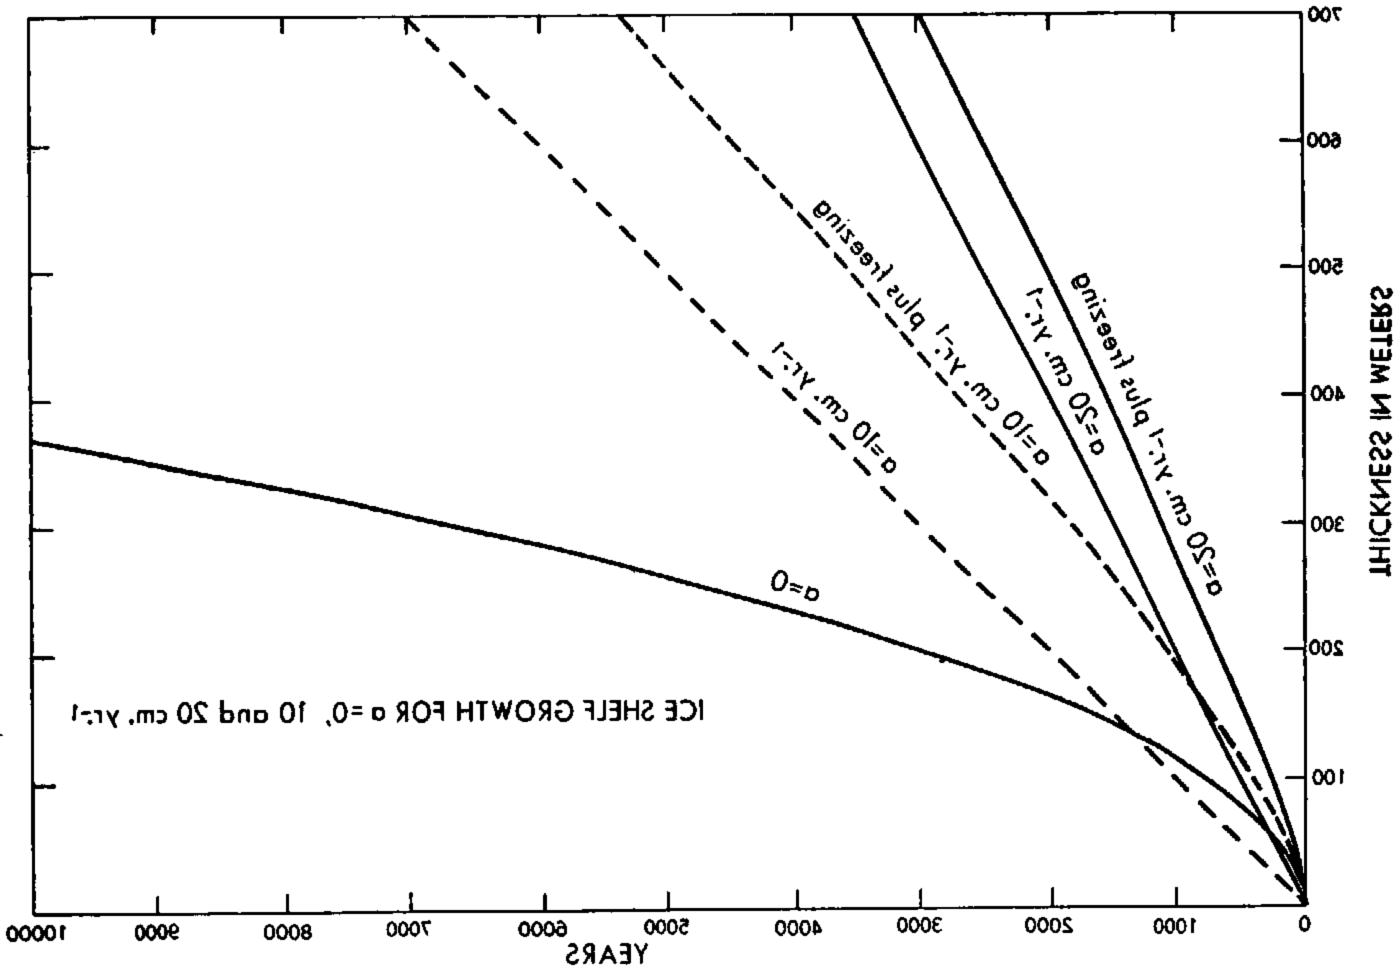
which is the well-known formula for the freezing of thin ice layers with no accumulation. In Figure 2 a curve labelled “v = a = 0” is plotted for T 0 − Ts = 30° C., and 11,700 yr. would be required for ice to become 400 m. thick by freezing alone. Also shown in Figure 2 are linear growth curves for pure accumulation rates a = 10 and a = 20 cm. yr.−1, assuming no freezing of sea-water or motions of the ice; these rates yield 4,000 and 2,000 yr., respectively, for 400 m. of ice to accumulate.
Growth curves of an aice shelf for a = 0, 10 and 20 cm. yr.−1
Case ii. If in equation (1), γ = 0 but a ≠ 0, we obtain after integrationFootnote *

Growth curves for combined freezing and accumulation computed from equation (4) are shown in Figure 2 labelled respectively “a = 10, 20 cm. yr.−1 plus freezing.” As expected, these curves show greater growth rate than either pure freezing or pure accumulation. For a 400 m. thick shelf, 2,680 yr. of combined freezing and 10 cm. yr.−1 accumulation would be required, or 1,570 yr. of combined freezing and 20 cm. yr.−1 accumulation. If equation (2) were used, these times would reduce to 2,660 and 1,560 yr., respectively, showing that the additional adiabatic cooling of the surface would decrease the time only slightly.
In reality, there will exist sinking and horizontal spreading of the ice layers. This process will have two effects: first, it will tend to decrease the thickness of the ice, and, secondly, the downward motion of colder layers of ice will increase the temperature gradient in the bottom layers, thus increasing the rate of freezing of the water beneath the shelf. Thus, the contribution to shelf growth by accumulation will be somewhat less than computed here while the contribution by freezing will be more. These two effects will tend to compensate one another so that the ice growth curves may be approximately correct even though spreading of the ice shelf is neglected in the computations.
Thus, we assume that the above computations are reasonably accurate and that the 400 m. thick ice shelf becomes grounded after 2,660 yr. of combined freezing and 10 cm. yr.−1 accumulation, and 1,560 yr. for combined freezing and 20 cm. yr.−1 accumulation. In accordance with the assumed model, the temperature profile will be linear with the bottom temperature at the pressure melting point of ice.
During growth of the ice shelf, the liberated geothermal heat from the underlying rock is transmitted to the water, which, in turn, may transfer some of it to the ice and transport the remainder through the channel to the ocean. In our calculations we have assumed that the water is at its freezing point and that there is no transport of energy to the ice other than that released by the latent heat of fusion. If there were other appreciable sources of energy supply, such as geothermal or frictional heat, the freezing process would be slowed or reduced to zero, or even reversed into melting as described elsewhere.Reference Wexler 7 Since our model rests on the assumption that the ice shelf becomes grounded, this means either (i) that freezing of the sea-water continues until the ice becomes grounded or (ii) that freezing from below is inconsequential after a certain thickness is reached and that the ice later becomes grounded by the weight of the accumulated ice forcing the shelf down into contact with the underlying rock, squeezing out the water laterally.
Ice sheet growth. Further growth of the grounded ice sheet occurs by accumulation alone until the observed thickness of 2,300 m. is reached. If this were accomplished by accumulation alone, with no sinking of ice layers, the total time required would be 2,660 + 19,000 = 21,660 yr. for a = 10 cm. yr.−1 and 1,560 + 9,500 = 11,060 yr. for a = 20 cm. yr.−1. These estimates represent minimum atges for the respective accumulations, since spreading of the ice sheet and sinking of the ice layers will slow the upward growth. It does not appear possible to estimate maximum aes of the ice since to do so would require knowledge of the topography of the rock bottom of the channel as well as the topography of the growing ice sheet.Reference Nye 8
Steady-state temperature profiles. We shall assume that there exists a steady-state thermal condition in the 2,300 m. thick ice sheet. The steady-state temperature profile in the central area of an ice sheet has been computed by RobinReference Robin 9 taking into account ice strata sinking with a speed,

where x is the height above the bottom of an ice sheet of thickness H. Substituting for v in the steady-state thermal equation

where κ = K/ρc, c = specific heat of ice, yields the solution

where T 0 is the bottom temperature.
When a geothermal heat flux of 10−6 cal. cm.−2 sec.−1 Reference Bullard, Bullard, Maxwell and Revelle 10 is substituted for (dT/dx) x = 0 and H is substituted for x in equation (7), then (Ts −T 0) gives the difference between top and bottom ice temperatures: 21.4° C. for a = 10 cm. yr.−1 and 15.3° C. for a = 20 cm. yr.−1.
Since the surface temperature at the top of the Byrd Station ice is −28° C., the bottom temperature is well below the pressure melting point and the ice remains frozen.
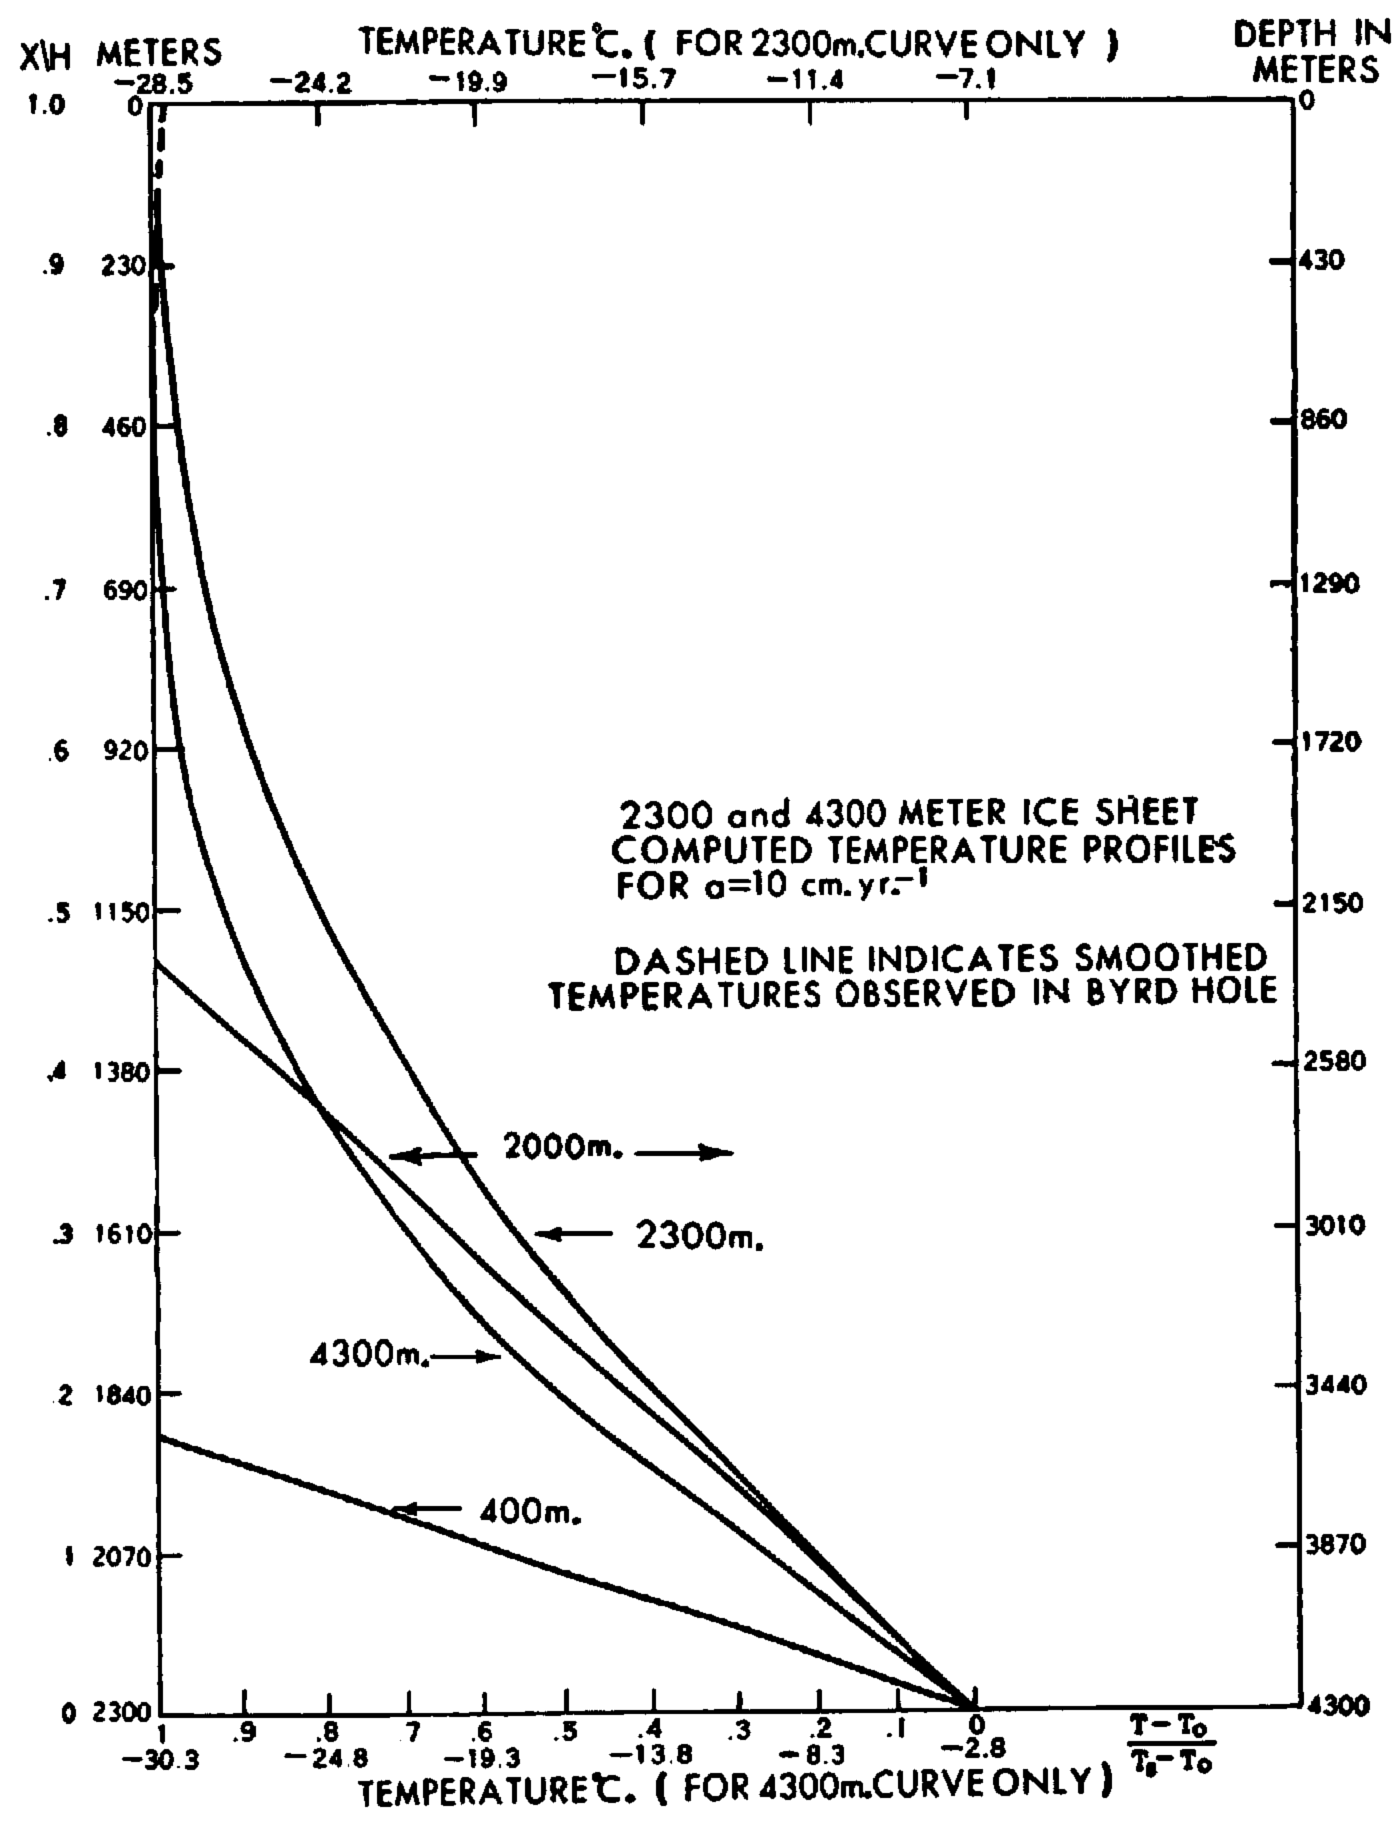
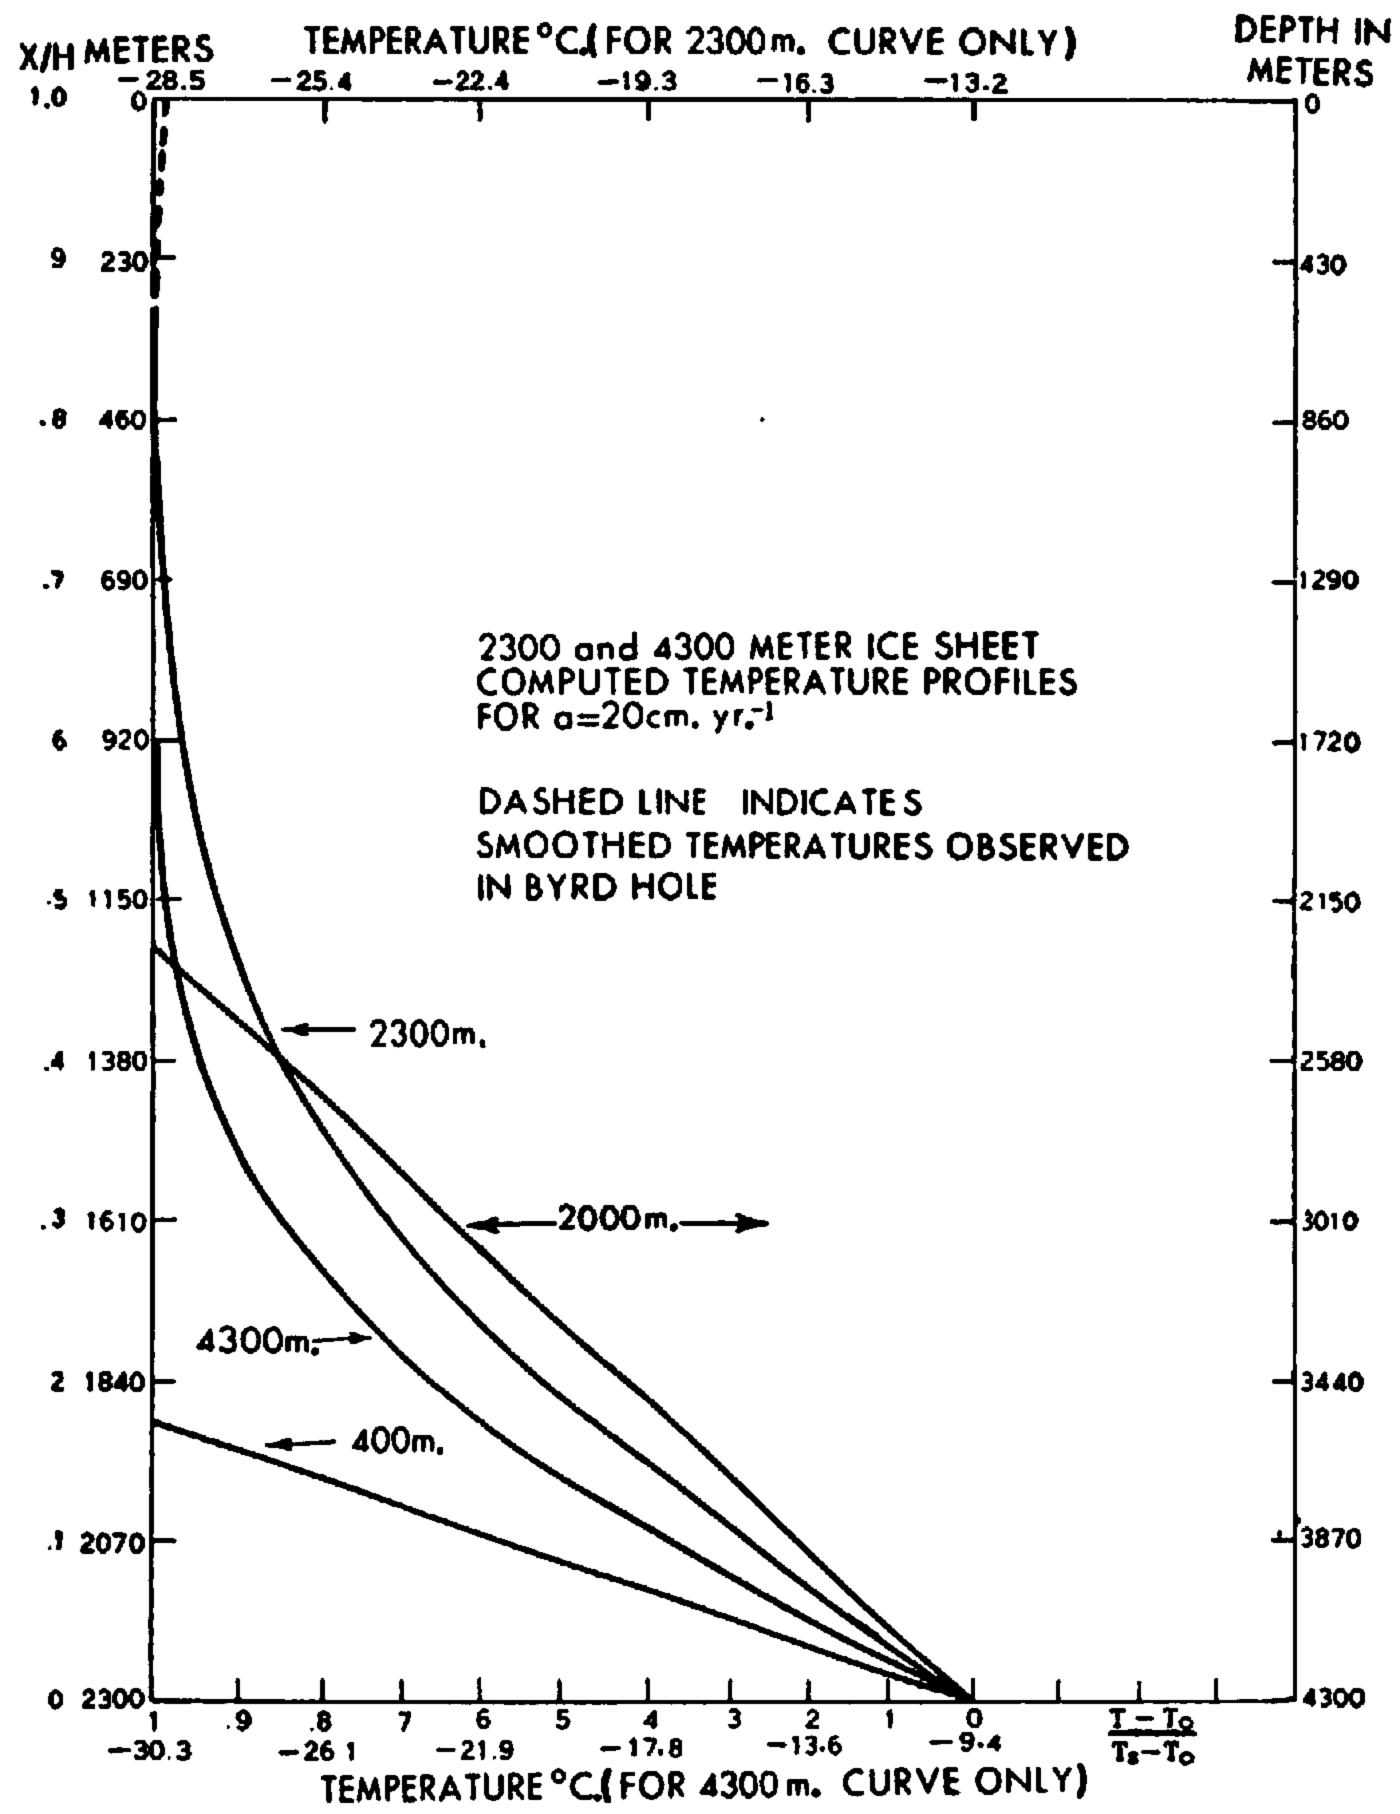
During the growth of the ice shelf, its bottom temperature is at the freezing point of seawater. When the ice shelf becomes grounded, the bottom temperature will be determined by the conduction of heat within the ice and the geothermal heat flux. For the 400 m. thick grounded ice shelf with linear temperature profile, illustrated in Figure 3, the heat conduction is 3.8 × 10⁻⁶ cal. cm.−2 sec.−1, or almost four times larger than the assumed geothermal heat flux. Therefore, the ice temperature at the bottom of the grounded ice must drop below the freezing point until the heat flux at the bottom of the ice equals the geothermal value. In subsequent growth of the ice sheet to 2,300 m. with vertical sinking of ice layers taken into account, the bottom temperature for the steady-state case is −7.1° C. for an accumulation rate of 10 cm. yr.−1 and −13.2° C. for 20 cm. yr.−1. Actually, as indicated the temperature measurements in the bottom layer of the hole through the Ross Ice Shelf of Little America VReference Wexler 7 the temperature gradient within the shelf is not constant and, in fact, is so large in the bottom layer that the heat conduction is over fourteen times larger than the assumed geothermal heat flux. Thus, it seems fairly sure that the temperature of the bottom of the ice shelf must decrease after grounding until the bottom temperature gradient is just large enough to transfer the geothermal heat flux and thus permit a steady-state thermal condition.
Computed temperature profiles for the 2,300 and 4,300 m. thick we sheets, a = 10 cm. yr.−1. Upper temperature scale refers to 2,300 m. ice and lower scale to 4,300 m. we (−2.8°C. on the lower scale is the pressure melting point). Linear temperature profiles are for the grounded 400 and 2,000 m. thick ice shelves. Left ordinate for 400 m. and 2,300 m. ice; right ordinate for 2,000 m. and 4,300 m. ice
Equation (7) can be divided by (Ts −T 0) to yield

from which are computed the 2,300 m. ice sheet steady-state temperature profiles shown in Figures 3 and 4. These profiles are plotted both in non-dimensional and unit ordinates. (The linear temperature profile for the 400 m. ice shelf is also shown.) In the top 310 m. there are drawn in both figures curves of the temperatures observed in the Byrd hole (see Fig. 5). The computed 2,300 m. profile for a = 20 cm. yr.−1 shown in Figure 4 appears to merge better with the observed curve than does the profile for a = 10 cm. yr.−1 shown in Figure 3. This seems to be explained by a slower sinking speed of the 10 cm. yr.−1, accumulating ice allowing heat from below to reach the surface in significant amounts.
Computed temperature profiles for the 2,300 and 4,300 m. thick ice sheets, a = 20 cm. yr.−1. Left ordinate for 400 m. and 2,300 m. ice; right ordinate for 2,000 m. and 4:300 m. ice
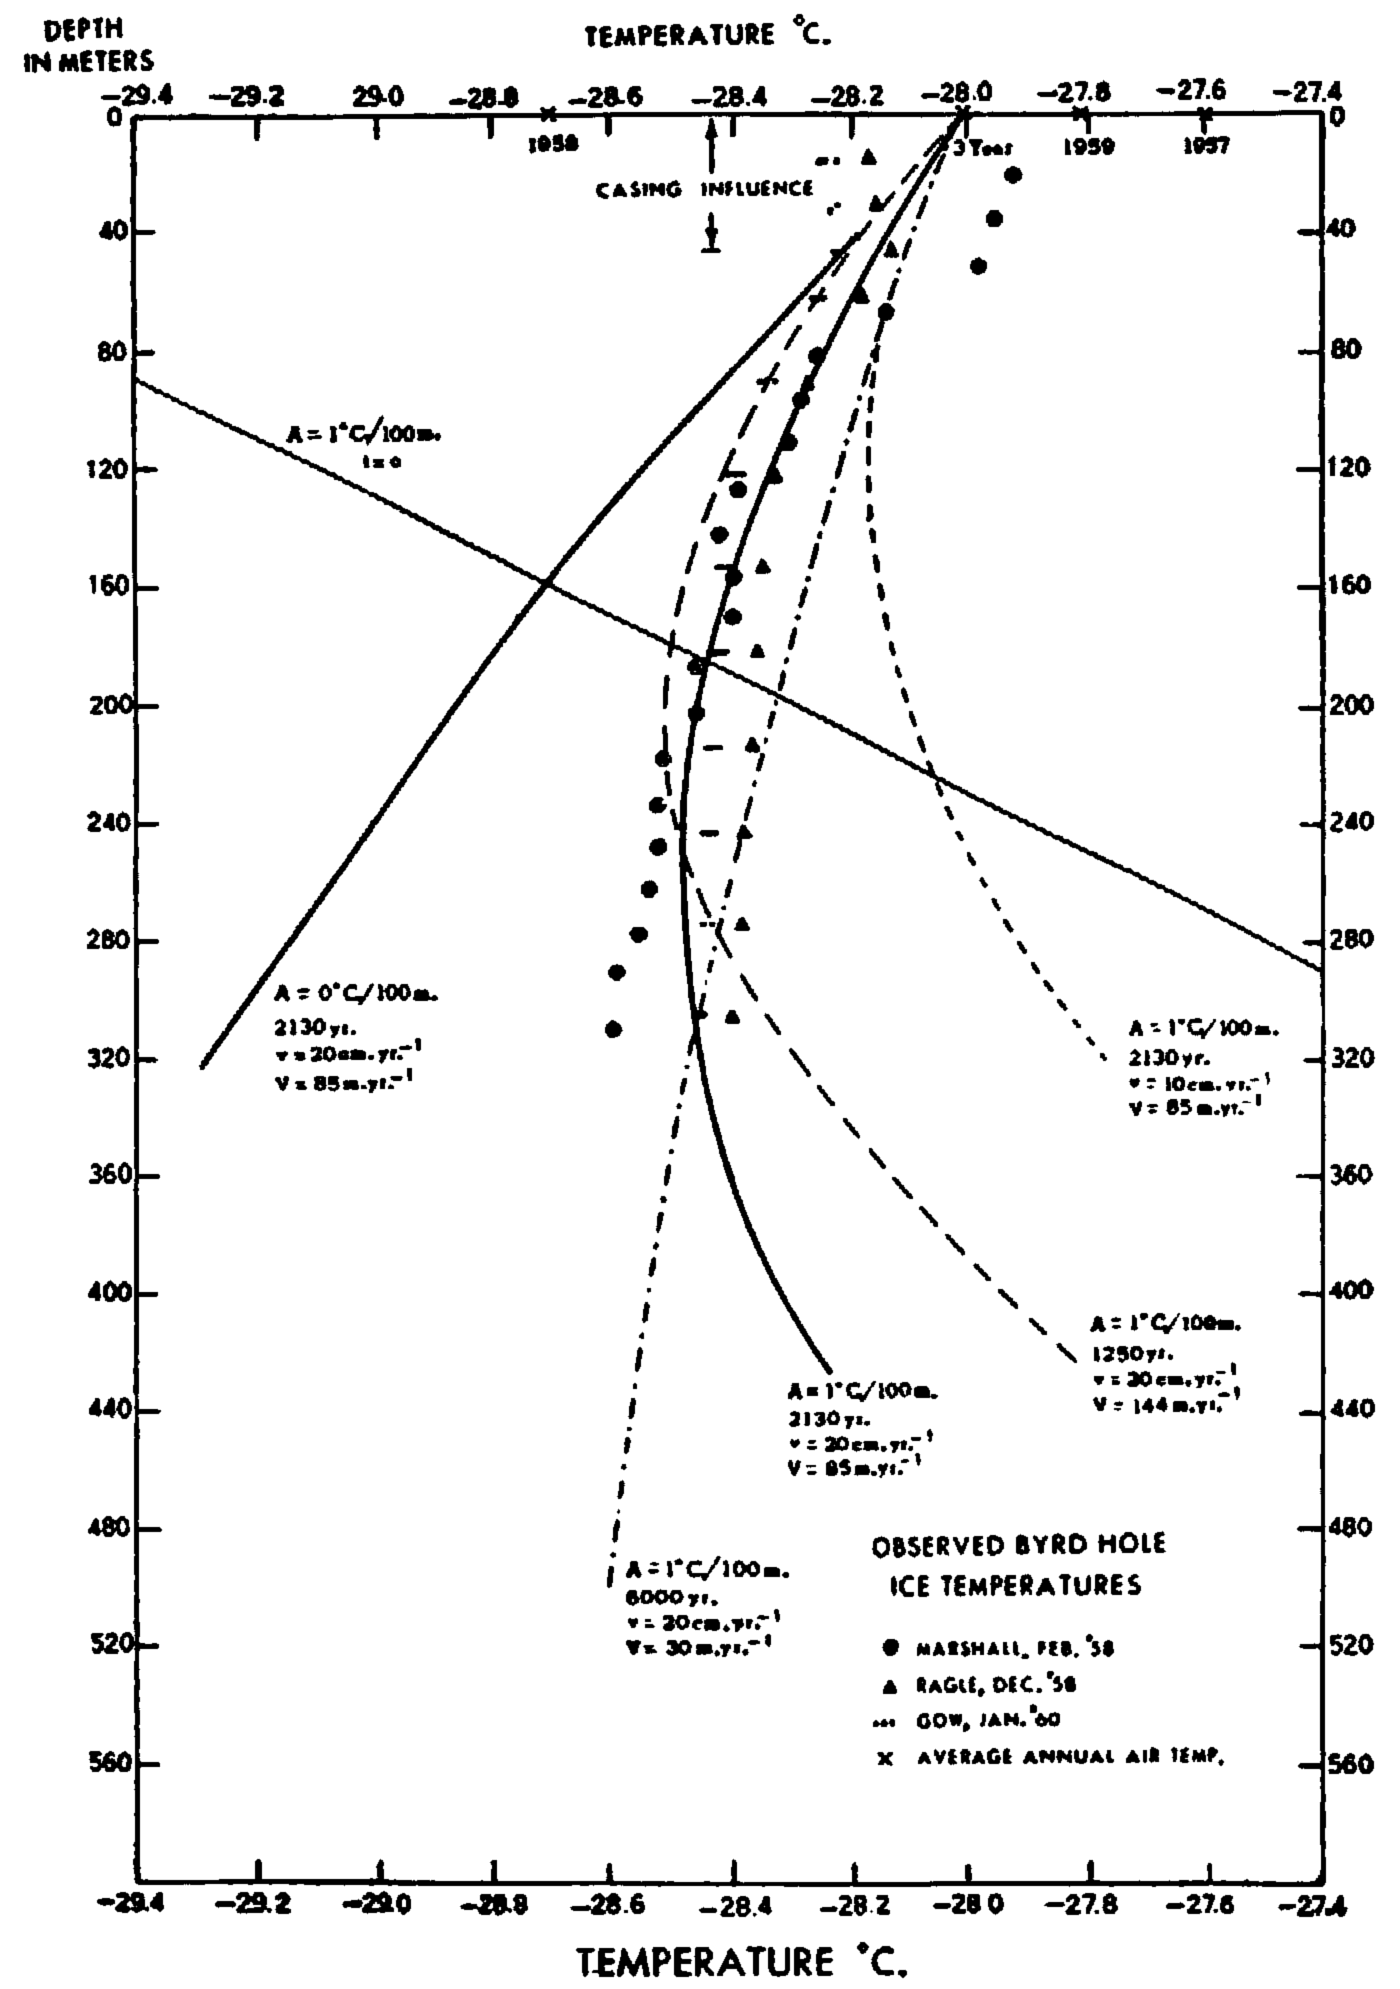
Observed ice temperatures in the deep hole at Byrd Station and various curves showing an assumed initial temperature profile and several computed temperature profiles for various times
Computations for the 4,300 m. thick ice. It is of interest to compute the minimum age and steady-state thermal structure of the thickest ice thus far observed on the Byrd traverse, or indeed anywhere in the world. This is a thickness of 4,300 m. found about 200 km. cast of Byrd Station at an elevation of 1,800 m. above sea-level, where the ice rests on rock 2,500 m. below sea-level.Reference Bentley 3
After glacierization begins, the ice shelf forming in that area will become grounded when a thickness of 2,000 m. is reached. This value is based on consideration of isostatic equilibrium of the rock in absence of ice and with a sea-level 75 m. higher than at present, as discussed earlier.
From equation (4) it will take 17,700 and 9,300 yr. of accumulation of 10 and 20 cm. yr.−1, respectively, combined with freezing of sea-water to form an ice shelf 2,000 m. thick. From equation (2) the times would be 17,390 and 9,220 yr. respectively. The subsequent accumulation to 4,300 m. thickness would require a minimum additional 23,000 and 11,500 yr., making a total of 40,390 and 20,720 yr., respectively, as the minimum times required to lay down the thickest ice.
The steady-state temperature profiles for 4,300 m. thick ice are shown in Figures 3 and 4 for both the initial shelf phase at the time the ice is grounded and for the entire ice layer. It is seen that the upper half of the ice layer is practically isothermal, with very little heat from below penetrating above the 860 m. depth for 10 cm. yr.−1 and above the 1,720 m. depth for 20 cm. yr.−1. Motion of the surface layer of ice will introduce a slight temperature increase as the surface is approached, but this is not indicated in the 4,300 m. curves in Figures 2 and 3.
In the region of thick ice 200 km. east of Byrd Station, the 10 m. temperature is about −30.3° C. For a = 20 cm. yr.−1, the temperature at the bottom of the 4,300 m. thick ice is −9.4° C., several degrees colder than the pressure melt temperature of −2 8° C. However, for a = 10 cm. yr.−1, the bottom temperature is −0.7° C., or about 2° C. above the pressure melt point. Actually, the pressure melt point (p.m.p.) would be encountered when the ice sheet reached a thickness of 3,800 m. with a basal temperature of −2.5° C. From this point on in the growth of the ice sheet, there would be some basal melting but this would only slow down slightly the growth of the ice sheet since the ice accumulation of 10 cm. yr.−1 is 25 times larger than the maximum 0.4 cm, yr.−1 melt which would occur if all the geothermal heat were used for melting the ice. Consequently, the ice sheet would continue to grow until the present thickness of 4,300 m. was reached, with the melt water either escaping or remaining under the ice. From 3,800 m. on, the basal temperature would always remain at the p.m.p. corresponding to its thickness. Thus at 4,300 m. the basal temperature would be −2.8° C., as indicated by the bottom scale in Figure 3. The final temperature profile between 2,800 and 4,300 m. depth would differ slightly from the curve derived from equation (8) because of the difference in basal boundary conditions: bottom temperature “constant” at the p.m.p. instead of constant heat flux equal to the geothermal rate.
The conclusion reached here, namely, that for an accumulation rate of 10 cm. yr.−1 in ice thicker than 3,800 m. and subjected to geothermal heat flux of 10−6 cal. cm.−2 sec.−1 there may be several hundred meters of basal ice within a few degrees of the p.m.p., may have some connection with Bentley’s observations of a basal layer of low seismic speed, 250 to 300 m. average thickness, found in the very deep ice in Byrd Land.Reference Bentley 4 Since this condition would not hold for an accumulation rate of 20 cm. yr.−1 it is important to see if the accumulation rates in the regions of very thick ice are closer to to than to 20 cm. yr.−1.Footnote *
Observed temperatures at the Byrd hole. In Figure 5 points are plotted, representing temperatures measured in the 310 m. hole drilled in the ice by the U.S. Army—SIPRE drill team in January–February 1958. The temperatures designated by circles were measured by E. W. Marshall in February 1958.Reference Marshall and Gow 2 The points designated by triangles were measured by R. Ragle in December 1958.Reference Ragle 6 Two major discrepancies exist: the first, in the layer between the surface and 70 m.; the second, in the layer from 120 m. to the bottom. The following comments were received from B. L. Hansen:Reference Hansen 11
“Marshall’s temperature measurements were taken using a 100 ohm copper resistance thermometer and a temperature indicator. The limit of error on the resistance thermometer is ±0.1° C. and there is a limit of error of 0.1° C. on the temperature indicator. It is possible, but not probable, that any of the temperature data obtained with this equipment can be in error by as much as 0.2° C. The temperature indicator is calibrated to fifths of a degree centigrade, a division being approximately

“Marshall’s data were obtained after the hole had been drilled. The drilling operation causes the hole to be warmed up a greater amount at the top than it is at the bottom because the air flows past the higher level for a longer period of time than it does the lower level. This effect accounts for the steeper gradient observed by Marshall. A similar effect was observed at Site 2 [Greenland] in 1957, the difference in the gradients being nearly the same as the difference in the two sets of observations at Byrd Station. Valid temperature data can be obtained as the hole is being drilled if observations were taken at the bottom of the hole each time the drill string is pulled. It was not possible to do this at the time the hole was drilled at Byrd Station.”
A third set of temperature measurements was made by A. J. GowReference Gow 12 in January 1960, using three thermistor type sensors, Nos. 2, 3 and 4. Sensor No. 4 had also been used in the December 1958 measurements but the conversion to temperature was made from a more precise method than was the case in 1958. The results of all the temperature measurements, including the original 1958 determinations, are shown in Table I.
Byrd Station Deep Hole Temperature
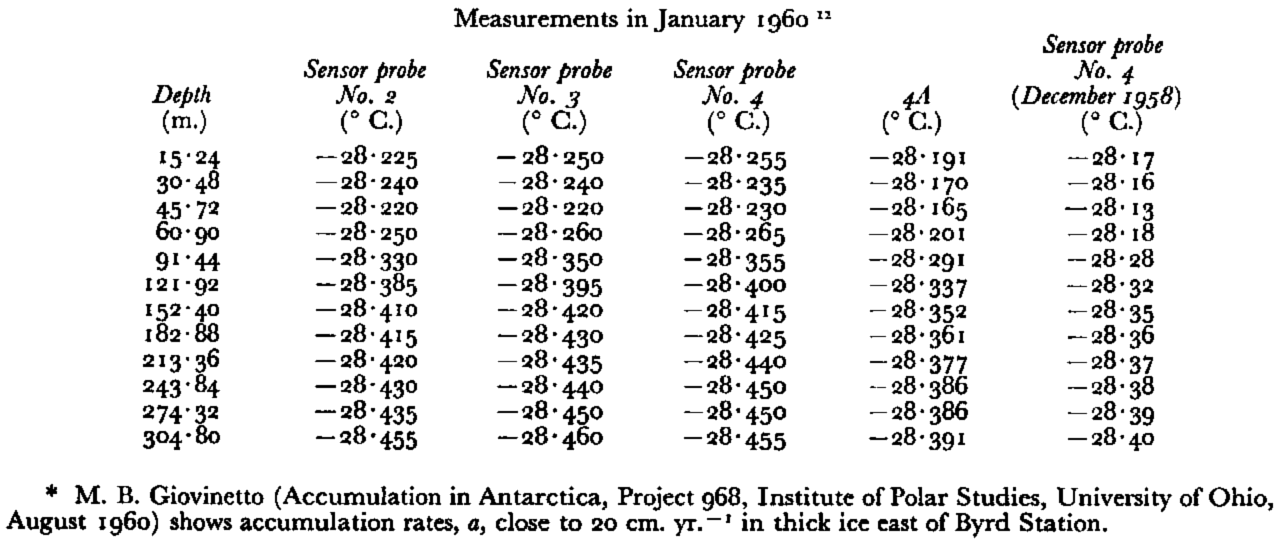
Column 4A gives the 1960 data from sensor No. 4 but using the December 1958 conversion formula. As Gow points out, this formula gives temperatures which are 0.064 ± 0.001° C. higher than the formula used in January 1960.
In Figure 5 are plotted three additional sets of temperatures corresponding to values with columns labelled, Sensors Nos. 2, 3, 4 in Table 1. Below 180 m. depth these temperatures fall between Marshall’s February 1958 values and Ragle’s December 1958 values. Above 120 xn. the various temperatures diverge, reaching a maximum difference of 0.33° C. at 20 m. depth, the January 1960 temperatures being the lowest and the February 1958 temperatures the highest. It is interesting to note that in the lowest 150 m., despite a temperature difference of about 0.06° C., the December 1958 and January 1960 temperature profiles are nearly parallel to each other. Even the best-fit straight line drawn through the February 1958 points is closely parallel to the latter profiles in the lowest 100 m. or so.
Two interpretations may be made of this decreasing temperature with depth in the ice: one, that it is a result of a climatic warming, which causes successively warmer strata of snow to be deposited one on the other, despite the tendency towards cooling of surface as the ice sheet thickens; the other is a result of ice motion down slope to warmer temperatures.
Climatic warming. If the annual accumulation is 10 (20) cm. of ice, it would require 1,500 (750) yr. of snowfall to build up the bottom 150 m. of ice at Byrd Station (neglecting compaction). During this time the ice temperature at the top would become 0.042° C. higher than that at the bottom. If no geothermal heat flux to these top layers is involved,Reference Wexler 1 then one could say that a climatic warming at the rate of 0.028° C. (0.056° C.)/1,000 yr. occurred. Actually, the rate would be larger since the raising of the snow surface by at least 150 m. would normally cause a cooling of 1.5° C. because of the usual decrease of temperature with altitude. Thus, this line of reasoning would indicate a climatic warming in the vicinity of Byrd Station of 1.528° C. (1.556° C.)/1,000 yr. This is equivalent to 0.069° C. (0.07° C.)/45 yr. or about 2.6 per cent of the temperature rise estimated at Little America during the period 1912–57.Reference Wexler 13
Ice motion. The second interpretation of the decreasing temperature with depth would be not in terms of climatic change, but as a result of motion of the ice down-slope from colder to warmer temperatures.Reference Robin 9 This involves a change of temperature with time and hence is not a steady-state problem as was assumed to be the case for the 2,300 and 4,300 m. thick ice sheets in examining primarily conditions in the bottom layer. Now we are interested in a relatively thin top layer and assume non-steady state.
If T 0 + Ax is the linear temperature profile at t = 0, then the new temperature profile is given by

where x is the depth,
-
t is the time the ice has been in motion,
-
U is the constant vertical sinking speed of ice strata,
-
β is the constant rate of surface temperature change.
This solution of the non-steady state one-dimensional heat conduction equation

was found by BenfieldReference Benfield 14 , Reference Benfield 15 for a semi-infinite solid of constant thermal diffusivity, κ, constant vertical speed, u, and subject to a constant rate of surface temperature change, β. RadokReference Radok 16 showed that equation (9), or more precisely, its derivative cart be applied to an ice sheet of unchanging elevation, where, because of net accumulation, the ice is continually moving downward and outward from the center of the sheet, provided

where α is the surface slope,
-
λ is the gradient of the annual average air temperature along the sloping ice surface,
-
V is the down-slope speed of ice motion.
Radok also showed that when equation (9) is differentiated to give the vertical temperature gradient, γ 2, as a function of depth, x, and time, t, then as t→∞, γ 2→γ 1 = −αλV/v, which is Robin’s formula for the vertical temperature gradient of moving ice in absence of heat conduction.Reference Robin 9
The above expression (11) for β is based on an assumption of mass steady state of the ice sheet, i.e. no change in its elevation since v, the sinking speed of ice strata, is taken as equal to the accumulation rate, a. If a > v the surface elevation rises and the snow surface would then become subjected to a lower atmospheric temperature at a rate of approximately 1° C. for each 100 m. increase in elevation.Footnote * Thus, if ΔT is the initial temperature difference between the crest and the site of Byrd Station and ΔT is the temperature difference after t yr. of buildup, then ΔT = ΔT′ since temperatures at both locations will be subjected to the same adiabatic cooling. Thus equation (9) will hold even if the ice sheet is growing.
By use of equations (9) and (11) we shall try to obtain a best-fit curve to the observed temperatures shown in Figure 5. To do this we must know the values of α, λ, v, V and A. The first two parameters are known from the Byrd Station traverses:Reference Anderson 18

The third parameter, v, is taken as 10 and 20 cm. yr.−1, respectively.
We shall assume that initially the ice at Byrd Station was at the ice crest, S cm. north-east of Byrd Station; therefore

where S = 180 km. = 1.8 × 107 cm. and t is the time the ice has been in motion.
The fifth parameter, A, is the vertical temperature gradient at the crest. Unfortunately, no measurements of this gradient have been made below the level of seasonal temperature fluctuations (roughly 10 m. depth) so that we are forced to assume a value. This value, taken as the adiabatic rate of 1° C. increase with each 100 m. increase in depth, is based on the surface layer assuming the average air temperature at that elevation as it slowly builds up. This process assumes no climatic warming or cooling. In absence of data, we take A = 1° C./100 m. for most of the computations but shall also compute a curve for an initially isothermal column of A = 0° C./100 m.
There has not been a sufficiently long period of astronomical fixes to determine precisely the positions and motions of Byrd Station, so that the value of t in equations (9) and (12) is not known. We shall, therefore, try various values of t to see which best fits the observed temperatures.
The results are shown in Figure 5, where one straight line, four curved lines and one quasi-straight line are drawn. The straight line labelled t = 0, A = 1° C./100 m., represents a portion of the assumed initial linear temperature profile of 1° C. increase per 100 m. at the ice crest, where the average annual (10 m. snow) temperature is −30.3° C. The four curved lines are computed from equations (9), (11) and (12), where in each case, A = 1° C./100 m. and (T−T 0) = 2.3° C., the difference in average surface temperature between the crest and Byrd Station. The quasi-straight line, labelled A = 0° C./100 m., is the new temperature profile of ice, initially isothermal, after 2,130 yr. of motion down slope.
Three of the curves are for v = 20 cm. yr.−1 and t = 1,250 yr., 2,130 yr., and 6,000 yr. corresponding to down-slope speeds over the 180 km. distance of 144. m. yr.−1, 85 m. yr.−1 and 30 m. yr.−1. The fourth curve is for t = 2,130 yr. but for only one-half of the sinking rate, or r = 10 cm. yr.−1.
It is quite apparent that the A = 1° C./100 m., 20 cm. yr.−1, 2,130 yr. curve gives the best overall fit of the five curves. Its main defect is a slight temperature increase with depth beginning at 250 m. while the observed temperatures continue to show a slight decrease. Increasing the time of motion to, say, 2,500 yr. (V = 72 m. yr.−1) would correct this defect but would introduce greater departures from the observed points above 200 m.
The nearly straight temperature profile, computed from the initially isothermal profile (A = 0), departs widely from the observed points. Perhaps curves for A = 0.8 or 0.9° C., located slightly to the left of the A = 1° C./100 m. curve would give an even better fit. It is possible, of course, that many other curves having different values of A and t would fit the observed points closely. To help settle the question of uniqueness it would be useful to have temperature measurements below 300 m. to find where the temperature actually does begin to increase with depth. And, of course, measurements of the initial temperature gradient, A, should be made at the ice crest to eliminate another source of error. Also, if from astronomical fixes, the movement of Byrd Station could be detected, Vcould be found.Footnote * By comparing the computed and observed temperature profiles, it might thus be possible to estimate the climatic trends of temperature in Antarctica for longer periods than hitherto found.Reference Wexler 13
Acknowledgements
The writer is grateful to C. R. Bentley and U. Radok for reading earlier versions of the manuscript and for their helpful remarks.



