INTRODUCTION
Israel is a semi-arid region, with rainfall restricted to the winter season. To bridge the gap between seasons, groundwater is extensively exploited. The Yarkon-Taninim aquifer is a major freshwater aquifer also known as the Mountain Aquifer or the Judea Group Aquifer. It is a carbonate aquifer of Upper Cretaceous age. To best exploit this resource it is imperative to know important hydrological properties such as flow direction and rate, aquifer extent, and if the aquifer is in actuality a single hydrologic unit or more than one, among other parameters. The waters contained within the aquifer are largely of good-quality drinking water, of Ca-Mg-HCO3 type. The oxygen and hydrogen isotopic composition of the groundwater relates them to precipitation associated with the Eastern Mediterranean Water Line (Gat and Dansgaard Reference Gat and Dansgaard1972), with recharge dominantly in the Judean Hills. The aquifer has generally been treated as a single unit, with the overwhelming majority of the wells being drilled to the shallower portions (above the regional aquiclude). Research is continually carried out to improve the hydrologic knowledge of the aquifer. Radiocarbon (14C) data has been analyzed sporadically since the late 1960s. 14C studies so far have enabled delineating paleo-water from relatively younger Judea Group water (Kronfeld et al. Reference Kronfeld, Rosenfeld, Weinberger, Flexer and Berkowitz1993), or have been confined to geochemical studies of a more geographically limited extent (Kroitoru et al. Reference Kroitoru, Carmi and Mazor1989; Avisar et al. Reference Avisar, Kronfeld, Kolton, Rosenthal and Weinberger2001). The present study follows the suggestion of Mazor and Kroitoru (Reference Mazor and Kroitoru1992) to carry out a south to north 14C transect from Beersheba to the Taninim spring from available and new data.
THE YARKON-TANINIM AQUIFER
The Judea Group aquifer consists of massive limestone and dolomites. An upper aquifer unit of ~300 m thickness is separated from the lower aquifer units of ~ 400 m thickness by the intervening Motza Formation, which can be considered to be aquiclude/aquitard of ~100 m. The aquifer has a primary recharge region in the Judean Hills, where the majority of the rain falls, and the rock units are exposed. These mountains extend north–south, in the middle of the country, parallel to the Mediterranean Sea coast. Part of the aquifer drains eastwards to the Jordan Valley while the other part drains from the recharge westward. It is this latter western section of the carbonate aquifer, termed the Yarkon-Taninim aquifer that will be discussed. The hydrologic properties and flow directions of the aquifer were laid down by Mandel (Reference Mandel1961). He named the aquifer after the two major springs that he considered to be the principal discharge. In this hydrologic model recharge that flows down dip westwards towards the sea encounters a facies change from carbonate to impervious shale (the Talme Yafe Group). This prevents discharge seawards and redirects the flow northwards to discharge at the two springs. Subsequent computer modeling (Baida et al. Reference Baida, Goldshof and Kidron1970) added the Beer Sheba region (Figure 1), having higher static water levels (25 m above sea level) than that of the Yarkon spring (16.5 m) or the Taninim springs (4–11 m), to the Yarkon-Taninim conceptual model. Its groundwater is assumed to flow northwards to mingle with the rest of the Judea Group groundwater. Later studies have raised the possibility that there are flaws in this hydrologic construct (Mazor and Kroitoru Reference Mazor and Kroitoru1992; Kronfeld et al. Reference Kronfeld, Rosenfeld, Weinberger, Flexer and Berkowitz1993; Weinberger et al. Reference Weinberger, Rosenthal, Ben-Zvi and Zeitoun1994; Avisar and Kronfeld Reference Avisar and Kronfeld2009; Rosenthal et al. Reference Rosenthal, Weinberger and Kronfeld1999). Still hydrological conceptual models consider this to be a single aquifer unit (e.g. Dafny et al. Reference Dafny, Burg and Gvirtzman2010), or as a single aquifer composed of two subaquifers (e.g., Laskow et al. Reference Laskow, Gendler, Goldberg, Gvirtzman and Frumkin2011) with hydraulic connection implied between them.
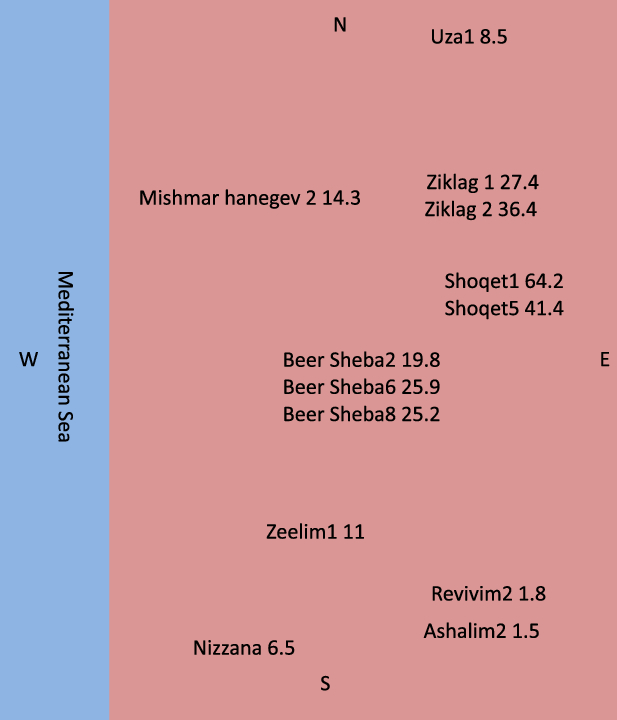
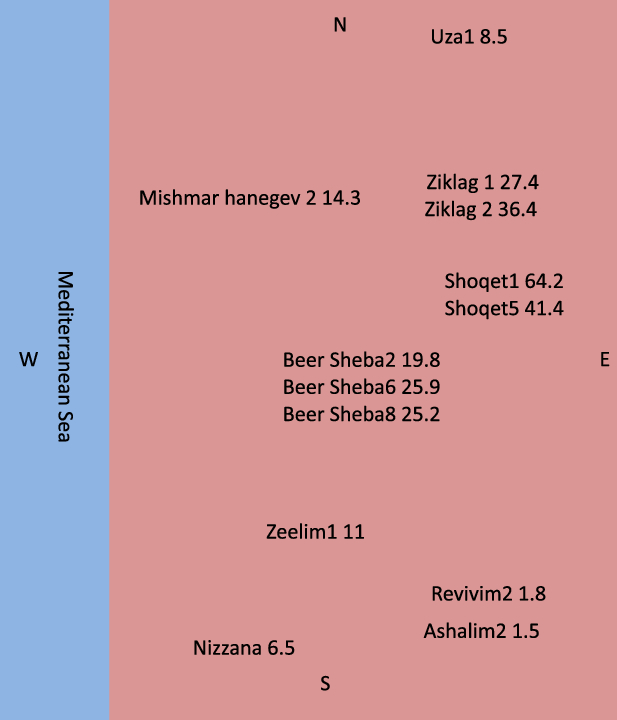
The disposition and 14C values (pMC) in the wells of the Beer Sheva region.
SAMPLING AND RESULTS
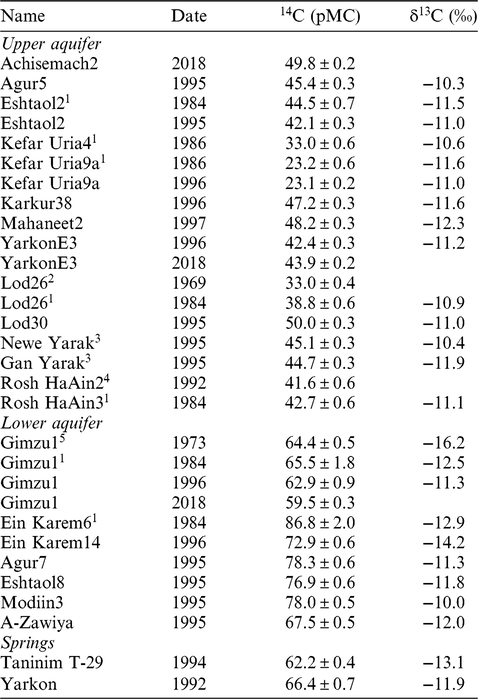
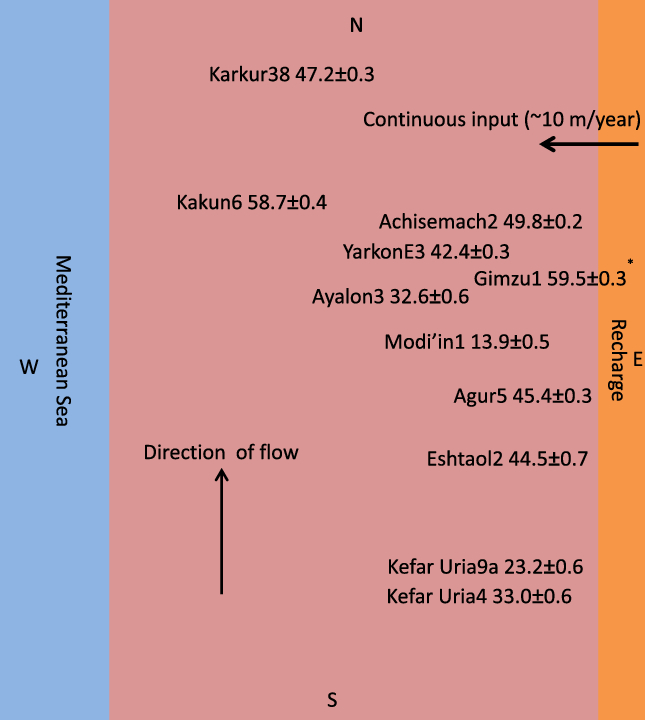
Samples were collected from 1969 to 2018. All samples were collected at the well head in 20-L plastic jerry cans and taken to the Weizmann Institute of Science for processing (except for the 1973 Gimzu1 sample, which was processed in the laboratory of Prof. Geyh in Germany). Dissolved inorganic carbon was extracted from the water. 14C was measured in gas proportional counters except for the 2018 samples, which were measured in accelerator mass spectrometry (AMS). The stable isotopes were measured by mass-spectrometry. δ13C values of the total dissolved inorganic carbon are reported relative to the PDB standard, with a precision of 0.2‰ (Table 1). The data in the table is a compilation of our data from 1995 to 1997 and 2018 augmented by relevant data from other sources: Carmi et al. (Reference Carmi, Noter and Schlesinger1971), Kroitoru (Reference Kroitoru1987), Mazor and Kroitoru (Reference Mazor and Kroitoru1992), Kronfeld et al. (Reference Kronfeld, Rosenfeld, Weinberger, Flexer and Berkowitz1993), Avisar et al. Reference Avisar, Kronfeld, Kolton, Rosenthal and Weinberger2001. The Upper sections of the Judea Group aquifer have been significantly more exploited compared to the Lower aquifer. Therefore, there are more 14C data for the Upper than for the Lower. Most of the existing wells are located in the central Yarkon-Taninim aquifer region. Two wells in Table 1—Ein Kerem 6 and 14—are located in or near to the recharge in the hills, while the other wells are all confined wells to the west. The Gimzu1 well (Figure 2) was the first well drilled to exploit the deeper portions of the aquifer. It was only fortuitously deepened by greater depths than planned (J. Kolton, personal communication 2001) and then found to contain abundant high-quality water.
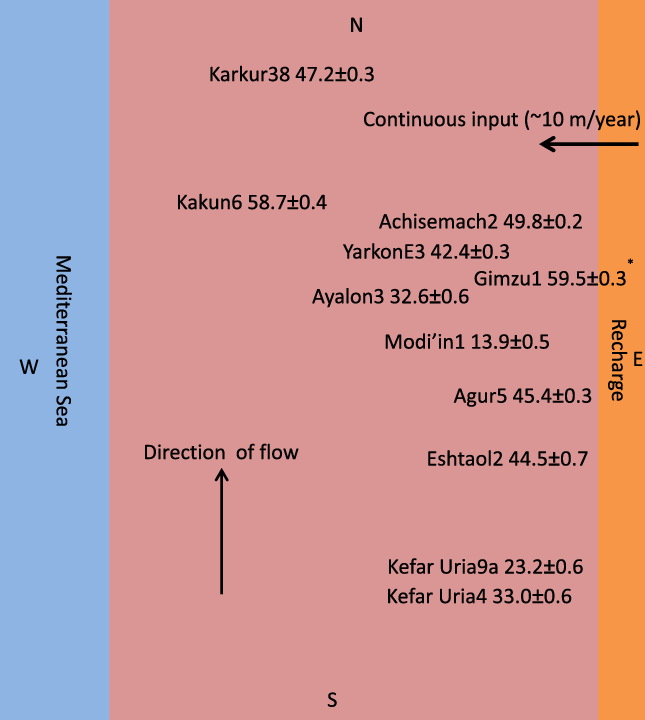
The relative positions and 14C values (pMC) in wells of the Upper aquifer in the Yarkon region, immediately north of and contiguous with Figure 1. The Gimzu1 well representing the first of the Lower aquifer wells is shown in its relative geographic position in comparison to the wells from the Upper aquifer wells.
Carbon isotopes in the Yarkon Taninim aquifer: Upper, Lower, and springs.*

*Our data and additional data from Kroitoru (Reference Kroitoru1987)1, Carmi et al. (Reference Carmi, Noter and Schlesinger1971)2, Avisar et al. (Reference Avisar, Kronfeld, Kolton, Rosenthal and Weinberger2001)3, Mazor and Kroitoru (Reference Mazor and Kroitoru1992)4 and Geyh (personal communication 1973)5.
The 14C activity in the groundwater of the deeper, Lower Aquifer (~60 to ~87 pMC) is considerably greater than the Upper aquifer (23–50 pMC). Comparative analyses for individual wells carried out over time, are in good agreement (Table 1).
The range of δ13C values (Table 1) is indistinguishable as a group between the upper and lower aquifers. Carbon isotope fractionation occurs as the recharge enters the aquifers in the hill region. Gonfiantini and Zuppi (Reference Gonfiantini and Zuppi2003) have shown that the carbon isotopic interaction between the groundwater DIC and the carbonate host is a very slow process that takes place over long periods (thousands of years) of time. Thus, the difference in the 14C activity should not be interpreted as water rock interaction reducing the activity of the radioactivity. Rather the difference in 14C activity values is a function of radio-decay within the groundwater. The upper aquifer flows slower than the Lower aquifer. The Lower aquifer has higher 14C activity values than the Upper, which is a function of flow rate.
DISCUSSION
Flow Velocity Using 14C
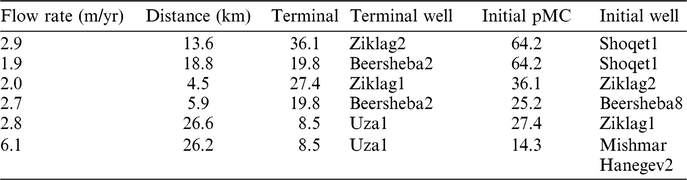
The 14C in the groundwater of Yarkon-Taninim aquifers is discussed in two parts. The original section described by Mandel (Reference Mandel1961) and the Beer Sheba extension (Baida et al. Reference Baida, Goldshof and Kidron1970) added on later. In the Beer Sheba region, there is no 14C data for the Lower aquifer. The exploitation wells are from the upper aquifer. In Figure 1 14C activity in these wells shows that there is a marked decrease in the wells at the southern portion of the aquifer. This also the region where high salinity makes the water in the Judea aquifer not useable for drinking purposes. It is also characterized by anomalously higher temperatures. This has been interpreted as mixing with the underlying saline artesian Nubian Sandstone aquifer, having no 14C that is rising along faults and intruding the Judea Aquifer (Kronfeld et al. Reference Kronfeld, Rosenfeld, Weinberger, Flexer and Berkowitz1993). 14C cannot be used to determine water flow here. To the north of this area the Judea Group aquifer provides good quality drinking water for the city of Beersheba and environs. It is assumed that changes in the 14C activity are related to groundwater movement over time from the recharge area. This can be seen in Figure 1. There is a clear trend of decreasing 14C activity from wells nearest to the recharge compared to wells to the west and to the north. This is related to the rate of flow. Table 2 calculates the flow rate from well to well in this area. The average calculated rate of flow, using 14C, for the Upper aquifer is 3.7 ± 1.6 m/yr. With the assumption that the Beersheba region is part of the Yarkon Taninim aquifer, the estimated rate may be taken to represent the whole aquifer.
Estimate of the rate of flow in the Upper aquifer of the Beersheba region. The average rate is 3.7 ± 1.6 m/yr.

The Darcy Calculation
A method for calculating flow rate, independent of 14C, is the Darcy Equation. It can be written as v=-KΔh/Δl, where v is the velocity of flow, K is the hydraulic conductivity, Δh is the difference in water levels between two sites, and Δl is the distance between them. K, the hydraulic conductivity is specific to each aquifer. For the upper sections of the Judea Group it is generally in the range of 100–200 m/day (Guttman et al. Reference Guttman, Kronfeld and Carmi2011). This equation was employed for the whole aquifer (~140 km from the Beer Sheba region to the outlet of the Taninim springs) With a gradient of only (25–11 m)/140 km times the flow velocity should be small, and is calculated to be range of 3.7–7.3 m/yr. There is a good agreement between the two methods.
Northward Flow Mixing with Recharge from the Judean Hills in the Upper Aquifer
The well of Uza1 (8.5 ± 0.2 pMC, Table 1) is the northernmost in the Beersheba region, close to the middle part of the aquifer. In the absence of nearby wells and the lack of 14C data at this hinge area, it is assumed here that the Uza1 type water’s 14C activity changes as it flows northwards and mingles with more 14C enriched waters flowing more rapidly down a steeper gradient from the hills to the east. However, this is an assumption due to the lack of data from nearby wells. There exists the possibility that some portion (quantity unknown at present) of this water drains seawards through Neogene erosion channels (Weinberger et al. Reference Weinberger, Rosenthal, Ben-Zvi and Zeitoun1994; Rosenthal et al. Reference Rosenthal, Weinberger and Kronfeld1999).
Situated immediately north of the Uza1 well are the Kefar Uria 4 and 9a wells (Figure 2). The distance between the Uza and Kefar Uria wells is 40 km and at a rate of 3.7 m/yr flow would take the Uza water 11,000 years to reach Kefar Uria. Thus the 8.5 pMC of the Uza1 water would decay to 2.3 pMC. The rate of mass mingling of groundwater from the mountain recharge flowing westwards down slope, reflected by the 14C of the well of Eshtaol2 close to the recharge (Figure 2) encountering northward flow of the decayed Uza1 water is calculated by mass balance.
The result of calculation yields:
a. For KefarUria4 a mixture of 27% Uza1 water and 73% of Eshtaol2 water.
b. For KefarUria9a a mixture of 50% Uza1 water and 50% Eshtaol2 water.
Flow in the Lower Aquifer
The Lower aquifer has higher 14C values due to water of younger age flowing more rapidly from the recharge region. The upper flow is dominated by flowing through cracks and vugs in the host rock. The lower aquifer is faster due to flow through a karstic system. Dafny and coworkers (Reference Dafny, Burg and Gvirtzman2010) have reported on karst development in the Judea Group and its expected influence on increasing the hydraulic conductivity. Laskow et al. (Reference Laskow, Gendler, Goldberg, Gvirtzman and Frumkin2011) would have the karstic development concentrate lower down in the aquifer host rock. It is apparent that the Lower units flow faster through a better developed karstic system and under higher pieziometric pressure than flow in the upper aquifer units.
Contribution of the Upper and Lower Aquifers to the Water of the Yarkon and Taninim Springs
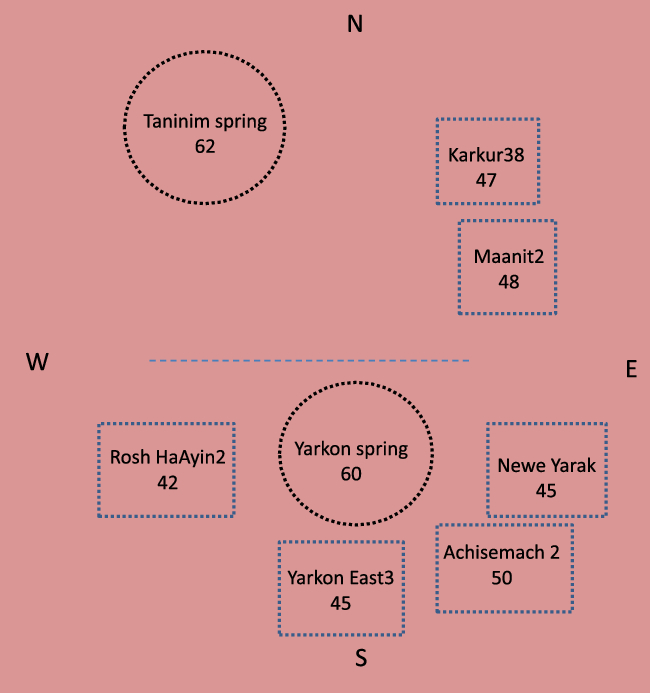
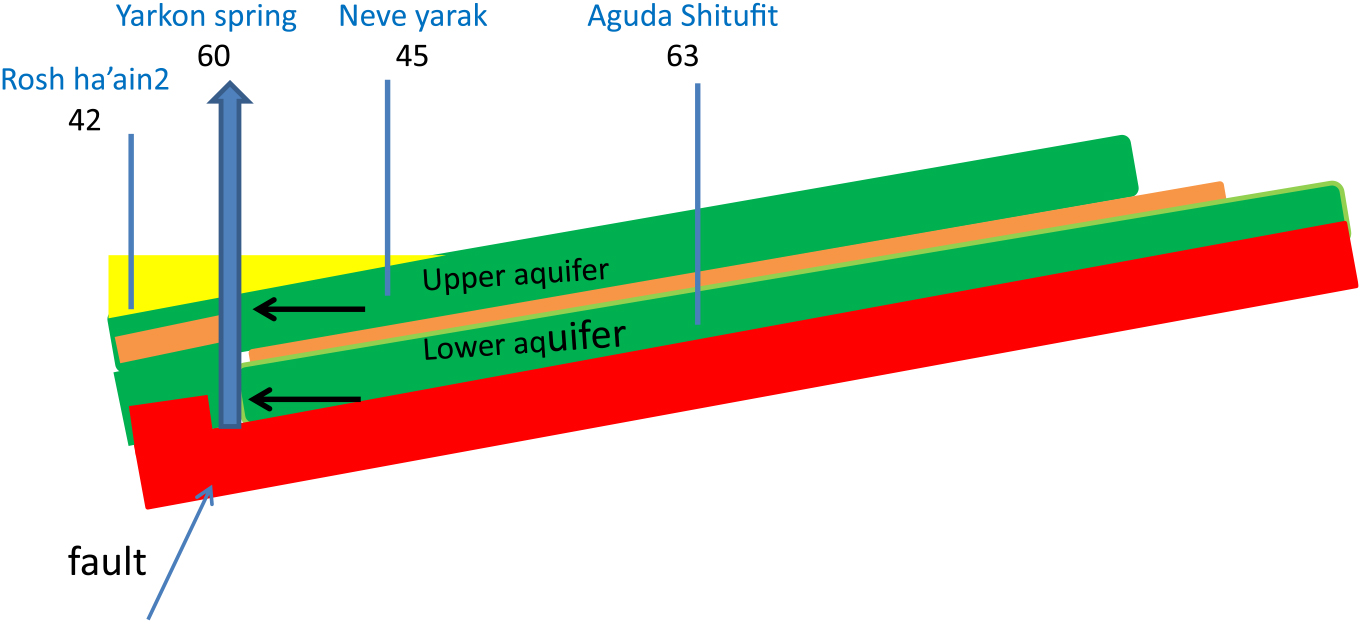
Figure 3 shows the 14C activity of the springs’ discharge as well as in the nearby exploitation wells, which are all from the Upper aquifer. The discharges from both the Yarkon spring as well as the Taninim spring are more enriched in 14C than that found in the immediately surrounding wells. Both the Yarkon and the Taninim springs are situated along fault lines. This can be seen in Figure 4, for the Yarkon spring. A very similar hydraulic system exists at the Taninim springs. The pressurized and rapidly flowing Lower aquifer water having 14C values similar to the initial recharge values, rise along the fault face. On the ascent it intrudes through the upper aquifer on the way to discharging at the surface. Thus, the output of the springs represents a mixture of the two aquifers. The contribution of each aquifer is calculated with 14C. The 14C in the Upper aquifer wells that surround the two springs are significantly lower than that of the spring. A mass-balance equation is used to calculate the proportion of two aquifer waters draining to the spring. For the Yarkon spring the balance is made using the Aguda Shitufit 14C for the Lower aquifer. The average 14C of the surrounding Upper aquifer wells is used. Thus the 14C and of the Yarkon springs (Figure 4) is:
 $$66.4 = 67.5{\rm X} + 44.6(1-{\rm X}).$$
Schematic map presenting the relative position and the 14C values (pMC) in the Upper aquifer wells surrounding the Yarkon and the Taninim springs with the 14C values of the two springs also depicted.

Schematic cross-section showing the 14C values (pMC) in the Upper aquifer wells surrounding the Yarkon springs and the 14C values in the Aguda Shitufit well, exploiting the Lower aquifer. This can be taken as representative of the hydrologic situation of the Taninim spring as well.
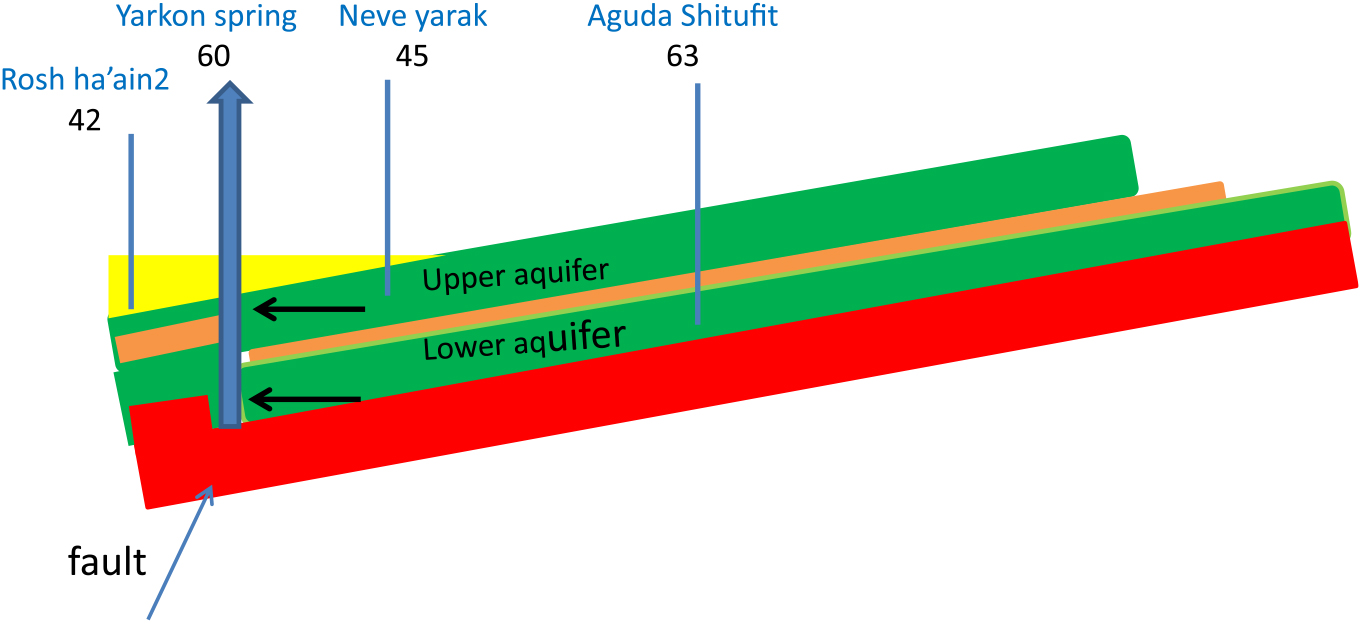
This yields contributions of 97% of the lower aquifer and 3% of the upper aquifer in the Yarkon spring.
There are no data for the lower aquifer in the vicinity of the Taninim spring. If we use the data of the Lower aquifer from the Yarkon area for the calculation, the Taninim spring is found to consist of 73% of Lower aquifer water and 27% Upper aquifer water. It can be expected that the mixing proportions may change in time as water is exploited from both aquifers. It is apparent though, that the drainage from the Lower aquifer, at both springs, comprises a significant component to the springs’ discharge.
CONCLUSIONS
14C is found to be an important tool used to gain a more complete understanding of hydrologic processes of the Yarkon-Taninim aquifer. There are two distinct, independent aquifers within the Judea Group aquifer that share the same general recharge region in the Judean Hills. The Lower aquifer unit is young and flows rapidly (decades). The Upper aquifer flows more slowly and its water is older (centuries to millennia). The Lower aquifer is a major component of discharge at the springs’ outlets.
ACKNOWLEDGMENTS
Prof. Dr. M.A. Geyh is thanked for making available the first unpublished radiocarbon analysis from the Gimzu1 well. Partial funding for the analyses presented here were supplied by the Israel Water Commission and from a Tel-Aviv University research grant.