1 Introduction
“Survey research can use cross-sectional or more sophisticated longitudinal or comparative designs. Too much survey research on social movements takes the first, simpler approach. Although intellectually more demanding and more costly, survey designs that draw comparisons across movements, space, or time provide immense empirical leverage that can help advance theories of social movements. […] Yet, to our knowledge nobody has ever tried such a design” (Klandermans & Smith Reference Klandermans, Smith, Klandermans and Staggenborg2002, 4; 8).
The behavior of activists of social movements or political parties plays an important role in many well-established theories of political science. Even macrolevel theories of democratization have to make implicit assumption on the behavior of political activists in order to solve the public’s collective action problem (Alemán and Yang Reference Alemán and Yang2011, 1139). Political parties “structure the popular vote, integrate and mobilize the mass of the citizenry; aggregate diverse interests; recruit leaders for public office; and formulate public policy” (Mair Reference Mair and Mair1990, 1). In essence, “modern democracy is unthinkable save in terms of parties,” as famously stated by Schattschneider (Reference Schattschneider1942, 1).
Yet the study of internal party politics often rests on ad hoc assumptions about the motivations of relevant actors. Theorizing has generally remained underdeveloped (Kitschelt Reference Kitschelt, Nash and Scott2012, 159–160). The reason for this omission is the difficulty to confront intraparty theories with empirical evidence as representative large-N surveys among party members are hardly available. Party members are hard to reach or access to them is denied by the respective party administration. Random population polls often include only a small fraction of actual party members. Consequently, scholars have used other sampling strategies, which all have their disadvantages: Snowball sampling is a cheap method, but tends to produce biased estimates. Even sophisticated weighting techniques, such as the respondent driven sampling method (RDS), cannot overcome the problem of nonrepresentativeness of snowball sampling (Goel and Salganik Reference Goel and Salganik2010). Event sampling relies on randomization techniques at political events to sample activists at their meetings or protests. But event sampling is rather expensive and requires that rows are countable, that researchers can move freely through the rows, and that all parts of the demonstration are peaceful (Walgrave and Verhulst Reference Walgrave and Verhulst2011). The high organizational efforts combined with a high degree of sampling uncertainty disqualify event sampling as an appropriate method to survey different parties over time and space. Another procedure is to ask a small set of experts to rate a particular variable of interest for political parties. However, experts are prone to information processing biases (Tetlock Reference Tetlock2005), and often lack full information on internal affairs and processes.Footnote 1
This paper proposes a novel procedure to sample different parties or social movements over time and space by utilizing the advertising option of the social media webpage Facebook, which can quasirandomly target members of political groups. This method allows for quotas, and the relatively low sampling cost makes the collection of unprecedented large-N samples of political activists possible. The large sample size ensures that the representativeness can be improved through poststratification (Wang et al. Reference Wang, Rothschild, Goel and Gelman2015), which weighs key demographics of the sample by the proportion of the target population. Moreover, the article recommends using subsample robustness tests to analyze mean group differences. In subsample robustness tests, a researcher evaluates whether the estimated differences persist for subgroups of key demographics that are probably under-represented.
Facebook sampling tends to oversample the better educated, younger, and more active members of a group (Bhutta Reference Bhutta2012; Samuels and Zucco Reference Samuels and Zucco2013; Rife et al. Reference Rife, Cate, Kosinski and Stillwell2016). But since better educated and more active members tend to have a stronger influence within a party or movement (Van Laer Reference Van Laer2010; Walgrave et al. Reference Walgrave, Bennett, Van Laer and Breunig2011; Conroy, Feezell, and Guerrero Reference Conroy, Feezell and Guerrero2012; Vissers and Stolle Reference Vissers and Stolle2014), Facebook sampling is an appropriate method to study intraparty politics. It also appears to be the only reliable method to generate time-series cross-sectional data for activists of political parties and social movements.
The potential of Facebook sampling is illustrated by three examples. First, a Facebook sample of supporters of the German party Alternative for Germany (AfD) is compared to intraparty outcomes. The sample approximated the results of similar items in an online party referendum. Frauke Petry’s 3-to-2 victory over Bernd Lucke in the crucial 2015 party leadership contest was correctly estimated based on a Facebook panel of AfD supporters. By contrast, media pundits and a representative public opinion poll were undecided or even predicted a Lucke victory.
Second, a Facebook sample of supporters of the Social Democratic Party of Germany (SPD) is compared to a large-scale local leader survey of the SPD, which is based on a similar questionnaire with identical survey items. When applying weights to the Facebook sample to account for the different demographics of Facebook supporters and local leaders of the SPD, the 95-percent confidence intervals of both samples were overlapping for all policy-related indices.
The third example compares the political attitudes of red and yellow shirts in Thailand. This color-coded conflict has dominated Thai politics since a decade, leading to academic controversies on the underlying programmatic differences between red- and yellow-shirt supporters (Giles Reference Giles2007; Thompson Reference Thompson2007; Pasuk and Baker Reference Phongpaichit and Baker2008; Pye and Schaffar Reference Pye and Schaffar2008; Naruemon and McCargo Reference Naruemon and McCargo2011; Hicken Reference Hicken2013). Scholars rely on qualitative evidence or convenience samples because random large-scale party surveys have not been available yet. Two consecutive large-scale Facebook surveys with sample sizes of 3,750 and 4,836 could overcome this problem because the sample size is large enough to allow for subsample robustness tests for under-represented demographic groups. The analysis shows that the groups had opposing regime concepts, while red shirts and yellow shirts did not appear to differ on economic policy-making.
The examples illustrate that Facebook sampling achieves a high degree of accuracy for a new party with a substantial membership turnover and ideological heterogeneity, and for a well-established party with membership and ideological continuity. Facebook sampling can also provide inference for differences between groups for which the population parameters are unknown by generating large-scale samples of supporters which allow for sizable subsample comparisons.
2 The potential of online social media sampling for studying activists
Facebook has become popular for politicians and parties as an online platform for campaigning and mobilization (e.g., Druckman, Kifer, and Parkin Reference Druckman, Kifer and Parkin2007; Robertson, Vatrapu, and Medina Reference Robertson, Vatrapu and Medina2010; Tufekci and Wilson Reference Tufekci and Wilson2012; Larsson Reference Larsson2016). Politicians can use their Facebook fan page to spread their political messages to Facebook users, who subscribed to their fan page. Facebook users can join any fan page for free by clicking the like button.
The fan pages also provide a unique research opportunity to sample political activists through the advertising option “Facebook ads”. Facebook ads have been used in some studies to sample hard-to-reach populations (Bhutta Reference Bhutta2012; Ramo and Prochaska Reference Ramo and Prochaska2012; Kapp, Peters, and Oliver Reference Kapp, Peters and Oliver2013; Samuels and Zucco Reference Samuels and Zucco2013; Batterham Reference Batterham2014; Gilligan, Kypri, and Bourke Reference Gilligan, Kypri and Bourke2014; Nelson et al. Reference Nelson, Hughes, Oakes, Pankow and Kulasingam2014; Rife et al. Reference Rife, Cate, Kosinski and Stillwell2016), or to conduct experiments in order to evaluate the impact of political advertising (Ryan Reference Ryan2012; Broockman and Green Reference Broockman and Green2014; Ryan and Brader Reference Ryan and Braderforthcoming). Facebook ads runs small advertising boxes on the right side, in the news-feed, or on the front page of the Facebook user interface for a selected target population. The researcher determines the target population by choosing a list of relevant fan pages for the political party of interest. He also has additional options to define characteristics of the target population, such as age, education, or gender. An advertising box consists of a picture of choice and a small text about the survey together with a link to an online questionnaire. Facebook ads sends invitation boxes to logged-in users of the target population.Footnote 2
The exact allocation algorithm is not revealed by Facebook. According to Facebook, the algorithm is optimized to allocate advertisement to those users who are believed to have an interest in it. This suggests that Facebook users who are fans of a targeted political party, are more likely to receive an invitation if they also like related pages of the political party, for instance of related politicians. By increasing the funding for the advertising campaign, the pool of invitees becomes larger and the selection criteria become broader, thereby researchers can ensure quasirandomness. Facebook ads does not reveal the identity of members of the target population to the researcher. Thus, it is possible to conduct an anonymous sample with Facebook ads.
A crucial issue of the Facebook sampling method is the response rate. Previous studies highlight that the click-through rate to the online questionnaire is low, ranging between 0.02 and 0.7 percent (Ramo and Prochaska Reference Ramo and Prochaska2012; Kapp et al. Reference Kapp, Peters and Oliver2013). The click-through rate is the number of clicks to the questionnaire divided by the number of Facebook users reached. A low click-through rate could indicate that some groups within a political movement are over-represented—possibly the better educated, the younger, or the more active, who tended to be more willing to click on the advertising and complete the survey in previous Facebook studies (Bhutta Reference Bhutta2012; Samuels and Zucco Reference Samuels and Zucco2013; Rife et al. Reference Rife, Cate, Kosinski and Stillwell2016).Footnote 3
This raises the question whether a Facebook sample can be representative for the overall movement. Rife et al. (Reference Rife, Cate, Kosinski and Stillwell2016) find that there are significant deviations in demographics in a Facebook sample from other surveys, but that the differences are small in magnitude. Bhutta (Reference Bhutta2012)’s Facebook sample of American Catholics differs significantly in some demographics from Catholics of the general population, but closely reflects the beliefs and attitudes that were revealed by traditional polls. Yet, Facebook sampling has features that could reduce potential biases before, during, and after the sampling process. Facebook ads provides summary statistics about the aggregate demographics for the target population and specified subgroups. Thus, potential biases are tractable in advance and can be accounted for by imposing demographic-related quotas. The quotas can also be changed in the sampling process in order to control for different click-through rates.Footnote 4
While other party studies often have to rely on small-N samples, the low sampling costs of using Facebook ads allow for the collection of large sample sizes. The advertising costs at Facebook are a market product, and the actual price depends on the amount of other advertisers and their bids. The advertising costs tend to correlate with a country’s income, but Facebook sampling is still a cost efficient method in high-income countries compared to other sampling approaches.Footnote 5
A large sample size makes poststratification weights in a regression analysis more reliable. Samuels and Zucco (Reference Samuels and Zucco2013, Reference Samuels and Zucco2014) apply poststratification to their Brazilian Facebook sample to improve the estimates on vote choice and partisanship. Wang et al. (Reference Wang, Rothschild, Goel and Gelman2015) show that a weighted unrepresentative sample of Xbox gaming platform users achieves similar accuracy as traditional polls in predicting the 2012 U.S. Presidential election outcome. Wang et al. (Reference Wang, Rothschild, Goel and Gelman2015, 990) recommend nonrepresentative polling for smaller, local elections, or specialized surveys for which standard random polls are unavailable. Besides using different weighting techniques, a large sample size allows for another strategy to reduce the risk of wrong inference caused by an unrepresentative sample: A researcher could divide the sample into different subgroups according to key demographics (e.g., age, education, gender), and evaluate whether the empirical findings differ for subgroups that are probably under-represented by the Facebook sampling process.
However, if offline activists differ significantly from online activists within a political group, assigning poststratification weights or dividing the sample into different subgroups might not reduce sampling bias (Malhotra and Krosnick Reference Malhotra and Krosnick2007, 288). Some studies have examined how online activists differ from offline activists within a political movement. They find that online activists are younger, better educated, and that they are also “core activists” or “super-activists”: Core activists tend to be more enthusiastic, demonstrate more often, and hold more leadership positions (Van Laer Reference Van Laer2010; Walgrave et al. Reference Walgrave, Bennett, Van Laer and Breunig2011; Conroy et al. Reference Conroy, Feezell and Guerrero2012; Vissers and Stolle Reference Vissers and Stolle2014).
The possibility of over-representing core activists by the Facebook sampling method—either through the Ad allocation or higher participation rates—does not necessarily pose a problem. Facebook sampling could provide a better understanding of those activists, who are agenda setters in their parties. In fact, an over-representation of core activists could even lead to better predictions of intraparty decisions. For instance, a representative sample of party members could fail to predict outcomes of party membership referenda or party congress meetings if core activists have a relatively stronger turnout at such events. As only a small fraction of party members regularly participates in intraparty politics, it is likely that the outcomes are dominated by more active party members.
3 Three examples of Facebook sampling
This section illustrates the potential of Facebook sampling by comparing two cases with benchmarks and by evaluating one case without a benchmark: First, Facebook sampling is used to estimate intraparty decisions of the newly established AfD. Second, the estimates of a Facebook sample of SPD supporters are compared to an SPD local leader survey with identical items. Third, Facebook sampling is used to make inferences on the ideological differences between red and yellow shirts in Thailand, for which the population parameters are unknown.Footnote 6
3.1 Comparing Facebook sampling with two intraparty decisions of a new party
3.1.1 Background: The AfD
The AfD was established in February 2013 in opposition to the euro rescue measures supported by German chancellor, Angela Merkel, which she called alternativlos (without alternative). The AfD narrowly missed the five-percent threshold for parliamentary representation in the 2013 national election. Prominent AfD party members were free-market economists, and the AfD candidates were significantly more market-liberal than the candidates of the Christian Democrats (CDU/CSU) (Jankowski, Schneider, and Tepe Reference Jankowski, Schneider and Tepeforthcoming). Arzheimer (Reference Arzheimer2015)’s analysis of the 2014 European election manifestos placed the AfD to the right of the CDU/CSU, but the AfD did not qualify to be considered as a populist radical right party.
After achieving parliamentary representation in the European Parliament and three East German states in 2014, the AfD descended into a monthly internal quarrel in 2015, culminating in a showdown for party leadership and the split of the party. Economist Bernd Lucke, who was the party’s most prominent public face and one of its three national leaders, pursued a reform of the party charter that would have consolidated his power by bestowing him with the exclusive party leadership. Lucke’s goal was to solidify the AfD as a moderate center-right party that would be a potential coalition partner for the CDU/CSU and the Free Democrats (FDP).
The national-conservative wing of the party opposed these plans, as they wanted to establish the AfD as a fundamental opposition party. They and other opponents of the party charter reform rallied behind Frauke Petry, the second leader of the party. Petry, who initially was an ally of Lucke but broke with him over personal conflicts, successfully challenged Lucke for leadership at the national party convention in July 2015. Petry’s victory led to a programmatic reorientation of the party. Lucke and his supporters left the AfD to found the Alliance for Progress and Renewal (Alfa) which was renamed in November 2016 to Liberal Conservative Reformers (LKR).
3.1.2 The comparison
In the German survey that was conducted between 10 and 22 September 2013, Facebook ads targeted the fans of the AfD’s official fan page and its frontrunner, Bernd Lucke. The sampling procedure was based on six advertising campaigns to ensure equal sampling quotas for the six age groups over 17 to 24, 25 to 29, 30 to 39, 40 to 49, 50 to 59, and 60 years and older. The same quotas were chosen for all German parties in order to increase the sampling of older cohorts and to have similar rules for intergroup comparisons.Footnote 7 The ads reached 59,590 AfD fans and 2,028 clicked on the Ad to start a questionnaire in German at the survey online platform Qualtrics, yielding a relatively high click-through rate of 3.4 percent. The sample consists of 1,254 AfD supporters, who voted for the AfD (effective response rate of 61.8 percent). Of these, 254 were also party members of the AfD. The costs for the AfD advertising were 60.70 Euro, or 0.048 Euro for every AfD supporter.
The Facebook sample approximated the gender balance of the official party statistics as of 31 December 2013 (Niedermayer Reference Niedermayer2014), which was unknown at the time of the sampling. About 12 percent of sampled AfD members were female, which is within the 95-percent confidence interval of the official female ratio of 15.4 percent. The average age of members of the Facebook sample was 44.6 years, significantly younger than the 50.9 years of the official membership data. This is the outcome of the difficulty to target seniors of above 65 years. The quota option stops at the age of 65 or older, and there are probably not many Facebook users in this age group. According to the official statistics, 21 percent of party members were older than 64 years, while this figure was 4.4 percent for the Facebook member sample. The oldest participant on Facebook was 74 years old. The Facebook sample of party members was more politically active than the typical party member: 72.1 percent of them regularly attended party meetings, and 46.8 percent regularly participated in election campaigns. Thus, older pensioners have been undersampled whereas more active party members have been oversampled by the Facebook method.
The survey responses of this Facebook sample are compared to two intraparty decisions as benchmarks.Footnote 8 First, the AfD membership was directly involved via an online referendum in the decision-making process on the party’s manifesto for the European Parliamentary election of 25 May 2014—a novelty in German politics. Between 19 and 28 February 2014, AfD members were invited to an online questionnaire to vote on 116 questions. Each question listed two or three statements on a particular topic. Participants could pick their favorite statement and rate the importance of the topic. 29.4 percent or 5,154 of the 17,522 party members participated in the online referendum (AfD 2014).
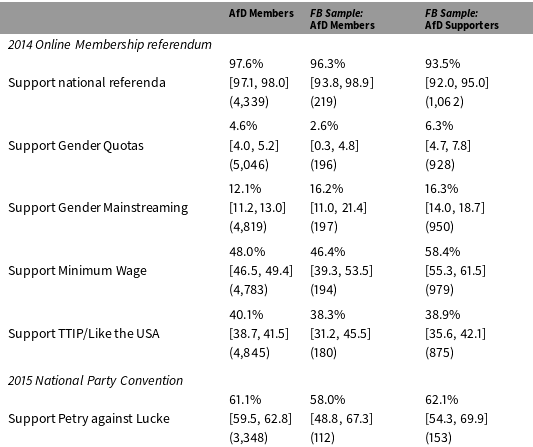
Comparing the AfD Facebook sample with the AfD online membership referendum 2014 and the leadership election at the 2015 AfD party convention.

Note: 95-percent confidence intervals in brackets, number of observations in parentheses. AfD Supporters are those who liked the AfD fan page(s) and stated that they vote for the AfD. AfD Members stated that they are party members of the AfD. AfD Supporters for the 2015 AfD supporters for the leadership election includes Alfa supporters, who left the AfD after the party convention. If leadership choice is missing (
 $N=8$
for members and
 $N=11$
for supporters), the choice is imputed based on sympathy ranking for Petry and Lucke. Answer options are transformed to fall into the categories “support” and “oppose”; “Neither nor,” “Neutral,” “Undecided,” or “Don’t know” answers for both surveys are removed. The Online Appendix B shows the exact wording and transformation of the referendum items and the Facebook questionnaire.
Table 1 shows the comparison between the membership referendum and the Facebook sample on similar items.Footnote 9 In the online referendum, 97.6 percent supported the introduction of national referenda. The result was 96.3 percent for AfD members in the Facebook sample, which is statistically indistinguishable from the online referendum at the 95-percent confidence level. Regarding the support for introducing gender quotas and for gender mainstreaming, a small minority of 4.6 and 12.1 percent in the online referendum, and 2.6 and 16.2 percent in the Facebook member sample agreed with these policies. The 95-percent confidence intervals for both estimates are overlapping.
In the online party referendum, a minimum wage was supported by 48 percent. The support was insignificantly lower in the Facebook sample for AfD members with 46.4 percent, but its 95-percent confidence interval includes values above 50 percent. By contrast if the Facebook sample also includes nonmember supporters of the AfD, a majority of 58.4 percent supported a minimum wage. The finding that nonmember AfD supporters were significantly more in favor of a minimum wage appears to reflect broad trends. Exit polls after the 2013 national election show that 86 percent of AfD voters supported a minimum wage, and the AfD did relatively well among former left-wing voters and workers (Tagesschau 2013).
The fifth question pertained to the free trade agreement between the EU and the USA (TTIP). Both options highlighted that the AfD supports free trade and believes that the European common market is a success.Footnote 10 Option 1 rejected TTIP due to concerns over social, legal and environmental standards while option 2 supported TTIP. Option 2 received 40.1 percent in the referendum. There was no direct question on TTIP for the Facebook survey, but one item asked the participants how much they like the United States. While this item might be only a coarse proxy, the results coincide closely with the referendum results on TTIP: 38.3 percent had a positive impression of the United States, which is statistically indistinguishable from the referendum result on TTIP.
The second intraparty decision of the AfD that was estimated by the Facebook sampling method was the leadership contest between Petry and Lucke at the national convention in Essen on 4 July 2015, which Petry won with about 60 percent. The national convention was open to all party members. Of the 20,359 party members, 3,502 (17.2 percent) attended the national convention, making it the largest party meeting in the history of the Federal Republic of Germany (AfD 2015). The crucial party leadership contest between Petry and Lucke provides an opportunity to evaluate whether the original Facebook sample of AfD members and supporters can generate accurate estimates for a panel over time. Pundits and media reports did not anticipate a Petry victory, even speaking of a Startvorteil (head start) for Lucke before the convention (Leber Reference Leber2015; Steffen and Jacobsen Reference Steffen and Jacobsen2015). A representative poll conducted among 1,024 AfD voters between 10 and 23 June 2015 shows that 56 percent supported Lucke, while only 23 percent supported Petry (Stern 2015).
Of the 1,254 AfD supporters, 658 of them, who participated in previous surveys, stated that they would participate in future surveys. Of the 658 initial respondents, 209 (31.8 percent) participated in the third survey of 2015 on the vote choice in the national convention.Footnote 11 Of these, 116 participants were also party members. Table 1 compares the results of the 2015 survey with the actual results of the leadership contest.
Among Facebook party members, the support for Petry stood at 58 percent. This appears to be quite accurate, but the sample size is rather small. As a consequence, the 95-percent confidence interval includes values below 50 percent for Petry. When including AfD supporters, who stated that they still vote for the AfD, the support for Petry was 62.1 percent. This sample allows for estimating Petry’s victory based on a 95-percent confidence interval. Thus, Facebook sampling helps us to anticipate the outcome of the leadership contest—which was a crucial decision for the AfD’s programmatic reorientation—while experts or representative public opinion polls were undecided or predicted a Lucke victory.
3.2 Comparing Facebook sampling with a representative local leader survey
3.2.1 Background: The SPD and the 2013 local leader survey
The center-left SPD is Germany’s oldest political party with parliamentary representation. The Social Democrats went as the main opposition party into the 2013 German national election campaign, where they received 25.7 percent—slightly above the historic low of 23.0 percent in 2009. The SPD entered into coalition negotiation as a junior partner with the victorious CDU/CSU of Chancellor Merkel; no other governing coalition was viable after the traditional coalition partner of the CDU/CSU, the FDP, failed to achieve parliamentary representation. The coalition agreement with the CDU/CSU was confirmed in an SPD membership referendum, as about three quarter of the SPD membership supported the so-called grand coalition.
Jäger and Weitzel (Reference Jäger and Weitzel2017) utilized the SPD membership referendum to conduct a two-wave large-N survey among local SPD party leaders. The survey invitations were sent out before the referendum via e-mail to all SPD representatives who held at least a party office in the SPD or Jungsozialisten, the party’s youth organization, at one of the three smallest organizational levels of the party (Ortsverein, Kreisverband, or Unterbezirk), or were elected members of a local parliament (Gemeinderäte or Stadträte). A total of 1,882 SPD representatives participated in the survey.
The 2013 local leader survey qualifies as a benchmark for the SPD Facebook sample. Although the target populations of both samples were different, both were large-N surveys which have a strong overlap in terms of questionnaire structure and wording. Thus, it is possible to adjust the SPD Facebook sample with weights to meet the key demographics of the local leader survey, and subsequently analyze whether the same survey items on political attitudes coincide with each other.
3.2.2 The comparison
The SPD Facebook sample was obtained before the German national election between 10 and 22 September 2013, using Facebook ads to target the fans of the SPD’s official fan page and its frontrunner, Peer Steinbrück. The ads reached 150,810 and 970 clicked on the Ad to start the questionnaire, yielding a click-through rate of 0.64 percent. The sample consists of 368 participants who also chose the SPD as their vote choice in the online questionnaire, yielding an effective response rate of about 38 percent. The costs were 145.38 Euro or 0.395 Euro per participant.
The Facebook sample differs substantially in key demographics from the local leader sample. Local leaders were significantly older, ran more often for public offices, and were better educated than the Facebook sample. I employ the raking method to estimate poststratification weights for the Facebook sample that are based on the differences for the six age groups, the frequency of seeking public office, and university degree.Footnote 12
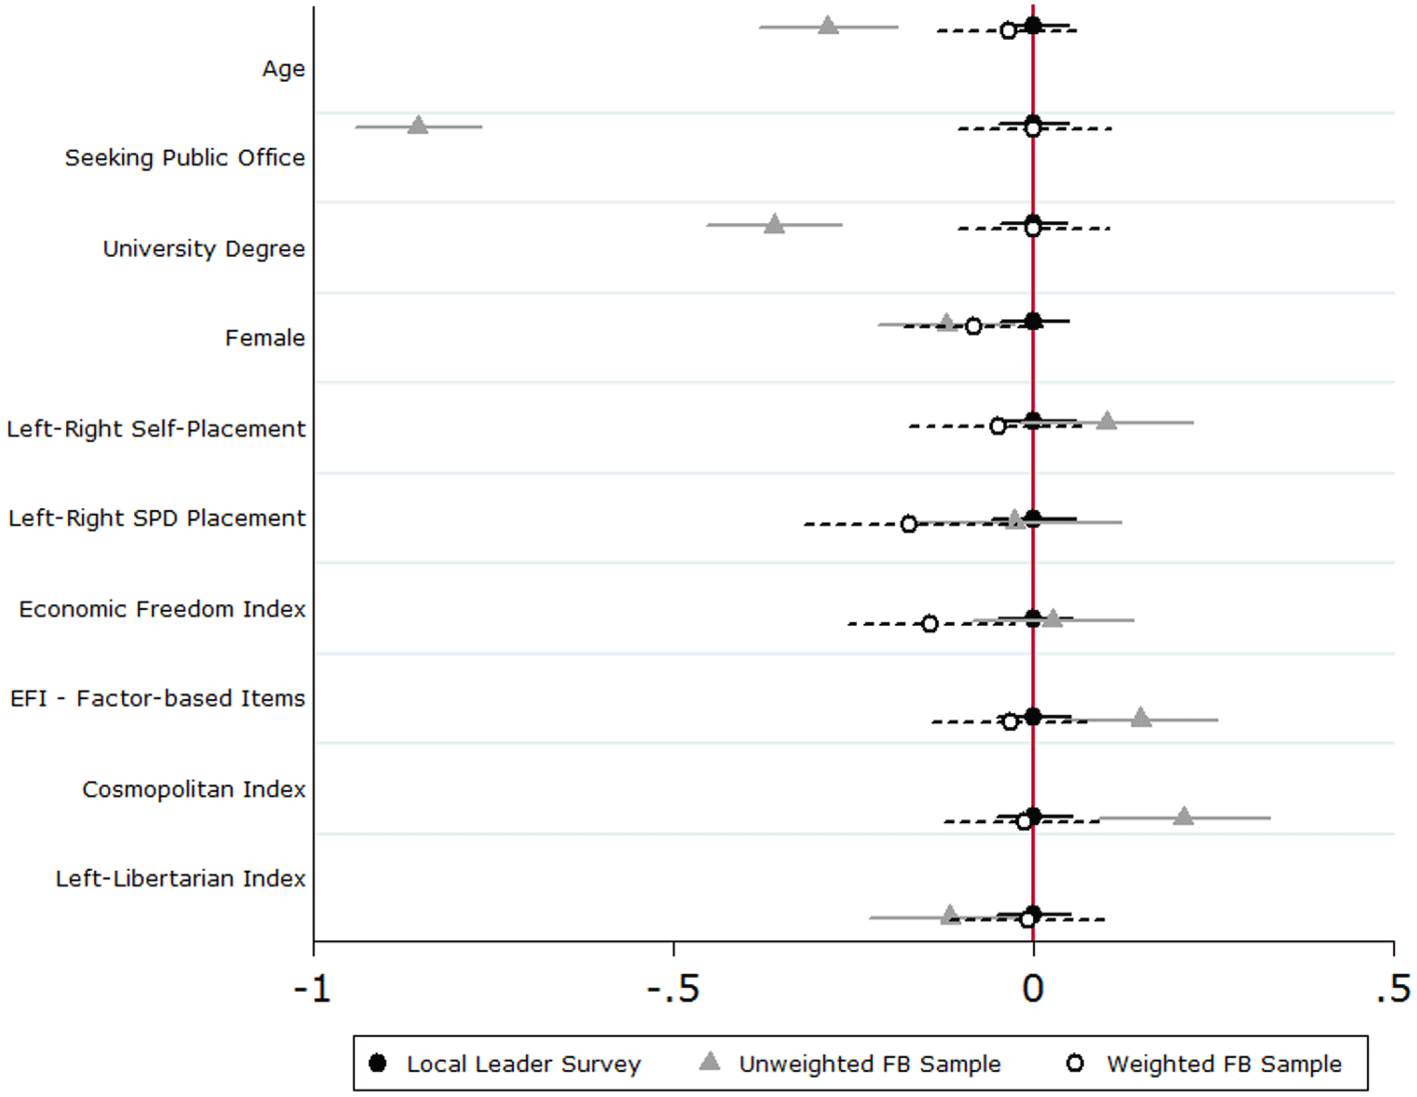
Comparing the SPD Facebook sample with the SPD local leader survey. Error bars give the 95-percent confidence interval. Values are standardized with the local leader survey as baseline. The Online Appendix B shows the exact wording of the survey items.

Figure 1 compares the attitudinal estimates of the local leader survey with the unweighted and weighted estimates of the Facebook sample for indices of key policy-making areas. The 95-percent confidence intervals for the local leader and weighted Facebook samples were overlapping for all constructed indices, suggesting that the estimates did not appear to be significantly different. The confidence intervals for the unweighted Facebook sample also overlapped with five of the six indices of the local leader sample. Only the Cosmopolitan Index was significantly higher.Footnote 13
3.3 Using Facebook sampling for comparing groups with unknown population parameters
3.3.1 Background: The color-coded conflict in Thailand
Thai politics has been dominated in the last decade by a color-coded conflict between the supporters of former Prime Minister and business tycoon Thaksin Shinawatra, wearing red, and his opponents, wearing yellow. The color-coded conflict aroused mass protests and violent clashes, and two military coups that ousted Thaksin in 2006 and his sister, Yingluck Shinawatra, in 2014.
The literature debates whether the color-coded conflict originated from the programmatic politicization of social cleavages. Thaksin drew his support from the rural poor in the North and Northeast, whereas the anti-Thaksin movements was popular in the South and among the Bangkok-based middle class. Several authors (e.g., Giles Reference Giles2007; Pasuk and Baker Reference Phongpaichit and Baker2008; Hicken Reference Hicken2013) argue that this color-coded divide represents a distributive cleavage. Rural red-shirt supporters would favor active state policies and redistribution, whereas urban yellow-shirt supporters would prefer free-market policies and opposed Thaksin because they were afraid that they had to pay for his welfare spending. By contrast, other scholars (Anek Reference Anek and Taylor1996; Thompson Reference Thompson2007) emphasize the sociocultural divide over the regime type. The urban middle class was allegedly appalled by Thaksin’s authoritarianism, because they cared about good governance and legal democratic procedures, whereas rural dwellers had a populist conception of democracy, focusing on their narrow economic interest.
The Thai case falls into a broader debate on the rise of illiberal democracies in which politicians win elections by appealing to the rural poor through populist measures, but ignore constitutional checks and balances (Zakaria Reference Zakaria1997; Diamond Reference Diamond2002). As a consequence, the middle class increasingly turns against elected governments in young democracies; sometimes they even support military coups, convinced that they are actually protecting liberal democracy (Kurlantzick Reference Kurlantzick2013, 96).
Based on a public opinion poll, Jäger (Reference Jäger2012) shows that voters dissatisfied with Thaksin had a relatively higher commitment to liberal-proceduralist values. However, previous research on the red- and yellow-shirt movements have to rely on convenience sampling during their protests. Pye and Schaffar (Reference Pye and Schaffar2008) conducted discussions and interviews with yellow-shirt activists during the anti-Thaksin protests in February and March 2006. Naruemon and McCargo (Reference Naruemon and McCargo2011) surveyed 5 red-shirt protestors from 80 tents at the Pan Fah site in central Bangkok between March 15 and April 5, 2010, yielding a sample size of 400. The large-scale Thai National Survey (Asia Foundation 2011) shows that only a small portion of the Thai electorate has participated in a “red” (17 or 0.9 percent) or “yellow” (19 or 1.0 percent) demonstration. These numbers are too small to be used for reliable inference about these movements.
3.3.2 The comparison
Facebook sampling was conducted before the national election between 27 June and 3 July 2011,Footnote 14 and between 25 February and 3 March 2012, when the pro-Thaksin Pheu Thai Party (PTP)—with Thaksin’s sister Yingluck as Prime Minister—was back in power. The units of analysis are the pro-Thaksin PTP and the anti-Thaksin movement consisting of the Democrat Party and the People’s Alliance for Democracy (PAD). The target populations for both periods were the Facebook fan pages of the parties and of affiliated politicians.
The first Facebook sampling generated a total of 9,819,782 impressions and attracted 15,362 clicks (coarse click-through rate of 0.16 percent),Footnote 15 of which 3,750 participated in the survey, which is a participation rate of 24.4 percent. The effective sample size for participants who feel attached to PTP were 1,467, to the Democrats 1,453, and to PAD 471. The costs were 174.32 Euro or 0.046 Euro per participant. The second Facebook sampling iteration in 2012 had 6,989,311 impressions with a total of 10,964 clicks (coarse click-through rate of 0.16 percent). The survey attracted 4,836 participants (participation rate of 44.1 percent) of whom 1,509 felt attached to the Democrats, 1,417 to PTP, and 509 to PAD. The costs were 258.22 Euro or 0.053 Euro per participant.
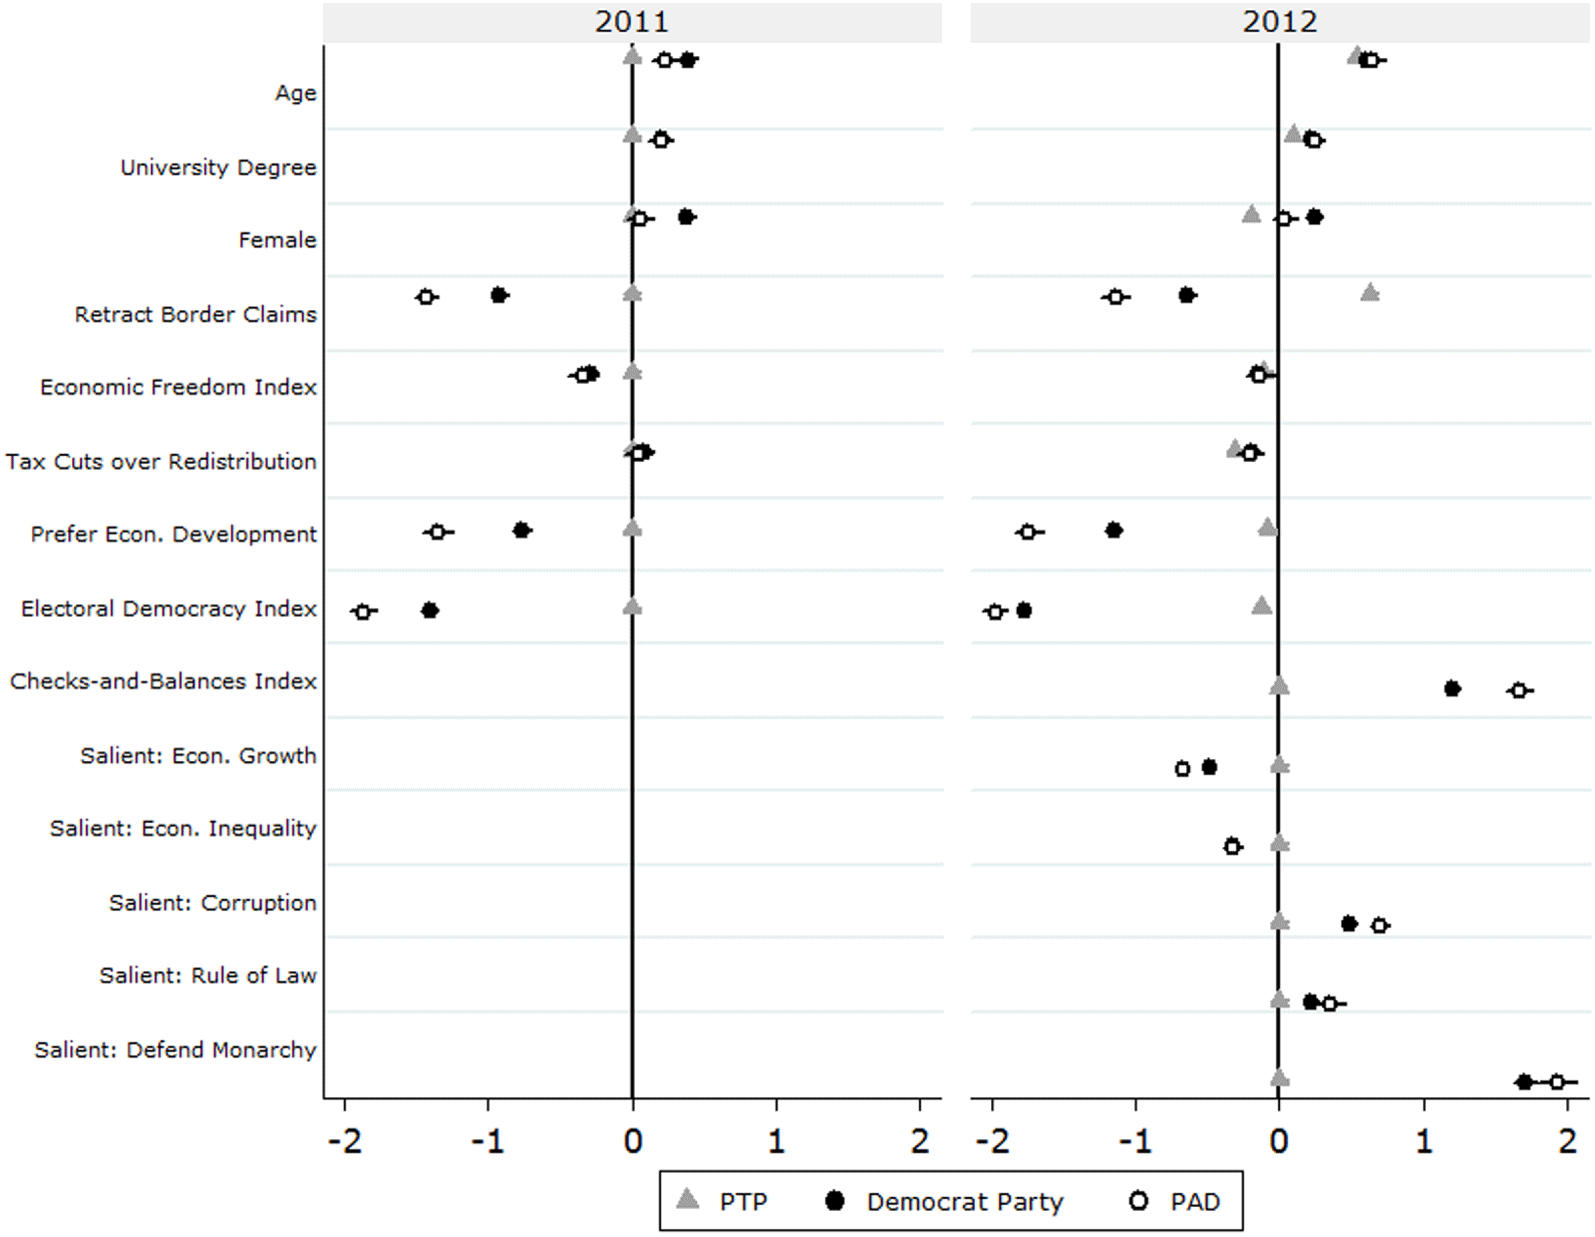
Comparison of Facebook samples for PTP, Democrats, and PAD. Error bars give the 95-percent confidence interval. Values are standardized with the 2011 PTP estimates as baseline. 2012 PTP estimates are the baseline if the items were not part of the 2011 survey. The Online Appendix B shows the exact wording of the items of both Facebook questionnaires.

Figure 2 compares the estimates of demographics and political attitudes of both surveys for the pro-Thaksin PTP and the anti-Thaksin Democrat Party and PAD. The second iteration produced a significant older sample for all three groups as a result of using more age quotas. The significantly higher participation rate of women among the anti-Thaksin groups could reflect the unequal gender distribution between the movements, as the yellow shirts appeared to attract a larger proportion of women (McCargo Reference McCargo2009, 16).
The analysis of the survey items reveals that the three groups did not differ in terms of economic policies. Moreover, the red shirts did not appear to be significantly more in favor of redistributing money to the poor relative to tax cuts. Yet, the groups significantly differed in their attention to these issues. PTP supporters put significantly more emphasis on economic development and economic inequality than the Democrats and PAD. The color-coded conflict appeared to be a conflict about different regime concepts: PTP supporters were relatively more supportive of democratic-participatory elements. Democrats and PAD highlighted the fight against corruption and were more supportive of checks and balances. Defending the monarchy was also considered important for over two thirds of the yellow shirts, whereas only one in ten red shirts perceived this as a salient issues.Footnote 16 A subsample robustness test shows that the significant differences persisted for the seven subsamples of males, females, no university degree, university degree, and the age groups younger than 30 years, 30–49 years, and older than 49 years for all items except for the salience of the rule of law.
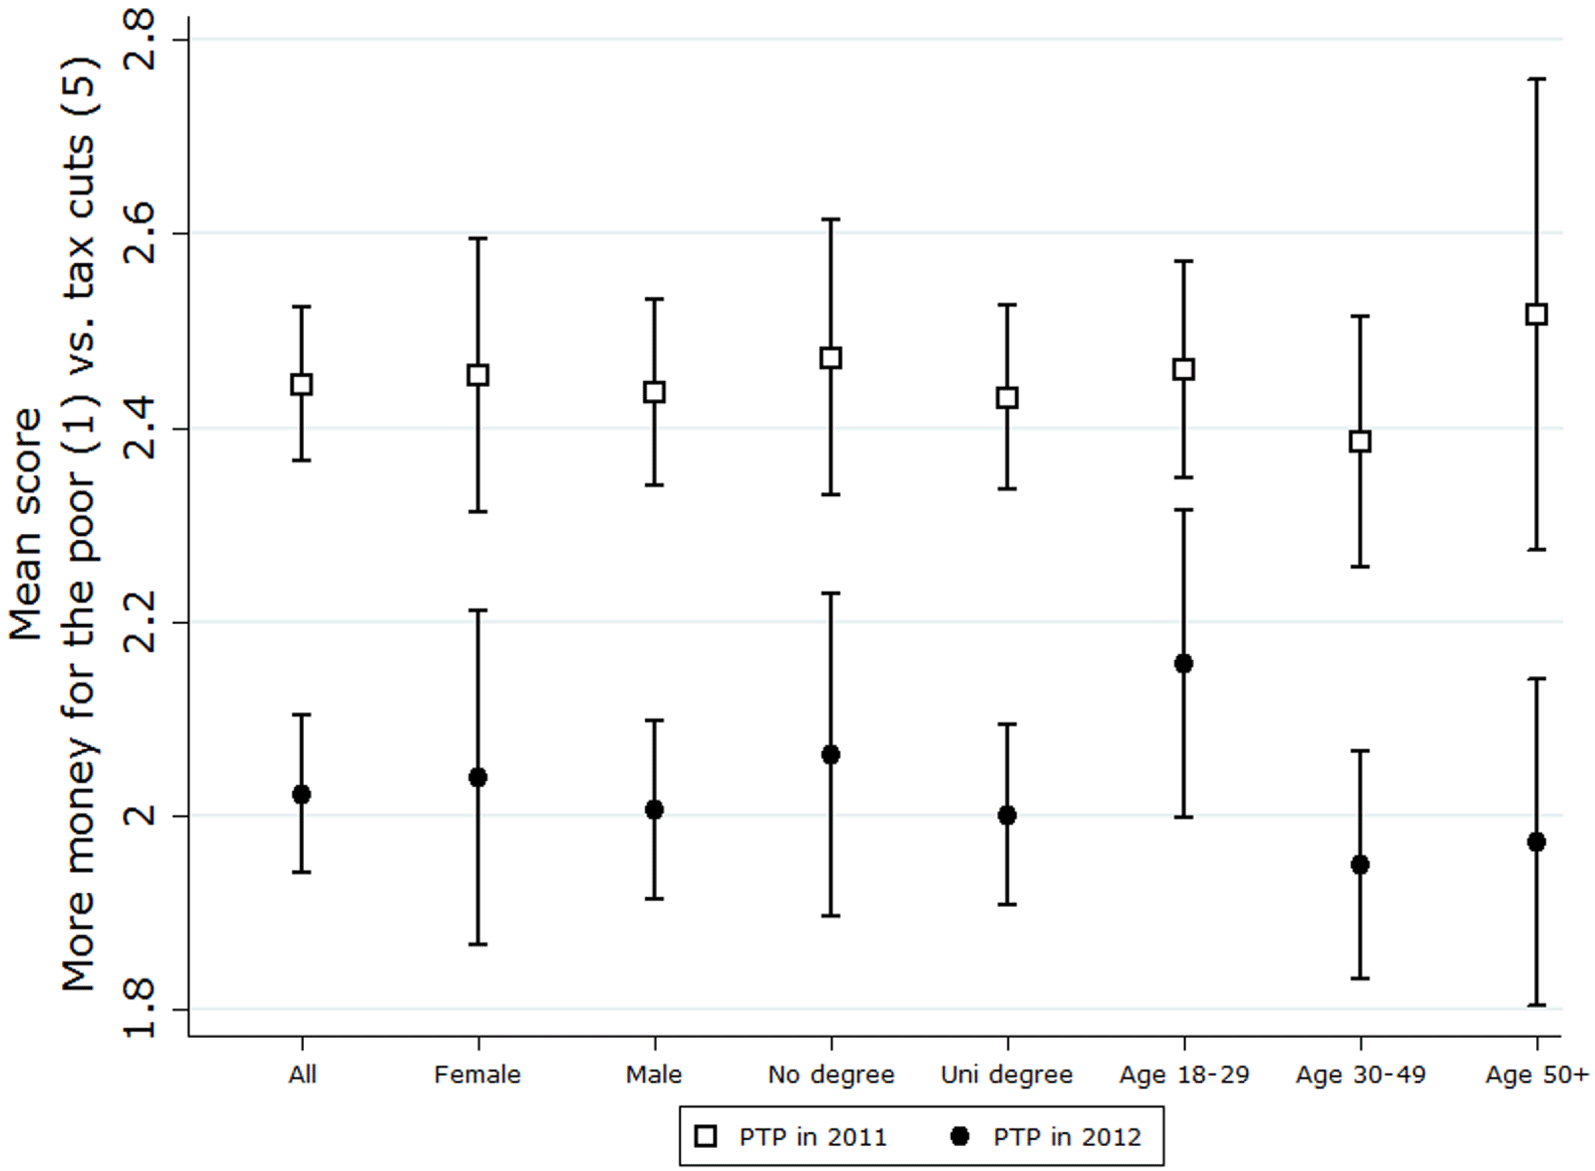
Change in support for redistribution for different subsamples of PTP supporters. Error bars give the 95-percent confidence interval.

The subsample comparison could also be used to study attitudinal changes within a political party over time. Figure 3 shows that the attitude of PTP supporters significantly changed in favor of redistributing income to the poor relative to tax cuts. The mean score for all PTP supporters changed from 2.44 to 2.02. As the two confidence intervals are not overlapping, this difference appears to be significant at the 95-percent confidence level. Figure 3 reveals that the significant change in favor of redistribution also occurred for the seven subsamples. Thus, the results of this robustness test suggests that PTP supporters have indeed moved toward the left for this survey item.
4 Conclusion
The article argues that the advertising option of the social media platform Facebook is cheaper and more reliable than alternative methods to sample political activists. Facebook sampling has the option to impose presampling quotas. The low sampling costs render the collection of large datasets possible, also allowing for postsample weights to improve the representativeness of the sample.
Three examples illustrate the potential of Facebook sampling: First, the analysis of the intraparty decisions of the AfD shows that the estimates of the Facebook sample approximated the results of a party online referendum and a leadership contest at an open party convention. This suggests that the tendency of Facebook sampling to undersample pensioners older than 70–75 years and to oversample core activists do not appear to negatively affect the estimates of actual intraparty outcomes. In general, only a small proportion of party members becomes active in intraparty politics. As intraparty politics is strongly determined by the more active rank-and-file, the Facebook sampling method seems to be able to provide accurate estimates for intraparty decisions, which might not have been predicted by relying on representative surveys of all party members.
Second, the comparison between a Facebook sample of SPD supporters with a representative survey of local SPD leaders shows that the sampling method could also be applied to study well-established mainstream parties with a more stable membership base. The 95-percent confidence intervals of the estimates of the weighted Facebook and local leader samples overlapped for all conceptually constructed indices. The comparison shows that it is possible to improve the representativeness of large Facebook samples through poststratification, even if the samples differ strongly in terms of demographics and political rank.
Third, the Thai case shows that the low cost of Facebook sampling allows for collecting large samples of political activists over time, including under-represented demographics, such as older or less educated respondents. A subgroup comparison over time could be used to reduce the risk that findings are the result of sampling bias—even for groups with unknown population parameters. The analysis of the Facebook samples of red and yellow shirts in Thailand shows that the color-coded conflict is about different regime concepts. The red shirts highlighted the participatory elements of democracies while the yellow shirts put emphasis on anticorruption, checks and balances, and the monarchy. Red and yellow shirts did not appear to differ in their preferred economic policy-making, but economic development and inequality were more salient issues for reds.
The choice of the target population and the quotas will influence the composition of the sample, thus researchers and reviewers of research based on Facebook sampling should pay attention to the sampling design. While the particular research question ultimately determines the appropriate quotas, the examples suggest some general recommendations: The researcher should target older cohorts to ensure that all age groups are represented and that the average age approaches the typical age of political movements. Before or during the sampling process, the quotas could extend to other groups that are likely to be under-represented, such as less educated respondents, or to groups that represent relevant cleavages (e.g., different regions). For intergroup comparisons, the quotas should be similar across all groups. Significant findings of intergroup comparisons should be evaluated for subgroups that are possibly under-represented by Facebook sampling. If a detected difference persists across all major subsamples and over time, it appears more likely that the finding is not caused by sampling bias.
Facebook sampling appears to be the only reliable and cheap method to generate time-series cross-sectional data for hard-to-reach political activists. Sampling them across three dimensions (parties, countries, time) via the Facebook advertising option could provide new empirical evidence for several well-established theories in the discipline, which often have to rely on ad hoc assumptions about the behavior of political activists so far.
Supplementary material
For supplementary material accompanying this paper, please visit https://doi.org/10.1017/pan.2017.13.