Urinary iodine concentration (UIC) is widely utilised to evaluate the iodine nutritional status of populations. However, UIC primarily reflects recent iodine intake, and significant day-to-day variability in iodine intake is mirrored in the variability of UIC(Reference Rohner, Zimmermann and Jooste1). UIC measured in spot urine samples mainly indicates recent iodine intake and is not a reliable indicator of an individual’s iodine status(Reference Pearce and Caldwell2). Therefore, a dietary assessment of iodine intake is also widely employed to monitor an individual’s iodine status over time and to aid in the interpretation of UIC in individuals.
Currently, estimates of dietary iodine intake are typically based on the average iodine concentration of each food consumed, including iodine in salt. Globally, the predominant method for assessing dietary intake in food consumption surveys is the 24-h dietary recall (24-HDR)(Reference De Keyzer, Bracke and McNaughton3). This method involves accurately recalling, describing and quantifying all foods and beverages eaten or drunk in the 24 h before the interview(Reference Salvador Castell, Serra-Majem and Ribas-Barba4). Nevertheless, the use of the 24-HDR among Chinese populations compromises the accurate quantification of condiment intake. Shared condiments (e.g. cooking oil and table salt) are widely utilised in Chinese household cooking, where they are added in bulk during meal preparation – making it difficult for individuals to accurately recall their personal intake. Consequently, the measurement of cooking oil was often omitted from traditional 24-HDR protocols, and condiment intake assessments are therefore complemented by a weighing method(Reference Zhai, Guo and Popkin5).
However, this approach to assessing condiment intake has a relatively overlooked limitation. In contexts where food preparation is primarily conducted at the household level, iodised table salt remains the main dietary source of iodine for residents. Nevertheless, alongside shifts in dietary patterns – most notably the rising intake of processed foods – relying solely on household iodised salt coverage fails to fully capture the actual iodine intake of individuals(Reference Zimmermann and Andersson6). Moreover, the trend of dining out is becoming increasingly popular. According to a survey conducted in the USA about 10 years ago, over 50·0 % of adults reported eating out three or more times a week(Reference Kant, Whitley and Graubard7). In Brazil, national surveys indicate an increasing percentage of calories spent on foods eaten out of home, rising from 24·0 % to 31·0 % of the total diet between 2002–2003 and 2008–2009(Reference Claro, Baraldi and Martins8). In our previous research, we found that the prevalence of eating outside of home and at restaurants in Shanghai was 55·1 % and 31·8 %, respectively(Reference Zang, Luo and Wang9). In the USA, the majority of household salt is iodised, whereas only a minimal proportion of the salt utilised in restaurants and food processing is iodised(Reference Mannar and Hurrell10). In contrast, under China’s Universal Salt Iodization policy, it is mandatory for salt utilised in condiments, packaged foods and restaurants to be iodised in iodine-deficient regions(Reference Sun, Codling and Chang11). Therefore, there may be significant differences in iodised salt coverage rate (ISCR) between household salt and salt used in restaurants across different countries and regions. Assessing iodine intake based on the FFQ, dietary records or 24-HDR is challenging without information on the ISCR in dining establishments, especially when the participants have a high frequency of eating out.
Discrepancy in the ISCR between household and salt used in dining establishments could potentially influence the outcomes of dietary iodine assessments. Regrettably, research in this specific domain remains limited. The study aimed to compare the ISCR between household salt and salt used in dining establishments in Shanghai and to evaluate the impact of the discrepancy on dietary iodine assessment.
Materials and methods
Study design
Data were collected from the Shanghai Diet and Health Survey conducted between October and December 2023. The sampling method is detailed in published literature(Reference Zang, Yu and Zhu12). After sampling, a total of 2920 subjects aged 18 years or older were recruited from all sixteen administrative districts of Shanghai. These districts cover both highly urbanised central areas and rural regions. The latter include Chongming Island, Jinshan District and Fengxian District, where agriculture, fishery and crop cultivation are the primary economic sectors. The study was approved by the Ethics Committee of Shanghai Center for Disease Control and Prevention (Protocol Code KY-2024-16) and was performed in accordance with the Declaration of Helsinki. Before data collection, written informed consent was obtained from all participants.
The definition of eating outside
Participants were asked how many days in the past 3 d they had breakfast, lunch or dinner and how many of those meals were eaten at a restaurant or work/school canteen. In this study, eating out refers to consuming food prepared or eaten away from home. We defined individuals who ate at least one meal prepared outside the home during the survey period as having a habit of eating out. Individuals who did not meet these criteria were categorised as eating at home only.
The definition of iodised salt
Edible salt accessible to residents was classified into three categories in accordance with the ‘National Food Safety Standard—Iodized Salt Content’(13) in Shanghai: non-iodised salt (iodine content < 5 mg/kg), non-compliant iodised salt (iodine content either < 21 mg/kg or > 39 mg/kg) and qualified iodised salt (iodine content ranging from 21 to 39 mg/kg). The ISCR was defined as the ratio of household salt samples with an iodine content of ≥ 5 mg/kg to the total number of tested salt samples.
Salt in dining establishments collection and detection
Salt used in dining establishments were collected from the sixteen districts of Shanghai, and each district was subdivided into five geographical divisions: east, west, south, north and central. From each geographical division, a 50-g salt sample used in two canteens, five medium-sized restaurants and five small restaurants were collected from the top, middle and bottom sections of a salt package. The extraction process entailed using a moisture-free, airtight plastic bag. The iodine content in the salt samples was determined according to the arsenic–cerium catalytic spectrophotometric method, as prescribed by the Chinese National Standard GB/T 13025.7-2012.
Dietary iodine intake estimation and scenario analyses
In the present study, distinct and validated dietary survey methods were employed to quantify food intake and condiment intake separately.
Dietary intake was collected via 24-HDR over three consecutive days. Accordingly, participants were assigned to complete the survey in one of two predefined 3-consecutive-day windows: either Thursday to Saturday or Sunday to Tuesday. Both windows included at least one weekend day to capture weekday–weekend dietary variability. Investigators with standardised technical training administered the survey to all residents of the selected households, with support from instruments like food photos and examples of dishes.
Condiment intake was determined via weighed inventory. Trained investigators used calibrated digital scales of the same brand and model to measure all condiments consumed, including edible oil, table salt, monosodium glutamate and soya sauce. The weighing procedure covered the 72-h period of the dietary survey, recording the initial and residual weights of household condiment stocks – enabling quantification of 3-d condiment intake consistent with the food intake assessment timeframe. All purchased and wasted condiments were individually weighed, and daily condiment consumption was calculated based on the changes in stock weight. Additionally, the total number of individuals (including family members and temporary guests) consuming household condiments at each meal was recorded to account for shared consumption. Personal condiment intake was derived by multiplying the total household condiment consumption by the proportion of an individual’s energy intake relative to the total household energy intake, ensuring accurate allocation of shared condiments among individuals.
The daily iodine intake/energy for each participant was calculated based on the Chinese Food Composition Table(Reference Yang14). The table provides the iodine content/energy per 100 g of edible portion for a wide range of common food items. The calculation of daily iodine intake was performed using the following formula:
 $\eqalign{ {\ Daily\; iodine\; intake\; (\mu g)}\,&=\sum {\frac{{{{Daily\;intake\;of\;food\;ingredient}{{\left( {\rm{g}} \right)}_i}}}}{{{{100}}}}}}\\ \quad\quad\quad\quad\quad\quad\quad\quad\quad\quad\quad\quad\;\;\; {\times\; {\rm{Iodine\;content\;of\;food\;ingredient}}\left( {{\rm{\mu g}}/100{\rm{\;g}}} \right){{\rm{}}_i}};$
Additionally, we accounted for a 20 % cooking loss of iodine from condiments(Reference Goindi, Karmarkar and Kapil15). To reduce the random measurement error of short-term dietary recalls, the usual dietary iodine intake of participants was further calibrated and estimated by integrating the short-term daily iodine intake data with long-term dietary consumption frequency information from FFQ. This calibration analysis was conducted using the multiple-source method via the dedicated web-based statistical package(Reference Harttig, Haubrock and Knüppel16). Sex, age and physical activity level, which were collected alongside the FFQ in the same questionnaire survey, were included as covariates in the multiple-source method regression model.
Scenario analyses were used to evaluate the impact of the discrepancy. In Scenario 1, individual salt consumption was calculated based on the total amount of salt consumed in the household, divided by the proportion of each individual’s energy consumption relative to the total household energy consumption. Dietary iodine intake from salt was then calculated by multiplying individual salt consumption by the iodine content of household salt. During this calculation process, the iodine intake from salt when dining out was estimated based on their household salt type. It is assumed that the type of salt (iodised or non-iodised) consumed by individuals when dining out were the same as those consumed at home. In Scenario 2, the consumption of salt from eating out was calculated based on the ISCR in dining establishments. Dietary iodine intake from salt was calculated using the following approach: first, salt consumption from eating out was multiplied by the iodine content of salt used in dining establishments and further adjusted by the ISCR in dining establishments. Second, this value was combined with the iodine intake from household salt, which was calculated by multiplying household individual salt consumption by the iodine content of household salt.
Statistical analysis
Statistical analyses were performed in Python (v3.8) using pandas for data handling, scikit-learn for variable scaling and statsmodels for regression modelling. Data normality was tested using the Kolmogorov–Smirnov test, and the non-normally distributed continuous data (iodine content in iodised salt) are expressed as median (P25 and P75). All tests were two-sided, and statistical significance was defined as P < 0·05.
Group differences were assessed with the Mann–Whitney U test between two groups (out-of-home v. household). When comparisons involved three groups, the non-parametric Kruskal–Wallis H test was used to evaluate overall differences across groups; if the Kruskal–Wallis H test was significant, pairwise post hoc comparisons were performed using Dunn’s test with Bonferroni correction for multiple comparisons. Categorical variables (salt coverage rate; distribution of estimated iodine intake relative to the estimated average requirement, the recommended nutrient intake and the tolerable upper limit and salt type distribution: non-iodised, qualified iodised and unqualified iodised) were summarised as counts and percentages, and differences in distribution between groups were assessed with Pearson’s χ 2 test of independence; when any expected cell count was < 5, Fisher’s exact test was used instead. If an overall χ 2 test was statistically significant and pairwise comparisons were performed between categories, P-values were adjusted for multiple comparisons using the Bonferroni method.
In the logistic regression model, categorical predictors (occupation, education, alcohol use, urban/rural classification, income level, age and sex) were dummy-coded with a single reference category retained for each variable; where applicable, the reference level was set a priori. First, separate univariable (crude) logistic regression models were fitted for each predictor to estimate the association with the outcome (eating out of home), reporting OR and 95 % CI. Second, all candidate covariates were entered simultaneously into a multivariable (adjusted) logistic regression model to estimate adjusted OR and 95 % CI. Regression coefficients and their standard errors were used to derive 95 % CI; OR were obtained by exponentiation of the estimated log-odds coefficients. To assist model interpretation and numerical stability, categorical dummies were standardised (mean = 0 and sd = 1) prior to modelling when appropriate. Multicollinearity was evaluated using variance inflation factors, and variables with markedly elevated VIF were considered for re-coding or exclusion.
Results
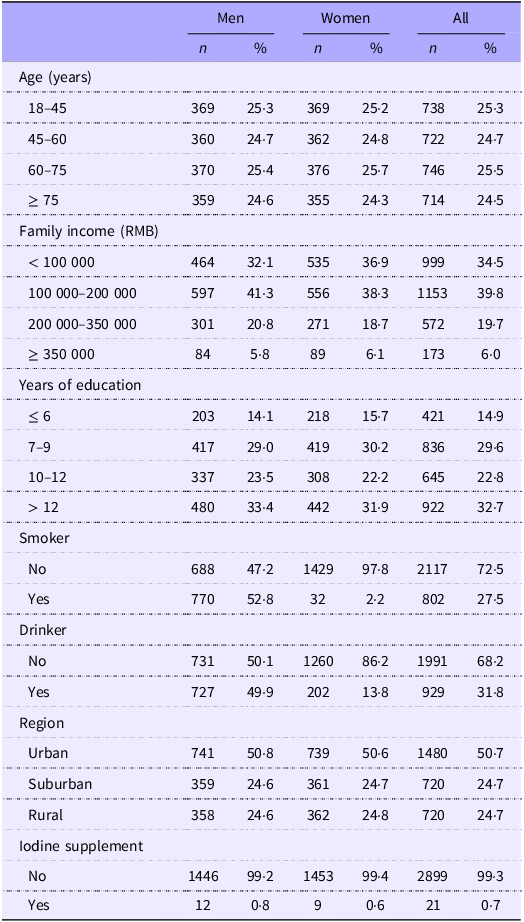
In this study, a total of 2920 individuals participated in the survey, comprising 1462 adult males and 1458 females. Table 1 presents the characteristics of adult residents in Shanghai, encompassing basic demographic information and lifestyle habits. The distribution among urban, suburban and rural residents was 50·7 %, 24·7 % and 24·7 %, respectively. The four age groups (18–45, 45–60, 60–75 and ≥ 75) accounted for 14·9 %, 29·6 %, 22·8 % and 32·65 % of the sample, respectively. The distribution of education levels among the respondents was relatively even. The proportions of smokers and drinkers were 27·5 % and 31·8 %, respectively.
Characteristics of study participants

Table 1 Long description
The table presents the characteristics of 2920 study participants, divided into men, women, and all categories. It includes data on age groups (18-45, 45-60, 60-75, and over 75), family income ranges (less than 100000 RMB, 100000-200000 RMB, 200000-350000 RMB, and over 350000 RMB), years of education (less than or equal to 6, 7-9, 10-12, and over 12), smoking and drinking habits (yes or no), region (urban, suburban, rural), and iodine supplement usage (yes or no). Each category is broken down by the number and percentage of men, women, and all participants. For example, in the age group 18-45, there are 369 men (25.3 percent), 369 women (25.2 percent), and 738 participants overall (25.3 percent). The table provides a detailed breakdown of these characteristics across all categories.
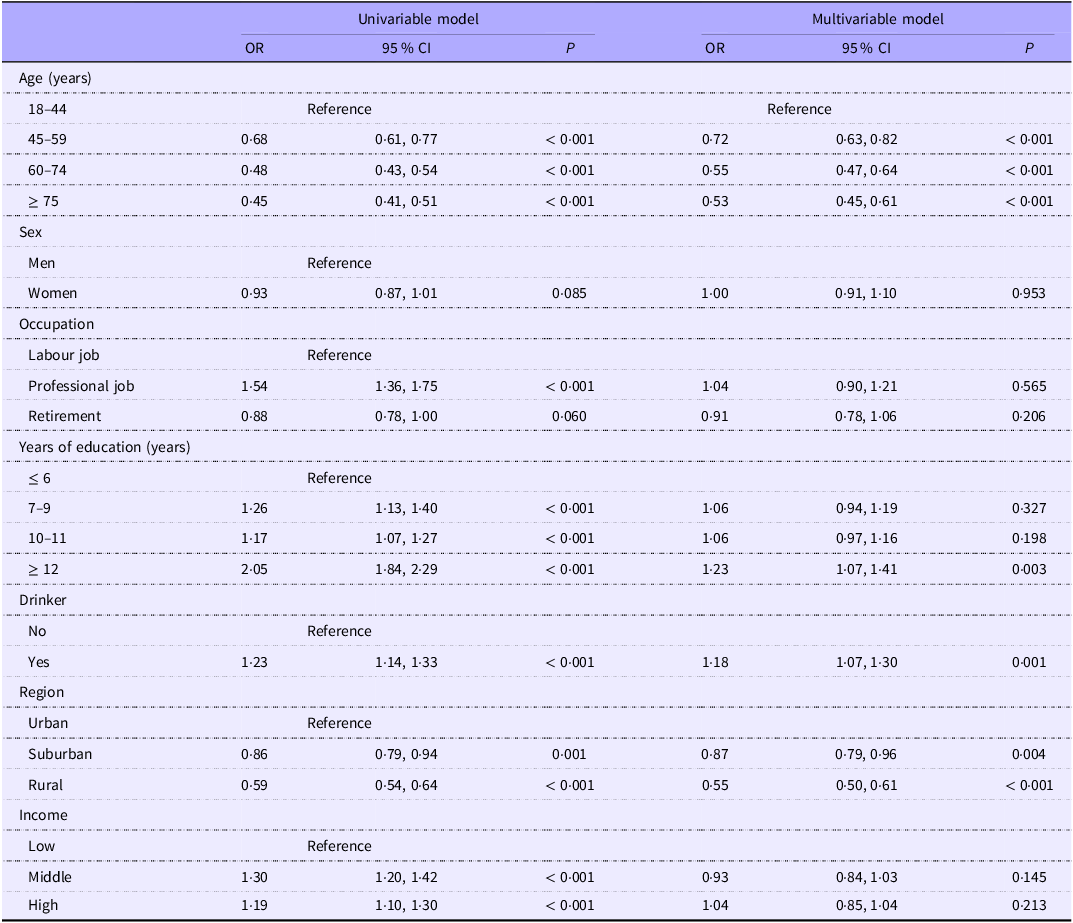
As presented in Table 2, a significant positive association was identified between out-of-home dining behaviour and higher socio-economic status in this study. Adults with elevated socio-economic status – defined by higher household income, advanced educational attainment, urban residency or professional occupation – exhibited a substantially greater likelihood of eating out, with all associations reaching statistical significance (P < 0·05). Additionally, age emerged as a notable correlate: younger adults were relatively more prone to engaging in out-of-home dining compared with their older counterparts. Regarding alcohol consumption, drinkers had higher odds of eating out than non-drinkers, and this difference was statistically significant (OR = 1·23; 95 % CI 1·14, 1·33; P < 0·001).
Logistic regression models for eating outside, classified by predictors

Table 2 Long description
A table with 12 rows and 10 columns comparing logistic regression models for eating outside based on various predictors. The table is divided into two main models: Univariable and Multivariable. Each model includes columns for Odds Ratio (OR), 95% Confidence Interval (CI), and P-value. The predictors include Age (years), Sex, Occupation, Years of education (years), Drinker, and Region. For Age, the categories are 18-44, 45-59, 60-74, and ≥ 75. For Sex, the categories are Men and Women. For Occupation, the categories are Labour job, Professional job, and Retirement. For Years of education, the categories are ≤ 6, 7-9, 10-11, and ≥ 12. For Drinker, the categories are No and Yes. For Region, the categories are Urban, Suburban, and Rural. The table provides OR, 95% CI, and P-value for each predictor in both models.
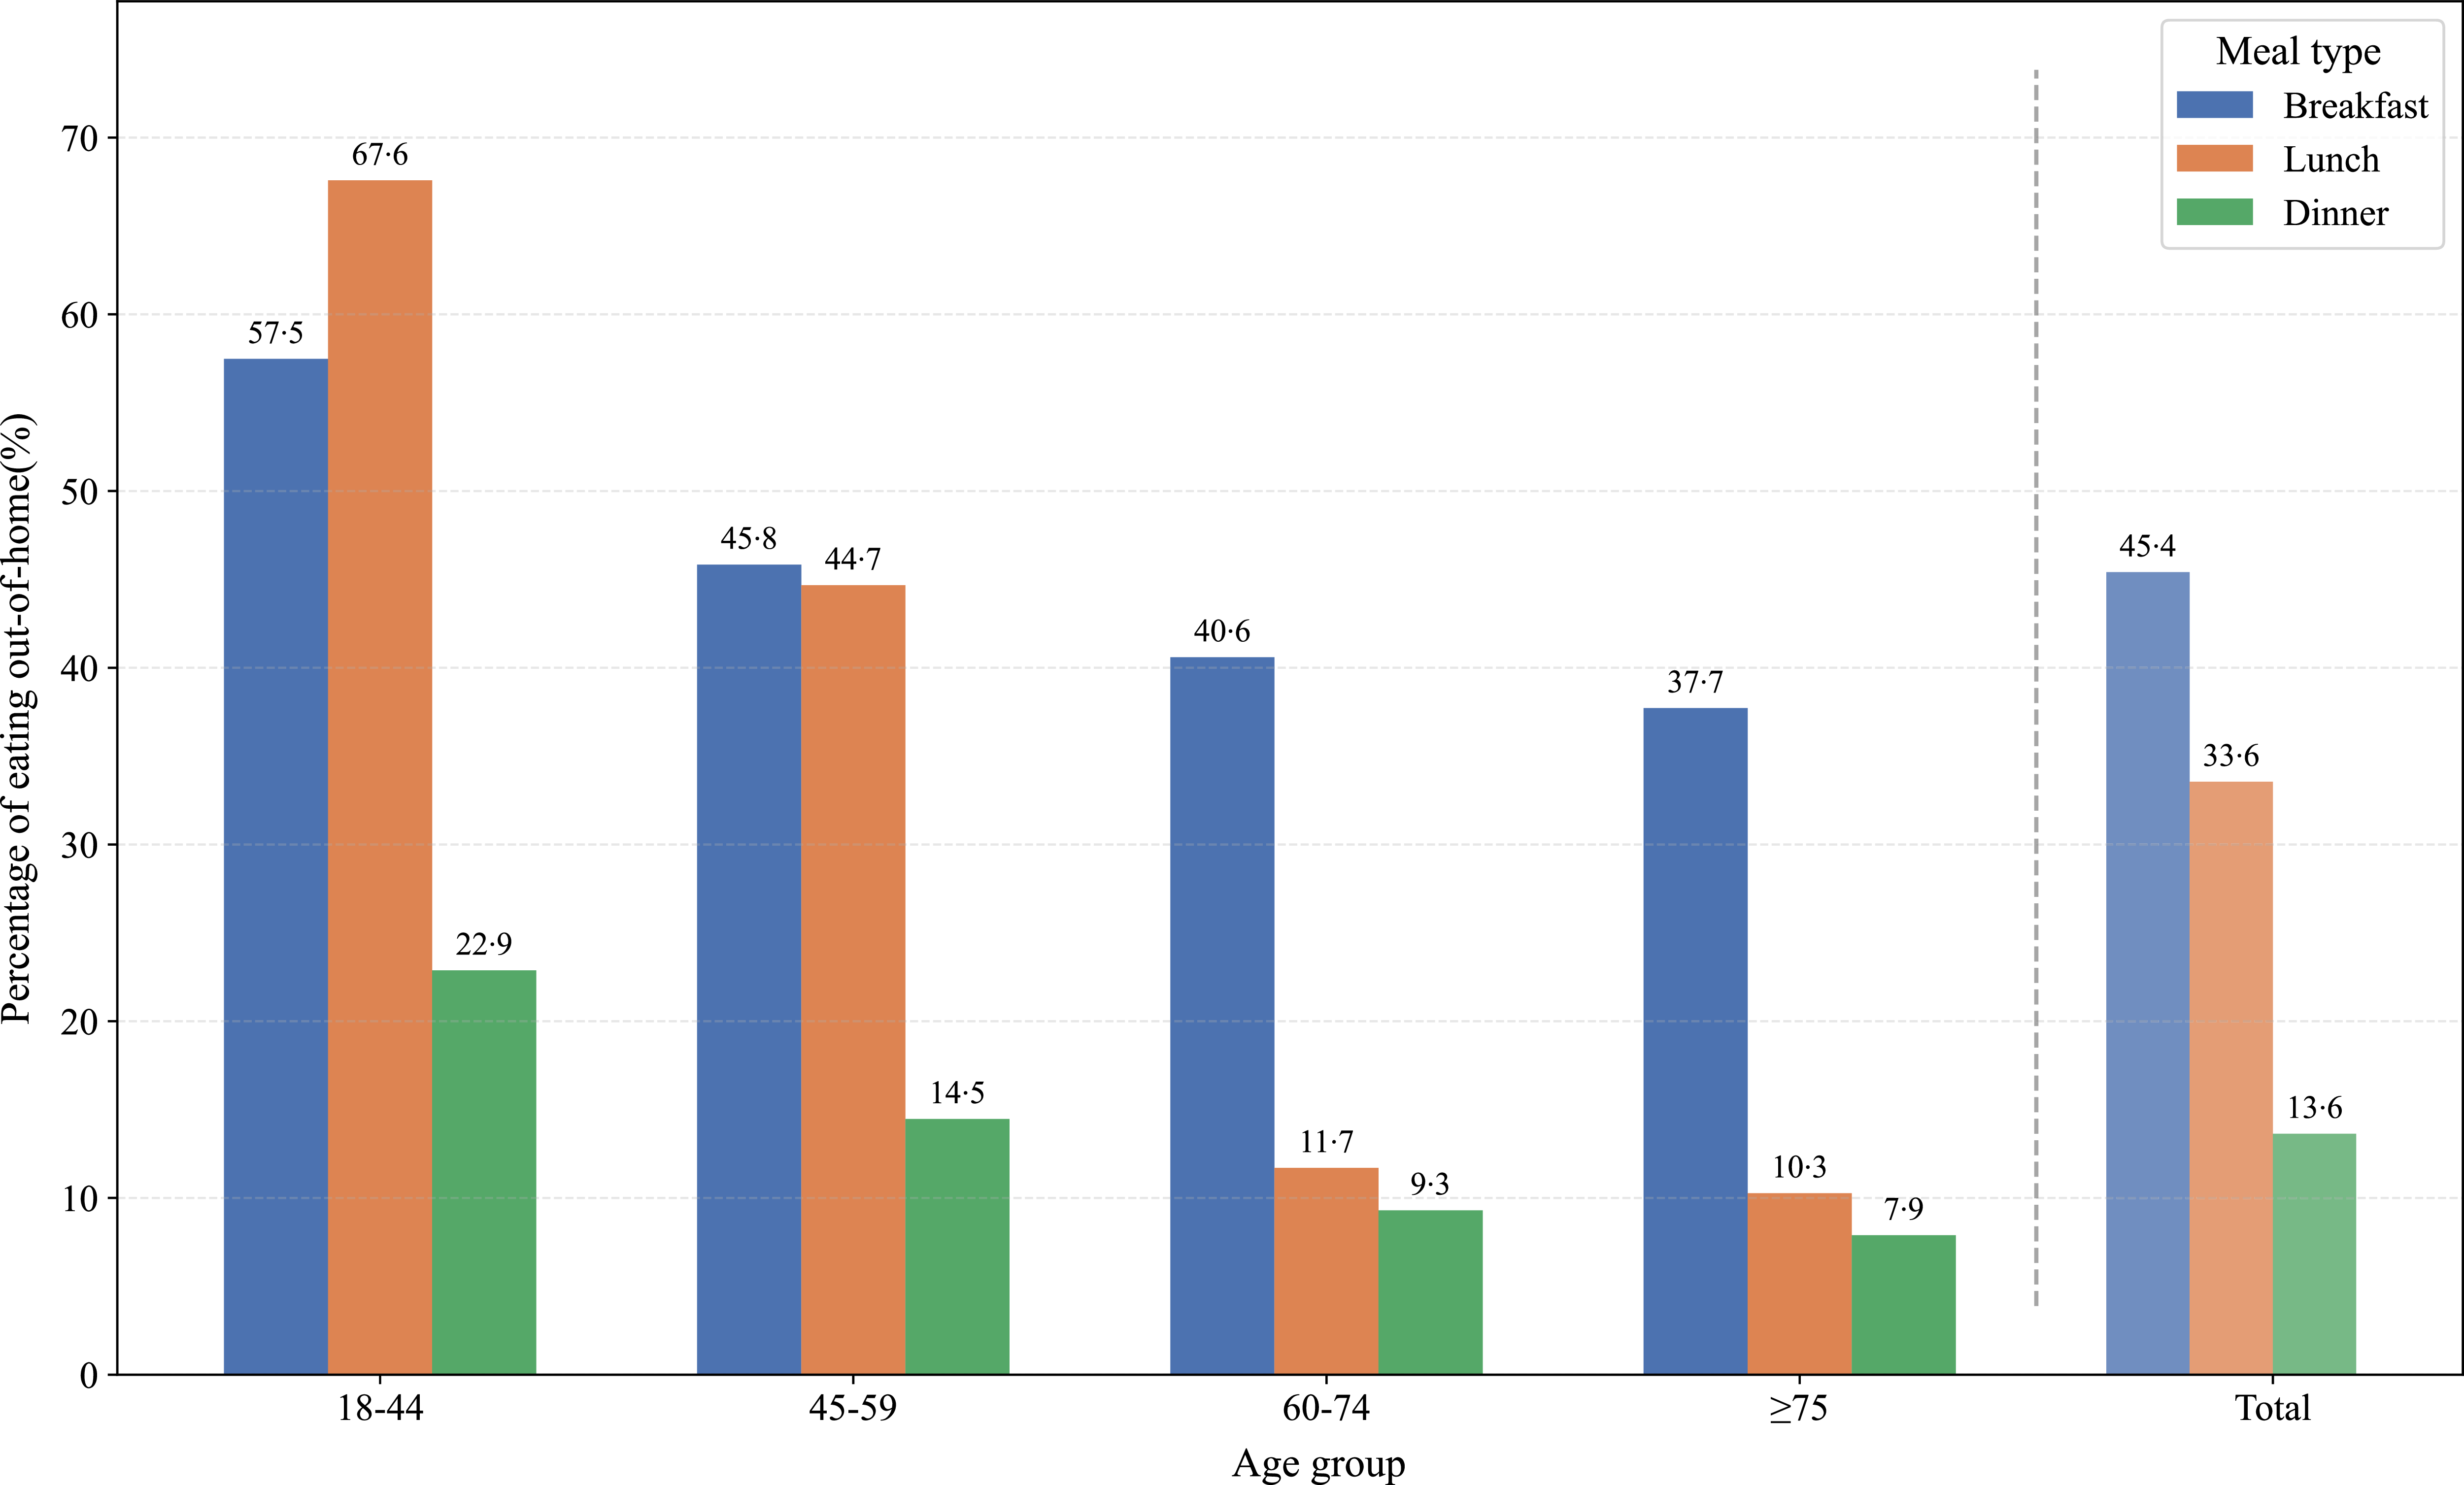
Figure 1 summarises the proportion of participants who ate out of home at least once within 3 d. Breakfast had the highest proportion of eating out, followed by lunch, while dinner had the lowest proportion (χ2 = 934·19, P < 0·001). There were differences in the proportion of eating out at breakfast (χ2 = 369·34, P < 0·001) or lunch (χ2 = 4194·70, P < 0·001) or dinner (χ2 = 472·92, P < 0·001) among different age groups. The results of pairwise comparisons indicated that there were statistically significant differences in the proportion of eating out at breakfast, lunch and dinner between each pair of age groups. Among individuals aged 18–59 years, 51·7 % reported eating breakfast outside the home, 56·1 % reported eating lunch outside the home and 18·7 % reported eating dinner outside the home at least once during a 3-d period.
Percentage of eating out-of-home among study participants within 3 d.

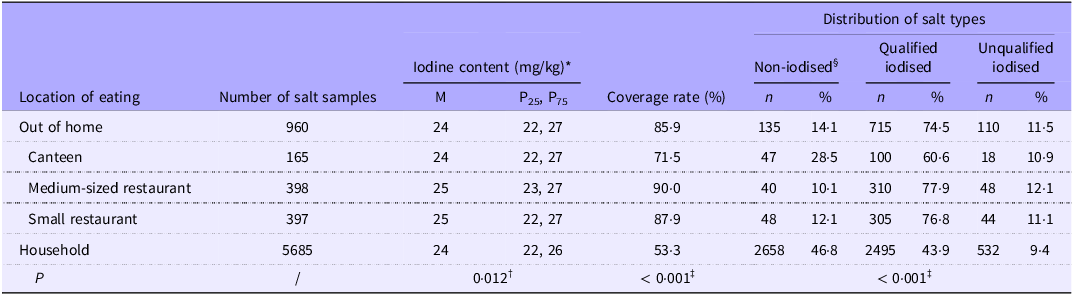
Table 3 summarises the difference between ISCR in household salt and salt used in dining establishments in Shanghai. Although the median iodine content was 24 mg/kg for both iodised salt used in dining establishments and that used in households, the interquartile range (IQR) was 22–27 mg/kg for salt used in dining establishments and 22–26 mg/kg for household salt. Statistically significant differences in distribution were identified between the two groups (Z = 2·515, P = 0·012). The distribution of the salt types in the two groups of salt also showed a statistically significant difference (χ2 = 371·71, P < 0·001). The ISCR in dining establishments was 85·9 %, while that in households was 53·3 %. The ISCR in dining establishments was significantly higher than that in household (χ2 = 358·93, P < 0·001). Among dining establishments, significant differences in ISCR were observed between canteens and medium-sized restaurants (χ2 = 28·95, P < 0·001) and between canteens and small restaurants (χ2 = 21·15, P < 0·001). In contrast, no significant difference was found between medium-sized and small restaurants (χ2 = 0·65, P = 0·422).
Discrepancy in iodised salt coverage between household salt and salt used out of home in Shanghai

Table 3 Long description
The table presents data on iodine content and salt types in various eating locations in Shanghai. It has six rows and eight columns. The columns are labeled as follows: Location of eating, Number of salt samples, Iodine content (mg/kg) with sub-columns M, P 25, P 75, Coverage rate (percent), and Distribution of salt types with sub-columns Non-iodised n, Non-iodised percent, Qualified iodised n, Qualified iodised percent, Unqualified iodised n, Unqualified iodised percent. The rows are labeled as follows: Out of home, Canteen, Medium-sized restaurant, Small restaurant, Household, P. Row 1: Out of home, 960, M 24, P 25 22, P 75 27, Coverage rate 85.9, Non-iodised n 135, Non-iodised percent 14.1, Qualified iodised n 715, Qualified iodised percent 74.5, Unqualified iodised n 110, Unqualified iodised percent 11.5. Row 2: Canteen, 165, M 24, P 25 22, P 75 27, Coverage rate 71.5, Non-iodised n 47, Non-iodised percent 28.5, Qualified iodised n 100, Qualified iodised percent 60.6, Unqualified iodised n 18, Unqualified iodised percent 10.9. Row 3: Medium-sized restaurant, 398, M 25, P 25 23, P 75 27, Coverage rate 90.0, Non-iodised n 40, Non-iodised percent 10.1, Qualified iodised n 310, Qualified iodised percent 77.9, Unqualified iodised n 48, Unqualified iodised percent 12.1. Row 4: Small restaurant, 397, M 25, P 25 22, P 75 27, Coverage rate 87.9, Non-iodised n 48, Non-iodised percent 12.1, Qualified iodised n 305, Qualified iodised percent 76.8, Unqualified iodised n 44, Unqualified iodised percent 11.1. Row 5: Household, 5685, M 24, P 25 22, P 75 26, Coverage rate 53.3, Non-iodised n 2658, Non-iodised percent 46.8, Qualified iodised n 2495, Qualified iodised percent 43.9, Unqualified iodised n 532, Unqualified iodised percent 9.4. Row 6: P, /, 0.012†, < 0.001†, < 0.001†.
* Data on iodine content reflect the iodine levels in iodised salt consumed by residents in real-world settings. Qualified iodised salt and unqualified iodised salt were combined as a group in the present analysis.
† P-value of the Mann–Whitney U test between out-of-home and household group.
‡ P-value of the χ 2 tests between out-of-home and household group.
§ According to the standard of ‘Iodine Content of Edible Salt’ (GB 26878-2011) in Shanghai, the salt samples were determined to be non-iodised salt with an iodised salt content of < 5 mg/kg, unqualified iodised salt with an iodised salt content of < 21 mg/kg or > 39 mg/kg and qualified iodised salt with 21–39 mg/kg.
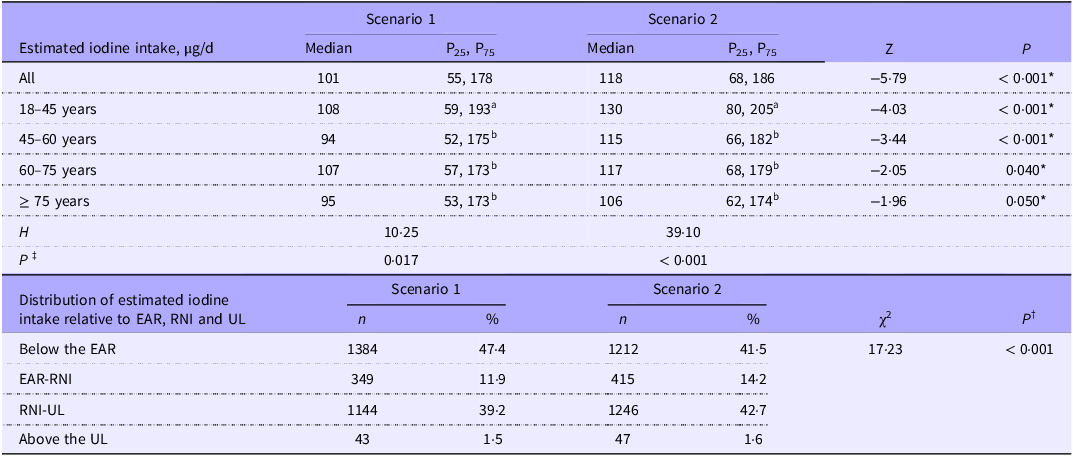
As shown in Table 4, the estimated iodine intake was 101 μg/d (IQR: 55–178) in Scenario 1, which did not account for differences in iodised salt coverage between dining-out and home meals, and 118 μg/d (IQR: 68–186) in Scenario 2, which accounted for such differences. Scenario 1 had a significantly lower iodine intake compared with Scenarios 2 (Z = −5·79, P < 0·001). In Scenario 1, the dietary iodine intake did not reach the estimated average requirement in 47·4 % of the residents and exceeded the tolerable upper limit in 1·5 %. In Scenario 2, the dietary iodine intake did not reach the estimated average requirement in 41·5 % of the residents and exceeded the tolerable upper limit in 1·6 %. The difference in distribution of dietary iodine intake between two scenario was statistically significant (χ2 = 17·23, P < 0·001). Kruskal–Wallis H test revealed a statistically significant difference in estimated iodine intake among the age groups (H = 10·25, P = 0·017; H = 39·10, P < 0·001) in both scenarios. Post hoc comparisons indicated that the 18–45 years age group had a significantly higher estimated iodine intake compared with the other age groups (45–60 years, 60–75 years and ≥ 75 years groups).
Scenario analyses for estimated iodine intake

Table 4 Long description
A table comparing estimated iodine intake across different scenarios and age groups. The table has 11 rows and 10 columns. Column headers are Scenario 1 Median, Scenario 1 P 25, P 75, Scenario 2 Median, Scenario 2 P 25, P 75, Z, P, H, and P. Row labels are All, 18-45 years, 45-60 years, 60-75 years, and 75 years. The table also includes a section for the distribution of estimated iodine intake relative to EAR, RNI, and UL, with columns for Scenario 1 n, Scenario 1 percent, Scenario 2 n, Scenario 2 percent, chi-squared, and P. The table provides detailed data on iodine intake across different scenarios and age groups, highlighting significant differences and distributions.
EAR, the estimated average requirement; RNI, recommended nutrient intake; UL, the tolerable upper limit.
The values denote the number of people and the proportions (%).
* P-value of the Mann–Whitney U test.
† P-value of the χ 2 tests.
‡ P-value of the Kruskal–Wallis H test, subgroups with different letters indicate significant differences, as determined by Dunn’s test and Holm–Bonferroni method; Scenario 1: assumed equal iodised salt coverage rates (53·3 %) in households and dining establishments; Scenario 2: the differences in iodised salt coverage rates between households and dining establishments were taken into account.
Discussion
The iodisation of household salt is monitored in standardised household surveys in many lower-income countries. However, few surveys monitor the coverage in outside dining venues. In our study, we found that the ISCR in dining establishments is significantly higher than that in households. Moreover, among the employed population in Shanghai, 51·7 % reported eating breakfast outside the home, 56·1 % reported eating lunch outside the home and 18·7 % reported eating dinner outside the home at least once during a 3-d period (Figure 1). Meanwhile, we observed substantial differences in estimated iodine intake across scenarios. In Scenario 1, we assumed that the coverage of iodised salt was identical between dining-out and home meals, yielding an estimated iodine intake of 101 μg/d. In contrast, Scenario 2 accounted for differences in the coverage of iodised salt between dining-out and home meals, resulting in an estimated iodine intake of 118 μg/d. The estimated iodine intake was significantly lower in Scenario 1 than in Scenario 2.
In some countries, household iodised salt consumption is often used as an indicator to monitor the iodine nutritional status of populations(Reference Momentti, de Souza Macedo and de Sousa Silva17–Reference Hooshmand, Yousefian and Rahimi19). However, our previous study illuminated that household salt iodine intake failed to impact the iodine status of pregnant women(Reference Wang, Jin and Zhu20). Moreover, a monitoring study in Tianjin from 2016 to 2020 revealed no correlation between the coverage of household cooking salt and population iodine status indices(Reference Cui, Wang and Hou21). The reasons for these outcomes may be rapid economic progress and the fast pace of modern life, as eating out, buying takeout and consuming packaged foods have become common in China. The study found that the ISCR in dining establishments is significantly higher than that in households. The household salt coverage was 53·3 % in Shanghai, which was lower than that in most other provinces in China(Reference Sun, Codling and Chang11). The findings underscore a critical gap in current dietary iodine assessment practices in China: the failure to account for iodised salt consumption in dining establishments significantly underestimates population-level iodine intake. China’s national nutrition and health surveys rely on three primary methods – 3-d condiments weight records, 24-HDR and FFQ(Reference Yu, Zhao and Zhang22) – all of which traditionally centre on household dietary patterns. However, our data from Shanghai demonstrate that these methods cannot fully capture the reality of modern Chinese dietary behaviour, where eating out and takeout have become routine, particularly among working adults.
Over the past decades, lifestyle and societal changes have led to an increase in the popularity of eating out of home. It is reported that the percentage of substantial out-of-home eaters among the studies’ participants ranged from 18·0 % to 49·0 % and was higher among cohorts in Central Europe(Reference Naska, Katsoulis and Orfanos23). Nearly, half of global respondents (48·0 %) from the Nielsen Global Out-of-Home Dining Survey eat at restaurants or other out-of-home dining establishments weekly or more often. Respondents in the Asia-Pacific and North America are particularly avid out-of-home diners(24). In the present study, approximately 45·0 % of the working population in Shanghai reported consuming breakfast and lunch out of home on a daily basis. Notably, the core demographic correlates of out-of-home dining behaviour remain remarkably consistent when compared with data from a decade prior in the same region(Reference Zang, Luo and Wang9). Specifically, higher socio-economic status – operationalised as higher household income, advanced educational attainment, urban residency or professional occupation – continues to serve as a robust positive predictor of frequent out-of-home dining. This enduring pattern underscores that economic capacity and occupational attributes have long been fundamental determinants of out-of-home dining preferences among Shanghai residents. Individuals with elevated higher socio-economic status typically benefit from greater accessibility to diverse catering establishments and face heightened time constraints associated with home meal preparation, rendering out-of-home dining a more practical and feasible dietary choice.
Our findings hold profound implications for the prevention and control of iodine deficiency disorders in China. Notably, the substantial global decline in iodine deficiency disorder prevalence over the past three decades stands as a remarkable milestone, largely attributed to the widespread implementation of universal salt iodisation initiatives(Reference Pearce and Zimmermann25). In China, despite universal salt iodisation, coastal regions like Shanghai face unique challenges: residents often deliberately reduce their adherence to iodised salt due to perceived seafood-rich diets(Reference Sun, Codling and Chang11), leading to lower household ISCR. Our findings show that without accounting for dining establishments, Shanghai’s adult iodine intake would be underestimated, potentially leading to unnecessary adjustments in iodisation policies. For public health practitioners, our results emphasise the need to revise dietary survey protocols to include catering sector data. This could involve integrating questions about dining-out frequency and preferred establishments into 24-HDR, conducting regular monitoring of ISCR in restaurants and canteens.
This study has several limitations that warrant consideration. First, the data are limited to Shanghai, a major coastal city with high dining-out rates; generalisability to inland or rural areas, where external dining frequency may be lower, requires further investigation. Second, as a cross-sectional study, it cannot account for seasonal variations in iodine intake. Third, the estimation of dining-out iodine intake relied on average ISCR in catering establishments rather than individual restaurant-specific data, which may introduce minor errors.
Future research should expand the geographic scope to include inland and rural regions, comparing ISCR discrepancies and iodine intake patterns across different settings. Additionally, detailed surveys of individual restaurant-specific data could refine iodine intake calculations. Finally, longitudinal studies could explore the long-term impact of dining-out behaviour on iodine nutrition, particularly among high-risk groups like pregnant women and children.
Conclusions
In conclusion, the increasing prevalence of eating out has transformed residents’ dietary habits, making traditional household-centric survey methods inadequate for iodine intake estimation. This study demonstrates that accounting for ISCR differences between household and dining establishments is essential for accurate iodine intake estimation. By updating survey protocols and incorporating catering sector monitoring, public health systems can better safeguard against iodine deficiency disorders and ensure targeted, evidence-based iodine nutrition policies.
Acknowledgements
The authors thank the enumerators for their face-to-face questionnaire surveys.
The current study was supported by the Shanghai Oriental Talents Program (Excellent Academic Leader Program, BJWS2024048), the Shanghai Central Government-guided Local Science and Technology Development Fund Project (YDZX20253100003002), the Shanghai Sailing Program (23YF1437000), the China Nutrition Young Talent Leadership Development Support Program and the Fifth Cycle Outstanding Young Talents Training Program in the Health System of Jinshan District, Shanghai (JSYQ202320).
The authors’ contributions are as follows: Investigation: W. L., Z. W., Z. S.(Zehuan Shi), Z. S.(Zhuo Sun), S. M., W. M., Q. S., L. S., R. S., J. Y., H. Y., Y. X. and K. Z.; Project administration: J. Z. and Z. W.; Formal analysis and writing – original draft: W. L.; Funding acquisition: Z. W. and J. Z. All authors read and approved the final manuscript.
The authors have no financial or personal conflicts of interest to declare.