


Executive summary
This report produced by an independent Expert Group is the second commissioned by the ILSI Europe Task Force on Process-related Compounds. The first report, which reviewed human exposure and internal dose assessments of acrylamide in foods, stressed the need for comparison of added risks or reduced benefits v. the benefit of acrylamide reduction. This second Expert Group was established to examine and report on the considerations for risk-benefit analysis of the mitigation measures on acyrylamide in commodities which contribute significantly to acrylamide exposure, and their impact on safety, quality, nutritional and organoleptic parameters; to position the relevance of the suspected side effects and to quantify their potential impact. The Expert Group was asked to focus on the impact of mitigation on exposure scenarios and the risk to human health using multidimensional risk assessment approaches.
The report has four main objectives:
1 To summarise the impact of pre-harvest, post-harvest and processing conditions on acrylamide formation in potatoes, cereals and coffee.
2 To evaluate the impact of pre-harvest, post-harvest and processing conditions on the formation of acrylamide in these commodities.
3 To consider the nutritional value and beneficial health impact of consuming these commodities.
4 To calculate the impact of mitigation using probabilistic risk-benefit modelling to demonstrate the principle of this approach.
Animal studies have shown that acrylamide is a genotoxic carcinogen. Under the premise that for genotoxic carcinogens no threshold levels of effect exists, exposure is to be minimized as far as possible. Minimization strategies therefore have been and consistently are developed, although direct evidence of carcinogenic effects in humans as a result of acrylamide intake is not available.
The margin of exposure (MOE), representing the ratio between a defined point on the relevant dose-response curve, the bench mark dose lower limit (BMDL, 300 μg/kg body weight (bw) per day) and average (1 μg/kg bw per day) or high (4 μg/kg bw per day) consumer exposure has been estimated at 300 and 75, respectively. According to the European Food Safety Authority (EFSA) and the Joint FAO/WHO Expert Committee on Food Additives (JECFA) a MOE of ≥ 10 000 would indicate low concern, underlining that the relatively low MOE for acrylamide calls for rapid and effective mitigation measures in order to lower consumer exposure.
Acrylamide production in foods is a consequence of the Maillard reaction between asparagine and reducing sugars. Therefore, factors affecting the concentration of these precursors in food, together with processing conditions during food preparation and storage will affect the final concentration of acrylamide in food. The commodities giving the highest exposure to acrylamide in the western diet are potatoes, cereals and coffee. The first two of these are staple foods providing for the majority of carbohydrate and some protein in the diet. Coffee is not an essential food, but has a high level of intake as a beverage, chosen not only for its flavour and hedonic value but also as a provider of caffeine.
Acrylamide formation in foodstuffs depends on the concentrations and availability of the precursor molecules asparagine and reducing sugar(s). The relative concentration of these molecules and factors such as the temperature, heat intensity and water activity used in processing technologies affects the final acrylamide concentration in the product. In addition, the presence or absence of other molecules in the reaction mixture can also affect the Maillard reaction and influence the final acrylamide concentration.
For the three commodities investigated, the concentrations of asparagine and reducing sugars are affected by common factors such as variety, growing conditions (including season, water supply and use of fertilisers), time of harvest, and post-harvest storage conditions. For cereals, reducing sugars abound and it is the concentration of asparagine which determines propensity for acrylamide formation. In contrast, for potatoes asparagine is relatively abundant and for this commodity it is the concentration of reducing sugars which determines acrylamide formation.
For coffee, acrylamide formation does not appear to be affected by reducing sugars content and is only weakly correlated with asparagine concentration in green beans. Acrylamide does not accumulate during coffee roasting. Rather, formation and degradation occur simultaneously. The limiting factor for acrylamide formation seems to be content of free asparagine whereas factors influencing concentration of reducing sugars appear of less importance. Only 20 % of initially formed acrylamide survives the roasting process and further decay is observed during storage, predominantly through binding of acrylamide to constituents of the ground and roasted coffee matrix. Such decay on storage has to be taken into consideration when estimating exposure, since levels might be quite different, depending on storage time.
Post-harvest changes in precursor concentrations will affect the potential for acrylamide formation as the relative concentrations change. This is particularly important for potatoes where formation of reducing sugars is very sensitive to storage conditions.
Nutritionally, potatoes and cereals can be considered as staple food commodities. Potatoes are a low-fat, high carbohydrate food in which the pre-processing acrylamide concentration is low. They are not inherently ‘unhealthy’ when eaten boiled or baked. However, increased consumption of processed potatoes, especially when fried, by Western populations is of concern, both in terms of higher fat intake but also through consumption of foods with higher acrylamide content. The kinetic decoupling of different paths of the Maillard reaction to obtain potato products with an optimal degree of browning and a minimal acrylamide content remains, in technical reality however, a major challenge for these products.
Refined grain cereal products dominate cereal consumption. Fine bakery products have particularly high acrylamide concentrations and so can contribute significantly to acrylamide intake. Recent recommendations suggesting to increase the consumption of wholegrain foods are likely to add to this intake since whole grains contain higher concentrations of asparagine and will lead to higher concentrations of acrylamide in wholegrain foods. Lowering baking temperature or shortening baking time can effectively reduce acrylamide formation. These measures have, however, also a significant impact on product characteristics. This applies for instance, also to selecting raw materials low in asparagine or to the use of asparaginase as processing aid. Sweetening agents that are not reducing sugars appear to be a measure with substantial mitigation promise as well. However, these methods significantly affect product quality.
Coffee is consumed as a beverage essentially for its hedonic properties, and as a stimulant through its caffeine content. Health benefits of coffee consumption are unclear or are only beginning to be unraveled but moderate consumption may have broad beneficial effects.
In modelling exposure to acrylamide, data from the Dutch National Food Consumption Survey (DNFCS) were used together with available data on acrylamide concentration in foods from the EU's Joint Research Centre (JRC) database. Intake calculations were made before and after mitigation measures were taken. Mitigation measures selected were entirely theoretical, based for the most part on pilot plant and laboratory-scale data. These data, therefore, may not represent mitigation effects which might be seen in industrial scale processes but are used as a demonstration of principle. In some cases, mitigation effects may be higher or lower than those expected at an industrial scale, but are nevertheless included in the range of measures used to give breadth to the outcome. Despite limitations in the dietary data and in the use of theoretical mitigation effects, the results of the modelling exercise are considered valuable in demonstrating possible consequences in terms of human exposure to acrylamide.
Application of the selected mitigation measures resulted in an overall reduction in acrylamide exposure from each of the food commodities. Intake calculations were performed before and after mitigation measures were taken. Exposure is affected by age group and cultures for which patterns of food group-consumption are different. However, in a theoretical scenario, including all the mitigation measures simultaneously clearly resulted in an increase in the MOE from 690 to 1180 (P50) and from 160 to 230 (P90) but these values are still significantly below the MOE of 10 000 recommended by both the EFSA and JECFA.
Some mitigation measures are associated with a loss in benefit or an increase in another risk. To demonstrate the principle of risk-benefit we calculated the effect of a single mitigation measure, using sodium bicarbonate as a baking agent in baked products, in order to quantify the risk-benefit of this measure; that is, the risk associated with increased sodium consumption against the benefit of reduced acrylamide exposure. After mitigation, exposure to acrylamide was shifted down (from 0·41 to 0·31 μg/kg bw per day) and exposure to sodium was slightly shifted up (from 42 to 44 mg/kg bw per day). An increase in sodium intake at certain levels is associated with a higher incidence of high blood pressure. Interpretation of an increase in sodium intake is complex and depends on dose-response health-relationships. For sodium, this information might be derived from epidemiological studies, but will still be uncertain at the levels reported in this study. A reduction in acrylamide concentrations in food results in a larger MOE. However, a dose-response relationship between lowers acrylamide intake and the number of cancer cases attributable to acrylamide is very uncertain at exposure levels experienced by the consumer. These uncertainties, and a lack of knowledge regarding the real health impact, hamper a good comparison between the positive and negative side effects of mitigation measures. The example, however, serves to demonstrate that the risk-benefit model is a useful method for calculating simultaneous exposure to two compounds.
In summary, this report provides a description and insights into some of the factors and data requirements that must be assessed and evaluated in the context of a risk-benefit analysis of the mitigation measures that may be under consideration for the reduction of acrylamide levels in three example commodities. The potential effect of mitigation measures on the overall MOE was assessed by modelling different exposure scenarios. The relatively small impact of the selected potential mitigation measures on the overall MOE was highlighted especially for high intake consumers. In case of simultaneous exposure to more than one compound as a result of a mitigation measure, there is a need to balance these potential risks v. the risk of potential acrylamide exposure. In this respect, the usefulness of a simultaneous exposure model as a potential tool for acrylamide risk-benefit analysis was demonstrated. Uncertainties in the limited available information, data and gaps in the current knowledge were also identified.
Background
Since the discovery of acrylamide being present in foodstuffs in 2002(Reference Tareke, Rydberg, Karlsson, Eriksson and Tornqvist1), many exposure assessments have been performed to determine quantitatively the exposure to acrylamide. ILSI Europe in collaboration with ILSI North America reviewed and discussed critical aspects of exposure assessments, parameters influencing the outcome of exposure assessments and summarized data relevant to the acrylamide exposure assessments to aid the risk characterization process in its publication ‘Human Exposure and Internal Dose Assessments of Acrylamide in Foods’. In this review, Dybing et al. (Reference Dybing, Farmer, Andersen, Fennell, Lalljie, Muller, Olin, Petersen, Schlatter, Scholz, Scimeca, Slimani, Tornqvist, Tuijtelaars and Verger2) stated that reducing the acrylamide content of foodstuffs may have an impact on nutritional quality (e.g. nutritional values, flavour, taste, texture) (microbiological) safety of food and on the formation of beneficial compounds. The authors, therefore, stressed that in parallel to the reduction of acrylamide, appropriate comparison of added risks and or reduced benefits v. the benefit from acrylamide reduction was needed.
As a next step, in May 2005 the ILSI Europe Task Force on Acrylamide held a brainstorming meeting with key stakeholders and decided to start an activity on risk-benefit analysis focusing on risk-benefit considerations of mitigation measures on acrylamide content of foods. An independent Expert Group (including scientific experts from academia, research institutions and industry) was established covering a range of scientific expertise such as agriculture, nutrition, food technology, chemistry, Maillard reaction, toxicology, and exposure assessment. The Expert Group examined and aimed to understand the impact of mitigation measures on safety, quality, nutritional and organoleptic parameters, to position the relevance of the suspected side effects and to quantify their potential impact. The experts used examples of mitigation measures as documented in reliable sources, e.g. the Confederation of the Food and Drink Industries of the EU (CIAA) Toolbox(3) and output from the HEATOX research programme(4). They used the three food groups (potatoes, cereals and coffee) that have been shown to significantly contribute to dietary intake as a case study. The Expert Group focused on the impact of mitigation on exposure scenarios, the risk to human health and multidimensional risk assessment approaches addressing, risk-risk analysis, risk-benefit analysis, risk reduction and mitigation strategies, aspects of life cycle assessment (if possible) and focused on bio-sciences, excluding societal aspects.
Concern about acrylamide
The detection of acrylamide in foods raised concerns because acrylamide has been classified a carcinogen(5). In his review of the carcinogenicity of acrylamide, Rice(Reference Rice6) concluded from animal data that acrylamide had a role in the development of tumors. The hypothesized mechanism of action is genotoxicity. There is, however, no human epidemiological evidence for any carcinogenic effect of dietary acrylamide exposure. Indeed, the epidemiological studies on acrylamide may not have been sufficiently sensitive to reveal potential tumors in humans exposed to acrylamide(Reference Rice6, Reference Wilson, Rimm, Thompson and Mucci7). Assessments of the risk of cancer from the exposure to acrylamide are usually based on the linear extrapolation model using data from rat studies. A mean lifetime cancer risk of 1·3:103 after lifelong exposure to 1 μg acrylamide/kg bw per day(5) was thus estimated, based on a calculation involving the T25 and LED10 variables(8). Assuming a lifetime acrylamide exposure of 0·36 μg/kg bw per day, this would lead to an estimated number of extra cancer cases of 30 in the Norwegian population of 4·5 million. Initial Swedish estimates were higher, amounting to 700 additional cancer cases, which is probably due to a different assumption regarding exposure levels and the use of a different extrapolation model, the multiplicative extrapolation model. The Swedish calculations were based on an additional cancer risk of 1 in 100 000 at an exposure of 0·08 μg/kg bw per day(8, Reference Paulsson, Granath, Grawe, Ehrenberg and Tornqvist9). In The Netherlands, an additional number of cancer cases of 75 (0·08 μg/kg bw per day related to lifelong additional risk 1:104) to 130 (0·14 μg/kg bw per day related to lifelong additional risk 1:104) was predicted as a consequence of acrylamide exposure(Reference Konings, Baars, van Klaveren, Spanjer, Rensen, Hiemstra, van Kooij and Peters10).
The formation of possibly hazardous compounds in foods such as acrylamide is due to heating. Heating results in desired and undesired effects. We start by giving a general overview on heating and the pros and cons of heating of foods.
Heat-induced changes
Foods are unstable from a thermodynamic point of view. That is to say, all kinds of reactions can potentially take place, which if uncontrolled may lead to the situation that the food becomes completely unfit for consumption. When heating foods, thermal energy is supplied to the food as a result of which the speed of reaction increases. A distinction can be made between chemical, biochemical, physical and microbiological reactions. Biochemical and microbiological reactions are essentially chemical reactions catalysed by enzymes. Physical reactions are not very temperature dependent. In contrast, biochemical and microbiological reactions are eliminated when a food is sufficiently heated due to inactivation of enzymes and microbes. Enzymes are inactivated because, as proteins, they are subject to heat denaturation, which results in the loss of their ability to catalyse reactions. The effect of heat on microbes is more complicated than just protein denaturation, and they are inactivated at elevated temperatures. Once biochemical and microbiological reactions have been eliminated, chemical reactions become the most important for consideration. An overview of the most important of these chemical reactions, and their effects on food quality changes is shown in Table 1.
Overview of chemical reactions in relation to quality of foods

Chemical reactions take place at any temperature as long as reactants are able to collide. However, the rate of the reaction is strongly dependent on temperature. This is made use of during cooling and freezing of foods, so that the reaction rate leading to quality loss is reduced substantially. Nevertheless, even in freezing conditions chemical reactions do proceed, albeit at a very low rate. Therefore, an important effect to take into account is time; if we wait long enough the effect of a reaction will become noticeable at a certain stage. In other words, heating intensity is important which is the combination of time and temperature. Reaction rates, and therefore quality changes, will increase strongly at elevated temperatures. As a rule of thumb, it can be assumed that with every 10°C increase in temperature, the reaction rate increases by a factor of 2–3 for chemical reactions. Fortunately, reactions that eliminate enzymes and microbes are much more strongly dependent on temperature, perhaps by a factor of 20–50 when temperature increases by 10°C. This allows the choice of time–temperature combinations such that desired reactions are stimulated and undesired reactions are kept to a minimum. This is the principle behind ultra high temperature (UHT) processing shown schematically in Fig. 1. If a very high temperature and a very short time is chosen, reactions that have high temperature sensitivity (such as inactivation reactions) are stimulated much more strongly than reactions with moderate temperature dependence (such as the Maillard reaction), which do not get the time to proceed substantially.
Highly schematic representation of the effect of time and temperature on heat-induced reactions. The time is expressed as the time needed to achieve some effect (e.g. 90 % inactivation of an enzyme, or 1 % loss of a vitamin).

The ‘pros’ of heating foods
Mankind has a long history of cooking and, most likely, it has been a major step in improving the food supply of human beings. Heating increases food safety and palatability, it allows preserving and storing of foods for some time, and last but not least it adds to attractiveness of foods. In today's modern society with industrial food processing, heating is probably still the most used processing step, even though there is a tendency to move towards so-called minimal processing techniques.
The safety of foods increases considerably when they are heated because micro-organisms are killed. Most vegetative cells are inactivated between approximately 60 and 80°C, while spores can be inactivated at temperatures above 100°C. In the latter case, foods become sterile and can be kept almost indefinitely from a microbial point of view (when properly packed). So, the first and foremost reason to apply heat is microbial food safety. A second reason is also linked to food safety when it concerns the inactivation of unwholesome or hazardous compounds, such as trypsin inhibitors in leguminosae, or ochratoxin A in coffee or cereals which can be inactivated by heat(Reference Perez de Obanos, Gonzalez-Penas and Lopez De11–Reference Boudra, Le and Le15). These are all desired changes induced by heating.
In general, the bioavailability of nutrients increases when foods are heated. Starch gelatinizes at temperatures >60°C and can then be digested by amylases. Proteins denature because of heat (usually at temperatures of between 60 and 80°C) and are digested more easily by proteases than undenatured proteins. Compounds such as carotenoids become better available because cell walls and organelles are destroyed so that bioavailability of compounds present in the cell and cell compartments is much increased.
Another reason why foods are heated is because of its effects on sensorial quality. Many foods gain in attractiveness when heated. This is in many cases due to the Maillard reaction; a chemical reaction between reducing sugars and amino groups that becomes noticeable in heated foods. It has an effect on colour, taste and flavour, but it also has nutritional implications. In most cases, the resulting changes are desired. Freshly baked bread, frying of meat, frying of potatoes, roasting of malt, cereals, and coffee, are some examples where the sensorial quality is much improved because of heating.
Sometimes, foods are heated because it is needed in processing as a processing aid. For instance, pumping becomes easier at higher temperatures because viscosity decreases and spray drying is only possible at higher temperatures. All in all, the pros of heating are considerable.
The ‘cons’ of heating foods
In relation to food safety, undesired changes associated with heating are those which may cause formation of compounds that are potentially health damaging. A striking example is the formation of acrylamide, the topic of this paper, as a result of the Maillard reaction between reducing sugars and asparagine. Another example is the formation of heterocyclic amines, for instance, when barbecuing meat. Some heterocyclic amines are carcinogenic, and formation of such compounds is to be avoided.
Undesired changes in relation to nutritional quality mainly involve the destruction of important nutrients. For example, in the pasteurisation temperature range some vitamins are subject to losses. In the sterilisation temperature range, amino acids, sugars and fatty acids increasingly become subject to chemical reactions and these reactions may lead to loss of nutritional quality.
In some cases, the Maillard reaction is not desired, such as in sterilized milk products, mainly because of formation of undesired taste compounds. Furthermore, extensive heating may lead to loss of quality because of changes induced in texture, or the loss of taste and flavour compounds. Loss of essential amino acids such as lysine through the Maillard reaction may seriously affect the potential biological value of protein within foods.
On balance the ‘pros’ of heating may outweigh the ‘cons’. However, there appears to be room for improvement through which the deleterious effects of heating may be mitigated.
Technological options to mitigate the effect of heating
From the reasoning given above, it is possible to deduce that heating is a matter of balance, and that a treatment should be sought that will result in maximum desired effects and minimum undesired effects. In order to find this balance in a scientifically sound way, the following must be known:
what reactions are important for quality,
how fast these reactions take place,
technological knowledge in terms of time and temperature distributions in the equipment used to heat the food.
In order to understand the first aspect, knowledge of food science as well as knowledge of the raw material that is heated is needed. The ability to translate quality aspects into reactions that affect this quality aspect is required. Since quality is a multidimensional concept, this is not a simple thing to do. For the second aspect, the kinetics of the reaction must be studied, and in addition knowledge on the food matrix that is heated is also needed; i.e. on the composition and structure of the food. For instance, it is common knowledge that the Maillard reaction takes place in both sterilized milk and in fried potatoes. The fact that potatoes contain a substantial amount of free asparagine has a large impact on the formation of acrylamide, whereas acrylamide is not formed in heated milk products because they do not contain free asparagine. In addition, water activity and temperatures used in preparing fried potatoes and sterilizing milk are very different, factors, which will also influence acrylamide formation. Another important aspect is structure: sometimes foods do contain reactants but these may be physically separated in which case the reaction cannot take place. These simple examples illustrate the importance of knowledge on the materials that are being heated. The third aspect concerns engineering knowledge. Industrial equipment is large and the effects of residence time distribution can have a big impact. Heating-up and cooling-down periods may add considerably to the effective heat intensity, and process optimization in this respect can be very rewarding.
In general terms, it can be stated that industrial cooking leads to a much better control of desired and undesired changes than home cooking. Even though better equipment becomes available nowadays in the kitchen (microwave, steam cookers) it is not the intention of the average consumer to cook in a tightly controlled, standardised way as is the case in industrial processing. Moreover, home equipment will usually not allow fine tuning of the processes taking place, whereas this is the case for industrial equipment.
The ultimate proof whether or not a product is acceptable lies with the consumer. If he/she does not like it then a product fails. So if, for instance, the concentration of acrylamide in French fries can be reduced considerably, but at the cost of other quality attributes, such as texture and taste, then the product will not be accepted. In general, a consumer will assume that a food is safe, and consequently, will not care too much about this aspect, at least not in his/her buying behaviour. It therefore remains the task of the food technologist to make sure that quality aspects in addition to food safety are optimized. In other words, we should minimize the risk and optimize the benefits. This highlights the need for development of risk-benefit approaches.
Exposure assessment
Based on the first exposure calculations performed by FAO/WHO in 2002, the exposure to acrylamide was estimated to be in the range of 0·3–0·8 μg/kg bw per day(16). Dybing and co-workers(Reference Dybing, Farmer, Andersen, Fennell, Lalljie, Muller, Olin, Petersen, Schlatter, Scholz, Scimeca, Slimani, Tornqvist, Tuijtelaars and Verger2) provide an overview of the estimates of exposure to acrylamide for various age groups in different countries. The average exposure for adults was close to 0·5 μg/kg bw per day, with 95th percentile values of about 1 μg/kg bw per day. The highest exposure was reported for young people aged 15–18 years in Germany, for whom the 95th percentile was 3·4 μg/kg bw per day. Recently the Joint FAO/WHO Expert Committee on Food Additives (JECFA) made a risk assessment of acrylamide and concluded that exposure estimates are consistent and that new calculations or product analyses are not likely to change exposure estimates(17).
The linear dose-response model assumes that a linear relationship exists between risk and exposure at both low and high doses, and that no threshold level for effects exists. This linear extrapolation is not considered to adequately represent the biological processes involved in carcinogenicity(16, 18–20). It is generally agreed that linear extrapolation overestimates the risk. The extent of overestimation is, however, neither known nor are the biological processes well-understood. Results of linear extrapolation are therefore quite often misleading and difficult to communicate. An overview of uncertainties and needs for a change in approach are given by the European Food Safety Authority (EFSA) in its opinion on the MOE(21). A similar approach was presented by JECFA and was thoroughly discussed in a workshop organised by the WHO, ILSI Europe and the European Food Safety Authority (EFSA) in 2005(17, Reference Barlow, Renwick, Kleiner, Bridges, Busk, Dybing, Edler, Eisenbrand, Fink-Gremmels, Knaap, Kroes, Liem, Muller, Page, Rolland, Schlatter, Tritscher, Tueting and Wurtzen22, Reference O'Brien, Renwick, Constable, Dybing, Muller, Schlatter, Slob, Tueting, van, Williams and Wolfreys23). The MOE is the ratio between a defined point on the dose-response curve for the adverse effect and the human intake. As a reference point on the dose-response curve, the BMDL is preferably used. The BMDL is the lower limit of the 95 % confidence interval for a dose that causes a low, but measurable response. The MOE can be used to prioritise different contaminants, providing that a consistent approach has been adopted(17, 21). Both the MOE approaches proposed by EFSA and JECFA concluded that an MOE of 10 000 and above would indicate a low concern from a public health point of view and is therefore considered of low priority for risk management actions. For acrylamide an MOE has been estimated at 300 for average consumers and 75 for high consumers. This MOE is based on an acrylamide exposure of 1 μg/kg bw per day (average consumers) to 4 μg/kg bw per day (high consumers) and a BMDL for the induction of mammary tumors in rat at 300 μg/kg bw per day(17).
The relatively small MOE, compared with the large MOE for polycyclic-aromatic hydrocarbons as reported by JECFA (MOE for average consumer 25 000) and for the heterocyclic amine PhIP (MOE for average consumer 260 000)(Reference O'Brien, Renwick, Constable, Dybing, Muller, Schlatter, Slob, Tueting, van, Williams and Wolfreys23) underlines the need for mitigation steps. The CIAA has developed a Toolbox describing possible mitigation measures for four food categories(3). In this study the possible impact of several mitigation steps on intake levels of acrylamide in general and on the MOE in particular are elaborated. For those that are promising, possible side effects should also be considered in a quantifiable way. In the EFSA colloquium on ‘Risk-benefit analysis of foods – methods and approaches’ it was discussed that the benefits should be modeled in a similar way to risk modelling(24). This should be done considering all concentration levels in all food items of the whole diet. In this context it should be noted that an increase in benefit could also be defined as a decrease in another risk.
The focus in the present article is on three food groups, namely potatoes, cereals and coffee, because these commodities give the highest exposure of acrylamide. The article considers pre-harvest, post-harvest and processing conditions on the formation of acrylamide in these three food groups. In the section ‘Modelling the effect of mitigation measures on exposure to acrylamide’, the impact of mitigation is calculated and an example is given of a probabilistic risk-benefit modelling approach based on one mitigation measure.
Pre- and post-harvest effects on acrylamide precursors
Introduction
Potatoes, cereals and coffee are not often considered together as a group. Here, they are unified because of the co-existence of precursors of acrylamide within the food matrix of each. Their great difference in genetic make-up and growing conditions, however, make it impossible to bring forward generic measures for the three species combined. Differences between the three species are outlined here, together with the possibilities to influence the concentration of acrylamide precursors in raw material. The precursors of acrylamide in the three species Solanum, Graminaea and Coffea are the same; asparagine and reducing sugars but the relative importance of these two differ substantially between the three species. In potatoes, asparagine is relatively abundant, making the concentration of reducing sugars the pivotal determining or rate limiting factor. In wheat and other cereals, reducing sugars abound so here the concentration of asparagine is the most important or rate limiting factor in affecting acrylamide formation in baked products. In coffee, acrylamide formation does not seem to be correlated to the concentration of reducing sugars, however, a weak correlation exists with the concentration of free asparagine in green coffee beans(Reference Lantz, Ternite, Wilkens, Hoenicke, Guenther and van der Stegen25). This is further complicated by the fact that in finished, roasted coffee, acrylamide is not at its maximum concentration. Unlike in cereals and potatoes, acrylamide does not accumulate during roasting, but rather, formation and degradation occur simultaneously, so that at the end of the roasting process only about 20 % of the peak concentration remains. During storage, acrylamide decays further. Therefore, a possible correlation of asparagine concentration and acrylamide formation early in the roasting process may be obscured by the degradation of acrylamide later in the roasting process and during storage(Reference Lantz, Ternite, Wilkens, Hoenicke, Guenther and van der Stegen25).
Coffee is a tropical perennial dicotyledon crop staying in the same field for dozens of years whereas the monocotyledon cereals and dicotyledon potatoes are annual crops that need to be sown or planted annually. An advantage of an annual crop is that when the variety or location results in excessive precursor formation, growers and processing companies can more easily shift variety or production site.
Coffee, and to a slightly lesser extent cereals, is sourced globally, whereas potatoes are processed more closely to production location. The former crops can also be stored for a longer period whereas potatoes have to be processed, even when stored under refrigeration, within 9 months. This reduces the flexibility of producers to look for sources of potatoes with low reducing sugar concentration in order to reduce acrylamide in fried potato products.
For both cereals and coffee, it is the seed which is harvested. For potatoes, however, the harvested material is a – morphologically speaking – swollen piece of stem grown in the subsoil. All three, however, are propagation material of the species. They differ in dry matter content; potatoes and coffee beans being wet at harvest and cereals being dry. This makes cereals physiologically relatively inert, enabling their long-term storage with limited possibility to influence precursors prior to or post-harvest. The high water content of green coffee beans and potatoes renders them metabolically active, thereby opening opportunities to affect precursor concentrations, e.g. in coffee when treating and drying the green beans, or by altering the temperature during storage of potatoes, allowing for changes in internal tuber composition.
The differences in type of precursor, coupled with pre- and post-harvest opportunities for manipulation are the basis of the following sections. They have in common, however, that in each of the three species precursor concentrations during crop growth can be influenced to a greater or lesser extent by altering the variety (G of genetics), the site or season of production (E of environment) and cultivation practices (M of management). The following sections discuss the opportunities that exist in terms of this G × E × M interaction.
Pre- and post-harvest effects on acrylamide precursors in potatoes
Introduction
In potato tubers starch is converted into (reducing) sugars for respiratory purposes. If not all sugars are metabolised they may accumulate, especially when tubers are stored at low temperatures (cold-induced-sweetening) or when they become aged (senescence-sweetening). In potatoes, reducing sugar concentrations are correlated with acrylamide formation(Reference Amrein, Bachmann, Noti, Biedermann, Barbosa, Biedermann-Brem, Grob, Keiser, Realini, Escher and Amado26). These authors sampled 74 potato fields from 17 potato varieties in 2002 grown at various locations in Switzerland and from different farming systems. They analysed the concentrations of reducing sugars (glucose and fructose), sucrose, free asparagine and free glutamine. They found a great variation in reducing sugar concentrations between tubers within the same sample. The concentration in seven individual tubers varied between 200 and 900 mg/kg and these concentrations were highly correlated (R 2 = 0·9856) with the amount of acrylamide formed in a standardised heating procedure (between about 100 and 400 μg/kg). Because of the strong observed variation at least 12–15 tubers were analysed per sample, grouped by variety. The results showed reducing sugar concentrations of between 120 and 4000 mg/kg tuber fresh weight, with usually more fructose than glucose. Sucrose concentrations of the 17 varieties varied between 430 and 1597 mg/kg, asparagine concentrations varied between 2030 and 4250 mg/kg and glutamine concentrations (detected in 11 varieties only) varied between 1003 and 2060 mg/kg tuber fresh weight. The concentrations of reducing sugars did not correlate with sucrose nor free amino acids. Of particular note, the data showed that on a molar basis, on average the concentration of asparagine was 5·6 times that of glucose and 3·7 times that of fructose. This abundance of asparagine is the reason why the concentration of reducing sugars is the limiting factor for acrylamide formation. The correlation coefficient for acrylamide formation with concentrations of reducing sugars alone (for 74 samples, R 2 = 0·88) was only slightly improved by using the product of concentrations of reducing sugars and asparagine (R 2 = 0·90). This is because of the aforementioned relative abundance of asparagine and its relative stable occurrence and to the much greater variation in reducing sugar concentrations in the samples tested. A repeat of the analyses in 2003 showed an even stronger correlation when asparagine was omitted from the correlation analysis (R 2 = 0·94). None of the other free amino acids, such as glutamine, glutamic acid and aspartic acid showed any correlation with acrylamide formation(Reference Amrein, Schönbächler, Rohner, Lukac, Schneider, Keiser, Escher and Amadò27).
Production and storage of the raw potato material
Genetic resource
Hertog et al. (Reference Hertog, Putz and Tijskens28) tested 10 different genotypes and found that the concentration of reducing sugars in immature crops (50 days before crop maturity) varied between 0·21 % (variety Semena) and 0·9 % (clone H1272/80). Genetically determined higher pre-harvest concentrations were correlated with higher concentrations induced by cold storage. Haase and Weber(Reference Haase and Weber29) tested four varieties on five sites in Germany during three growing seasons. At harvest, the variety Sempra consistently had the lowest concentration of reducing sugars (0·49 g/kg fresh weight, n = 30) and also the lowest increase in concentration after 6 months storage at 8°C (0·34 g/kg, totalling 0·83 g/kg), whereas the variety Agria had a concentration of 1·51 g/kg after storage. Cold-sweetening and senescence-sweetening were also found to be variety-dependent by Kumar et al. (Reference Kumar, Singh and Kimar30). Amrein et al. (Reference Amrein, Bachmann, Noti, Biedermann, Barbosa, Biedermann-Brem, Grob, Keiser, Realini, Escher and Amado26) found that potential for acrylamide formation varied from the variety Nicola at 2020 μg/kg to the variety Panda at 80 μg/kg; an 80-fold difference in acrylamide formation reflecting the large difference in the concentration of reducing sugars for the two varieties. In the following year the differences were similar although the absolute concentrations were different (1518 μg/kg for Nicola and 209 μg/kg for Panda). Pereira et al. (Reference Pereira, Coffin, Yada and Souza Machado31) reported an average of 340 mg reducing sugars/kg (range 180–460) in the processing variety Trent, and 1640 mg/kg (range 820–2470) for the variety Onaway which is much less suitable for processing. Amrein et al. (Reference Amrein, Schönbächler, Rohner, Lukac, Schneider, Keiser, Escher and Amadò27) found that varieties especially bred for low reducing sugar content for crisps production (such as Lady Claire and Panda) maintained low concentrations of reducing sugars in the two years tested and also during adverse growing conditions with hot spells and regrowth leading to French fries with dark tips, the so called ‘sugar ends’. The mechanisms of cold sweetening are being elucidated through molecular techniques(Reference Sowokinos32) based on quantitative traits to assist breeding with molecular markers that show breeders in the laboratory that the desired trait is present or not in a genotype, without having to grow the plant in the field.
Concentrations of reducing sugars in the tuber (pre-harvest)
Hertog et al. (Reference Hertog, Putz and Tijskens28) determined reducing sugar concentrations in ten different genotypes from 50 days before crop maturity until 110 days after crop maturity. During tuber growth the concentration of reducing sugars declined from an average of 0·3 % fresh weight (80 % of which was glucose) to 0 % when the crop was harvested at maturity. During storage, concentrations rose to almost 2 % after 50 days in the immature tubers. The closer towards maturity the tubers were harvested, the lower the initial concentrations observed. And during storage the concentrations rose less than those of tubers harvested earlier and with higher concentrations of reducing sugars.
After about 50 days in store reducing sugar concentrations of all samples from all harvest dates declined to 0·3 %. Early lifting clearly led to initial higher reducing sugar concentrations, an unfavourable characteristic for processing quality. Haase and Weber(Reference Haase and Weber29), testing four varieties on five sites over 3 years, consistently found that higher reducing sugar concentrations at harvest either because of variety, site or year were also followed by a stronger increase during 6 months storage at 8°C. These results were also corroborated by Laerke and Christiansen(Reference Laerke and Christiansen33) who tried to identify pre-harvest bio-markers in tubers of variety Saturna harvested on August 1, 15 and 31 in 1999 and 2000. The concentrations of reducing sugars in tubers when harvested in early, mid- or late-August were low in both years about 0·1 g/kg tuber fresh weight and went up to between 0·6 % (1999 crop stored until June 2000) and 1·5 % in the 2000 crop stored until June 2001. The authors were not able to correlate these changes with any pre-harvest biomarker in the tuber. High leaf nitrogen concentrations in mid-season and subsequent rapid leaf senescence resulting in relatively immature tubers were correlated with high reducing sugar concentrations during storage. But as the second part of the growing season is unpredictable, no biomarker could be derived from the leaf nitrogen concentration.
Kumar et al. (Reference Kumar, Singh and Kimar30) in their review concluded that weather conditions, fertiliser rates and harvest date were the main determinants of tuber maturity, both when expressed physically as skin set (meaning the skin becoming firm and resistant to chafing), but also when determined physiologically by the moment when dry matter (starch) content was highest and sugar content lowest. The concentration of sucrose in potatoes destined for processing into chips at harvest should be less than 1·5 mg/g to minimise accumulation of reducing sugars in long term storage at intermediate temperatures(Reference Kumar, Singh and Kimar30). Some authors, however, have not confirmed this observation, especially when storing tubers at low temperatures(Reference Pereira, Coffin, Yada and Souza Machado31).
Environment
The environment in which a crop is grown depends on site (soil and management system) and on the varying weather conditions during the season or year in which the crop is grown. Haase and Weber(Reference Haase and Weber29) when comparing 3 years (1999–2001) at harvest found 0·48 g/kg fresh weight reducing sugars on average in three varieties grown on five sites. Of these samples, the most susceptible potatoes to acrylamide formation came from the warmer season of 2000 with a reducing sugars concentration of 1·26 g/kg. Amrein et al. (Reference Amrein, Bachmann, Noti, Biedermann, Barbosa, Biedermann-Brem, Grob, Keiser, Realini, Escher and Amado26) compared 74 samples of 17 varieties from different farming systems and locations from the 2002 crop and the following year from 50 samples of similar origin(Reference Amrein, Schönbächler, Rohner, Lukac, Schneider, Keiser, Escher and Amadò27). On average the total reducing sugar concentrations were 50 % higher in 2003 (1682 mg/kg) than in 2002 (1119 mg/kg). The amount of acrylamide produced from the 2003 crop was higher (up to 4000 μg/kg) than from the 2002 crop (up to 2200 μg/kg). In both years under the same processing conditions the acrylamide yield was similar, at about 0·5 μg acrylamide per gram reducing sugar. The average concentration of asparagine in the 2003 crop was approximately 10 % higher, but this difference was not statistically significant (3358 mg/kg compared with 3086 mg/kg). The year 2003 had a particularly hot summer, the warmest in 500 years. August 2003 was 5°C warmer than the same month in the previous year. During hot and dry spells potato tuber growth stops(Reference Kumar, Singh and Kimar30) only to resume (secondary growth) when temperatures go down and soil humidity goes up as was the case in September 2003. Periods of high soil temperature during tuber growth induce translucent tubers with an uneven distribution of reducing sugars and a low dry matter concentration at the heel end of the tubers. Many susceptible varieties may also show signs associated with secondary growth after erratic precipitation and/or inadequate irrigation scheduling such as knobby tubers, sprouting tubers and elongated tubers. In processing for French fries these lead to so called ‘sugar ends’ as mentioned previously.
Crop fertilisation
Amrein et al. (Reference Amrein, Bachmann, Noti, Biedermann, Barbosa, Biedermann-Brem, Grob, Keiser, Realini, Escher and Amado26) analysed 74 samples that came from different farming systems, including organic, integrated and conventional. Nitrogen supply for the different systems ranged between about 40 and 200 kg N/ha and no influence on the concentration of reducing sugars and asparagine was detected nor was there a relationship between nitrogen application and acrylamide concentrations. De Wilde et al. (Reference De Wilde, De Meulenaer, Mestdagh, Govaert, Vandeburie, Ooghe, Fraselle, Demeulemeester, Van Peteghem, Calus, Degroodt and Verhé34) tested the influence of three rates of nitrogen supply to the crop on the concentrations of reducing sugars and free amino acids in the tubers after storage at 8°C for 24 weeks and on acrylamide formation during frying. The rates of nitrogen application were (1) a 160 kg/ha dose at planting and a post-emergence, variety and soil residual N dependent recommended dose (between 35 and 63 kg N/ha), (2) half of these amounts and (3) none applied at all. The highest concentrations of asparagine at over 1·5 % (of tuber dry matter) were observed in the advised N-supply treatment (treatment 1) and these were reduced to two-thirds of that level as nitrogen input reduced, but the resulting acrylamide formation was uncorrelated to this phenomenon. The concentration of reducing sugars went up with decreased N-application, e.g. variety Bintje from 0·24 % (dry matter) to 0·46 %. The concentration of reducing sugars correlated very well (R 2 = 0·84) with acrylamide formation during frying. The authors cautioned that the results were based on a single season with exceptionally high temperatures. De Wilde et al. (Reference De Wilde, De Meulenaer, Mestdagh, Govaert, Vandeburie, Ooghe, Fraselle, Demeulemeester, Van Peteghem, Calus, Degroodt and Verhé34) and also Laerke and Christiansen(Reference Laerke and Christiansen33) reported that a high concentration leaf nitrogen during the growing season was associated with high concentrations of reducing sugars. The strong correlation found by De Wilde et al. (Reference De Wilde, De Meulenaer, Mestdagh, Govaert, Vandeburie, Ooghe, Fraselle, Demeulemeester, Van Peteghem, Calus, Degroodt and Verhé34) may also be partly influenced by the particularly hot growing season inducing secondary growth and associated sugary potatoes.
Where excessive fertilisation leads to physiologically younger tubers at harvest (abundant nitrogen availability is such a factor), they are more susceptible to reducing sugar accumulation prior to and post-harvest. This may have been the reason why Kumar et al. (Reference Kumar, Singh and Kimar30) when reviewing the influence of nitrogen, potassium and phosphorus fertilisation, concluded that much of the data is inconclusive and in many cases is contradictory. However, most sources agree that higher potassium levels in the soil are associated with reduced concentrations of reducing sugars in the tubers at harvest. Heuser et al. (Reference Heuser, Gerendas and Sattelmacher35) in variety Agria detected a clear trend in a pot experiment in which reducing sugar concentrations at harvest more than doubled when tripling N-fertilisation and more than halved on average when applying potassium at a rate five times that of the lowest dose. Potassium reduced the dry matter content from 26 to 22 % so the effect on a dry matter basis would be much less but was still significant. Potassium does not delay crop maturity whereas nitrogen does, explaining the increase in reducing sugars with increased nitrogen supply.
Post-harvest treatment on cold induced and senescence sweetening
Amrein et al. (Reference Amrein, Schönbächler, Rohner, Lukac, Schneider, Keiser, Escher and Amadò27) stored three varieties (Agria, Charlotte and Bintje) at relatively high temperatures above 8°C and noticed a strong decrease in reducing sugar concentrations (from about 800 to 100 g/kg) with a corresponding reduction in the potential acrylamide formation whereas asparagine concentrations were unaffected. After 150 days, however, the tubers started to sprout which is a disadvantage. Laerke and Christiansen(Reference Laerke and Christiansen36), however, found in the variety Saturna during 3 years of testing that in two storage seasons the concentrations of reducing sugars went up and the crisps produced became darker. In a third year concentrations initially increased but decreased towards the end of the storage season between April and May. Similar improved processing quality characteristics after prolonged storage were also reported by Hogge et al. (Reference Hogge, Stalham and Allen37)
Although both research groups found immaturity of crops correlated with reducing sugars content there were also major differences between the two studies. Laerke and Christiansen(Reference Laerke and Christiansen36) who stored at 14°C for the first 2 months and thereafter at about 9°C reported reducing sugars concentrations which were 10 × lower than those reported by Hertog et al. (Reference Hertog, Putz and Tijskens28) who stored their potatoes at 4°C which would induce reducing sugars formation. After 4 months in store the cold induced high levels dropped somewhat whereas the high temperature induced low levels increased (senescence-sweetening).
Variety and store temperatures not only influence reducing sugar concentrations but also the length of the dormant period. Sprouting is associated with an increase in reducing sugars and sprout removal and inhibition by application of maleic hydrazide to the crop prior to harvest (in countries where not banned it is commercialised under the trade name ‘Fazor’), or isopropyl N-(3chlorophenyl)carbamate (CIPC) to the stored tubers may reduce the accumulation of reducing sugars although this is not always the case(Reference De Wilde, De Meulenaer, Mestdagh, Govaert, Vandeburie, Ooghe, Fraselle, Demeulemeester, Van, Calus, Degroodt and Verhe38). Cold-induced accumulation can be reversed by a large increase in the storage temperature from about 4 to 15°C. De Wilde et al. (Reference De Wilde, De Meulenaer, Mestdagh, Govaert, Vandeburie, Ooghe, Fraselle, Demeulemeester, Van, Calus, Degroodt and Verhe38) reported that cold-induced accumulation of reducing sugars in variety Bintje after 8 weeks of storage was reduced from 0·75 % (of the dry matter) to 0·18 % when the tubers were stored for 3 weeks at 15°C. Reconditioning for 3 weeks after a cold storage period reduced the concentrations of reducing sugars from 2·11 to 0·24 %. Once tubers have been stored for a prolonged period, irreversible senescence-sweetening takes place. Beside varietal differences, most conditions that influence post-harvest accumulation of reducing sugars (harvest, crop and store management) also determine the onset of senescence-sweetening(Reference Kumar, Singh and Kimar30).
Discussion and conclusions: potatoes
The abundant occurrence of asparagine compared with reducing sugars (about 2·5 times molar abundance) and consequently an absence of a correlation between varying concentrations of asparagine and those of acrylamide after frying on the one hand and the strong correlation of acrylamide with reducing sugar concentrations on the other gave good reason for focusing on reducing sugars when looking for means of reducing acrylamide in potato products (although it should be kept in mind that a total removal of one of the precursors will be efficient irrespective of the initial abundance of any of the reaction partners, see the section ‘Health benefits of consuming whole grains compared with refined grains’ on asparaginase). The concentration of reducing sugars has three main interacting components: genetics, the physiological age of the tuber when harvested and storage conditions (especially temperature). These are summarized in Fig. 2.
Schematic representation of reducing sugar concentration in potato tubers showing that high initial (pre-tuber maturity) reducing sugar levels lead to far higher levels at cold storage. The thin broken line represents tubers attached to the plant under ambient temperatures and the thick broken line represents post-harvest tubers stored at 9°C. Solid lines represent harvested immature (thin line) and mature (thick line) tubers stored at 4°C leading to cold sweetening. Dotted lines represent reconditioning at 18°C. Variety, levels of nutrients, weather and soil moisture determine tuber sugar levels during tuber growth and at harvest.

When tubers are physiologically younger at harvest they have higher concentrations of reducing sugars than in mature tubers, which rise higher during storage at low temperatures. Tubers are physiologically younger when harvested prematurely, i.e. before maximum yields and highest dry matter content have been achieved. Factors reducing the risks of harvesting too early are the use of earlier maturing varieties, and planting soils that allow late harvesting when conditions (especially rainfall) worsen. Selecting sites where harvests can be delayed may be a strategy for farmers and for procurement from which to source raw material. Less nitrogen and increased potassium application increase tuber maturity and reduce reducing sugar concentrations. High temperatures, that stop tuber growth even under moist conditions especially if re-growth follows when temperatures drop again, lead to physiologically younger tubers, which can partly be avoided by continued irrigation assuring unhampered growth.
Post-harvest treatments to reduce reducing sugar concentrations include an initial skin curing temperature for a few weeks of about 18°C followed by a storage period at 8°C for a few months. When prolonged storage is desired, lower temperatures of 4–5°C may serve followed by a reconditioning period of 3 weeks at 18°C. Where allowed, sprouting should be controlled chemically by spraying the crop before harvest or by treatment a few months after store loading. Irreversible senescence-sweetening is to be avoided by timely processing of susceptible lots.
Pre- and post-harvest effects on acrylamide precursors in cereals
Introduction
In cereals, sugars are relatively abundant. Glucose concentrations as a percentage of total dry weight were about 1 % glucose, 0·2 % fructose and 0·5 % maltose. Sucrose was about 0·5 % of total dry matter. Acrylamide formation was unrelated to individual or total reducing sugar concentrations(Reference Taeymans, Wood, Ashby, Blank, Studer, Stadler, Gonde, Van, Lalljie, Lingnert, Lindblom, Matissek, Muller, Tallmadge, O'Brien, Thompson, Silvani and Whitmore39).
For each commodity a different approach is needed to achieve desired levels of the target compound. Genetic diversity (different cultivars) interacts with the physiological age of the storage organ (tubers and grains), environment (climate) and crop management (water and nutrient supply). Post-harvest treatments (duration and conditions at storage) further influence concentrations of reducing sugars and asparagine. Mitigation, i.e. reduction of reducing sugars and asparagine may influence yield and other quality aspects which may have financial and or environmental repercussions.
The aim of this section of the paper is to evaluate the G × E × M (genotype by environment by management) interactions during production and storage of cereal raw material that influence the concentrations of compounds responsible for acrylamide formation at processing in order to be able to suggest mitigation measures allowing primary producers of raw material to meet specifications of processors for mutual benefit.
Production of the raw cereal material
Genetic resource
Asparagine concentrations in cereal species and varieties within a species vary widely. Elmore et al. (Reference Elmore, Koutsidis, Dodson, Mottram and Wedzicha40) in a standardized procedure compared cakes made of potato flour, whole wheat and wholemeal rye cooked at 180°C from 5 to 60 min. The concentrations of asparagine and reducing sugars declined linearly with an increase of acrylamide formed during baking. After about 20 min the rye cake had formed about 3100 μg of acrylamide per kg dry weight cake after which it declined to less than 1600 μg/kg. Wheat cakes peaked at about 1100 μg/kg and declined to about 700 μg/kg. The greater ability of rye to produce acrylamide was related to the higher asparagine concentration in this cereal (634 mg/kg) compared with wheat (172 mg/kg). Asparagine, as a percentage of total free amino acids was also higher in rye (26 %) than in wheat (16 %). Table 2 also shows why in cereals, where sugars are abundant, asparagine (8 % of the molar concentration of reducing sugars in rye and 3 in wheat) is the limiting factor in acrylamide formation, whereas in fresh potatoes the asparagine concentration on a molar basis is more than double that of total reducing sugars and sugars are the limiting factor for acrylamide formation.
Chemical composition of rye flour, whole wheat flour and potato flake, μmol/kg(Reference Elmore, Koutsidis, Dodson, Mottram and Wedzicha40)

A CIAA paper(41) reported free asparagine concentrations in wheat bran of 113 mg/kg, in wheat flour of between 267 and 434 mg/kg, depending on source (this is more than reported by Elmore et al. (Reference Elmore, Koutsidis, Dodson, Mottram and Wedzicha40), levels tend to vary depending on author), in rye flour between 319 and 791 mg/kg which is similar as reported by Elmore et al. (Reference Elmore, Koutsidis, Dodson, Mottram and Wedzicha40) in oat bran of 71 mg/kg and in oat flour of 50 mg/kg. Apparently oat flour and oat bran (48 mg/kg) have a similar asparagine content and a similar capacity to make acrylamide when baked. The same report mentioned that in another survey asparagine concentrations in 28 wheat samples varied between 150 and 450 mg/kg whereas 6 maize samples were all similar at about 70 mg/kg. From these data it can be concluded that wheat, maize, and rye or oats have decreasing asparagine concentrations and are likely to form less acrylamide when baked. Other data(41), however showed that cake made in a standard process with dough in which the dominant cereal varied had the highest acrylamide when wheat dominated (about 400 mg of acrylamide/kg cake dry matter), about similar intermediate levels when maize and oat dominated (150 mg/kg) and lowest when made of rice (less than 100 mg/kg). For similar products made from potato and cereal (e.g. potato or maize chips), the acrylamide concentrations in potato crisps bought in supermarkets occasionally were above 1000 μg/kg whereas the maize (corn) crisps contained 55–498 μg/kg.
The differences in asparagine content between species are considerable, but also between varieties within a species. Taeymans et al. (Reference Taeymans, Wood, Ashby, Blank, Studer, Stadler, Gonde, Van, Lalljie, Lingnert, Lindblom, Matissek, Muller, Tallmadge, O'Brien, Thompson, Silvani and Whitmore39) report a fivefold range in 31 wheat varieties grown mainly in the UK in 2002. For example, asparagine concentrations varied between 74 (variety Vault) and 664 mg/kg (variety Abbot). The correlation between asparagine concentration in wheat flour and acrylamide concentration of a baked product was examined using four wheat varieties with respectively 267, 321, 390 and 434 mg/kg asparagine (the reducing sugars concentration were very similar for the four varieties(41)). The resulting baked products had acrylamide concentrations of 656, 667, 923 and 874 μg/kg. The regression coefficient (R 2) for the correlation was 0·79, suggesting that almost 80 % of the variation in acrylamide formation was explained by the variation in asparagine content of the flour. Extended trialling may confirm and further strengthen the correlation(41).
Breeding for varieties low in asparagine has possibilities, but little is known about the interaction between variety and environment so the stability of the trait is not known until environment × genotype studies are carried out. Genetic modification by blocking asparagine accumulation by altering asparaginase expression has been mentioned by a research group in the UK, but has not yet been officially published (J. S. Elmore, personal communication).
Environment
Different sites lead to different concentrations of asparagine in the flour and acrylamide in the finished product. The CIAA Report(41) reported that an undisclosed processor baking wheat flour from four undisclosed regions in the same industrial process registered acrylamide concentrations varying between 13 and 796 μg/kg. Taeymans et al. (Reference Taeymans, Wood, Ashby, Blank, Studer, Stadler, Gonde, Van, Lalljie, Lingnert, Lindblom, Matissek, Muller, Tallmadge, O'Brien, Thompson, Silvani and Whitmore39) reported asparagine concentrations in flour, e.g. variety Abbot from five different sites in the UK in 2005 of between 329 and 664 mg/kg. Three samples of the variety Claire varied between 163 and 232 mg/kg and five Rialto samples between 178 and 286 mg/kg. Occasionally the reason for site specific asparagine concentrations becomes evident: Lea et al. (Reference Lea, Sodek, Parry, Shewry and Halford42) detected that increased saline concentrations were associated with higher asparagine concentrations, especially in sensitive wheat varieties. Muttucumaru et al. (Reference Muttucumaru, Halford, Elmore, Dodson, Parry, Shewry and Mottram43) found decreasing asparagine concentrations in wheat grown in substrate or soil in both in vitro and ambient conditions subjected to increased levels of sulfur. Field trials reported by Granvogl et al. (Reference Granvogl, Wieser, Koehler, Von Tucher and Schieberle44) showed a strong influence of sulphur fertilization on the amounts of free amino acids in wheat and correlation with baking properties as well as with 3-aminopropionamide and acrylamide generation during baking. Comparisons between years were not found but variation between years is not likely to be less than between sites.
Crop management
Crop management practices may include soil preparation, irrigation, crop protection and fertilisation. The effect of application of nitrogen fertiliser to increase protein content is very large. Figure 3 shows the impact of a range of nitrogen regimes on the percentage of protein in wheat flour(41) and the high correlation between protein concentration and asparagine concentration. For low protein content Growers, to optimise yield, will tend to increase nitrogen inputs due to the positive correlation between fertilisation and grain yield.
Correlation of asparagine level (mg/kg) with protein content for wheat grown over a range of nitrogen fertiliser regimes(41).

No reports on the influence of storage duration and conditions on asparagine and reducing sugar concentrations in cereals were encountered. However, large variations would not be expected since cereals contain about 15 % water whereas potatoes contain about 77 % water. This would suggest that metabolic rates in cereals would be much lower than in potatoes during storage.
Discussion and conclusion: cereals
In cereals, acrylamide formation is linked to the concentration of asparagine in the flour used to make the finished product. The concentration of reducing sugars, depending on species, may be 10–50 times higher than that of asparagine. Rye has the highest content of asparagine, about fourfold that of wheat. Rice has the lowest content and maize and oats are intermediate. Bran of oats but especially of wheat has higher asparagine concentrations than the corresponding flour from these species. Asparagine concentrations in wheat depend on G × E × M interactions where, besides genotype, environment seems to be a more influencing factor than management. It is not clear from the material available what causes the difference in sites. Further research is needed to establish the relative contribution of weather patterns, availability of soil moisture and nutrients or interactions of these factors. Different sites and years will lead to such different environments. A possible approach to tackle this problem may be a ‘factor analysis’ in which possible relevant environmental data of known samples can be related to asparagine concentration.
Varietal differences have been demonstrated but within varieties environmental differences are great. Research might show the robustness of low asparagine content in certain varieties.
The only management practice to indirectly influence asparagine concentrations is nitrogen fertilisation. Research on direct relations between nitrogen application rates in field trials (rather than comparing sites and years where many more factors than nitrogen rate differ) and asparagine concentrations are needed to corroborate the reported findings. Moreover they should establish the trade-off between reduced yields and improved quality when lowering nitrogen application dose. Assessment of other managerial factors such as application of nutrients other than nitrogen, water and crop protection may also reveal an influence on asparagine concentrations.
Currently, until further research shows additional evidence, the best options are to look for genotypes low in asparagine, grown on sites that have shown reduced potential for asparagines accumulation and grown under a moderate nitrogen regime. These combinations are likely to result in low concentrations of asparagine in the raw material and less acrylamide formation during processing.
Pre- and post-harvest effects on acrylamide precursors in coffee
Introduction
Commercial coffee production is based on the main two plant species, Coffea arabica (commonly known as arabica coffee) and Coffea canephora (known as robusta coffee), which developed in different regions of tropical Africa (Ethiopia and Guinea to Uganda, respectively). Although some 60 countries throughout Africa, North and Central America, South America and Asia produce coffee, a large proportion of the world production of arabica is contributed by Brazil and Colombia and by Indonesia and Vietnam for robusta coffee. The largest importers of coffee are Europe and the US(Reference Willson45, Reference Anzueto, Baumann, Graziosi, Piccin, van der Vossen, Illy and Viani46).
Arabica and robusta beans have different characteristics concerning aroma, taste, flavour and body. Chemical differences between arabica and robusta beans are well documented and reside in the contents of, for instance, caffeine, trigonelline, amino acids, chlorogenic acids, lipids and the diterpenes cafestol, kahweol and 16-o-methylcafestol(Reference Anzueto, Baumann, Graziosi, Piccin, van der Vossen, Illy and Viani46).
In the following sections, aspects that can be considered to have a potential influence on acrylamide formation, such as precursor levels of free amino acids, in particular asparagine, and reducing sugars, are discussed.
Production and storage of the raw coffee beans
Environment
Arabica and robusta coffee plants grow under special climatic conditions. Arabica originates from the highlands of Ethiopia, and requires a cool, tropical climate with relatively high rainfall. Trees grow on acidic soil with good drainage properties under partial shade and require cycles of wet and dry periods to trigger flowering and ripening of the fruit. Robusta developed in the lowlands of the Congo River basin with high rainfall and short dry periods, at constantly high temperatures and humidity. Robusta trees are therefore bigger with larger leaves.
Cultivars of coffee are generally propagated by seed which germinate 4–5 weeks after sowing. Under optimal conditions, young plants from seedlings flower 12–15 months after planting, producing a first light crop 2·5 years after planting. Temperature and seasonal changes in humidity (water stress) have a critical influence on stages of dormancy, flowering and ripening of the cherries. Repeated cycles of pruning are necessary to maintain a uniform annual harvest. Since coffee plants are perennial, breeding cycles take 20–30 years(Reference Anzueto, Baumann, Graziosi, Piccin, van der Vossen, Illy and Viani46).
Fertilisation
The effects of fertilisation, climate and soil are mostly established/evaluated by the state of leaves, growth rate of the trees, development of the beans and production yield rather than effects on chemical composition of the beans(Reference Willson45). Therefore, no data are available on the impact of agricultural practice on the amounts of precursors for acrylamide formation in the beans, nor on the effect on acrylamide concentration found in roasted coffee.
Harvest and post-harvest treatment
Besides the characteristics and provenance of the coffee variety, post-harvest treatment is known to have a crucial impact on coffee quality. Three principal ways to harvest exist, so called stripping (of all cherries from the branches), picking (manual, only ripe cherries) or mechanical (machine aided) harvest, which result in mixtures of cherries at different stages of maturity. Harvest should be performed when most of the cherries are ripe, with a maximum of 5 % unripe cherries present. Once the coffee cherries are harvested, the bean has to be stripped of all its outer layers, pulp and skin, in order to dry the bean. This can be accomplished by three alternative methods, the natural (dry) process, the washed (wet) or the pulped natural process, which involve different levels of fermentation to remove the mucilage. Drying is then performed under the sun, in mechanical dryers, or a combination of both, whereby care has to be taken that the beans are of similar maturity and that drying is performed slowly and uniformly(Reference Bee, Brando, Brumen, Carvalhaes, Koelling-Speer, Suggi Liverani, Teixeira, Teixeira, Thomaziello, Viani, Vitzthum, Illy and Viani47). It is evident that the chemical composition of the coffee bean changes under processing, and differences can be expected depending on each of the processes applied (dry, wet, washing, fermentation).
Chemical analysis revealed a slightly higher overall concentration of free amino acids in robusta (~4500 ± 220 mg/kg dry mass) compared with arabica coffee (~4000 ± 270 mg/kg dry mass), with glutamic acid, asparagine and aspartic acid being the most abundant amino acids in both species(Reference Arnold, Ludwig, Kuhn and Moschwitzer48). The same authors identified considerable differences in free amino acid composition during post-harvest treatment, after model drying, fermentation and storage of green arabica beans(Reference Arnold and Ludwig49). Drying at 40°C considerably reduced concentrations of asparagine, glutamine and aspartic acid, while strongly increasing glutamic acid, and, to a lesser extent, leucine, valine, phenylalanine and isoleucine. Drying at 80°C reduced overall concentrations of free amino acids more or less uniformly, probably due to the Maillard reaction. When the pulp was removed by fermentation prior to drying (at 40°C) of the beans, the concentrations of free amino acids did not change significantly compared with drying alone, indicating that fermentation does not have a big impact on the composition of green coffee beans.
More recent studies show that metabolic processes occur during post-harvest treatment that alter the chemical composition of the beans. Particularly glutamic acid was reported to be enzymatically converted to γ-aminobutyric acid (GABA), a metabolic marker induced by drought stress(Reference Bytof, Knopp, Schieberle, Teutsch and Selmar50). Metabolic changes were recently attributed to germination that occurs during wet treatment (washing and depulping), but not in dry processing, and have a significant impact on coffee quality. Selmar et al. (Reference Selmar, Bytof, Knopp and Breitenstein51) demonstrated the expression of germination specific enzymes (isocitrate lyase) and initiation of cell division upon wet processing in a model system.
The profile and concentrations of free amino acids were reported to change during post-harvest processing of green coffee beans (drying temperature, fermentation, storage). Steam treatment affected the free and total amino acids in green beans, with glutamic acid, asparagine, arginine, leucine, phenylalanine, tryptophan and lysine concentrations decreased, which corresponded to a 10 % decrease in protein bound amino acids, and a 50 % loss of free amino acids(Reference Clarke and Vitzthum52). Robusta beans were reported to have a slightly higher content of free asparagine in the green beans compared with arabica beans (600–1050 mg/kg in robusta, 150–900 mg/kg in arabica(Reference Lantz, Ternite, Wilkens, Hoenicke, Guenther and van der Stegen25)). Similar results were reported by Murcovic and Derler(Reference Murkovic and Derler53). Variations were suggested to result from different processing practices that are traditionally applied to arabica and robusta green beans (harvest, washing, drying)(Reference Arnold and Ludwig49) that may also have an impact on the free amino acid profile in general and the free asparagine content in particular before roasting.
Besides changes in the free amino acid profiles, changes in the sugar content are also important factors for sensorial properties of the roasted coffee (flavour and colour) that result from different post-harvest treatment(Reference Knopp, Bytof and Selmar54). Sucrose makes up 90 % of low molecular weight (MW) sugars in unwashed arabica beans, corresponding to about 7–8 % of dry mass (DM). Sucrose (and other low MW sugars present at low concentrations such as stachyose, raffinose and rhamnose) did not change significantly by the model processing applied. In contrast, concentrations of glucose and fructose which are present at concentrations about 20 times lower compared with sucrose (~0·22 and ~0·33 g/100 g DM, respectively), decreased considerably depending on post-harvest processing (to less than 0·05 g/100 g DM). While upon dry processing, concentrations of glucose and fructose remained constant, wet processing had a strong decreasing effect. The same was true for arabinose, galactose and mannose, which were present at concentrations 100-fold below those of glucose and fructose. Galactose, however, also declined in the dry process. Although leaching of low MW sugars has been proposed previously as a reason for the decline in their concentration in coffee beans, the authors suggested their specific consumption in metabolic processes induced by anaerobic fermentation during wet treatment(Reference Knopp, Bytof and Selmar54).
Storage
When stored (warehousing) under appropriate conditions (to avoid spoilage through growth of mould and bacteria), green coffee beans are relatively stable from a compositional point of view. However, losses of proteins and peptides are observed under storage at elevated temperatures, due to proteolysis, and loss of free amino acids due to non-enzymatic browning. Elevated humidity and temperature also lead to an increased decay of substances due to the (living) beans respiratory processes (using oxygen in the interstitial, or intergranulate, space of the bean). Long storage decay (>1 year) is associated with change of colour, woody aroma, sourness, chemical degradation of free amino acids and sugars, and lipid oxidation(Reference Bee, Brando, Brumen, Carvalhaes, Koelling-Speer, Suggi Liverani, Teixeira, Teixeira, Thomaziello, Viani, Vitzthum, Illy and Viani47).
Discussion and conclusions: coffee
Since coffee plants are perennial and consequently have a long life cycle, and their cultivation requires very specific climatic conditions, efforts to mitigate a specific process contaminant such as acrylamide through agricultural practice would/will take considerable time in breeding studies. In addition, coffee is sourced worldwide, thus the implementation in the country of sourcing of new breeding practices once established experimentally will take another considerable amount of time. However, practices of post-harvest processing might be one possibility to exploit the feasibility with respect to specific reduction of precursor levels (asparagine).
Effect of food processing technologies on acrylamide
Introduction
Several options have been identified to lower the amount of acrylamide in the field of food processing technology. One of the initiatives to gather these mitigation measures is the Toolbox by CIAA(3). One has to bear in mind that because of the complexity of Maillard reaction, the abundance and diversity of products containing acrylamide, and the complexity of the products, it is virtually impossible to eliminate acrylamide. The goal set by CIAA and the EU is to establish a reduction in acrylamide content, without loss of beneficial properties of foodstuffs.
Mitigation of acrylamide can theoretically be established at different levels: agronomical, recipe, processing, and end product characteristics. Obvious mitigation options like increasing moisture, lowering baking temperature and baking time are not taken into account since they interfere with sensory quality and product characteristics (crispness, flavour, colour, shelf life). Successful mitigation measures effective in one food group are not necessarily equally effective in another food group. For instance acrylamide reduction in coffee has to meet different demands compared with potatoes or cereals. An effective reduction in acrylamide concentration can only be achieved by implementing a range of mitigation measures specified for certain foods or food groups. Below, mitigation measures on different levels in processing technology are described for potatoes, cereals and coffee.
Effect of food processing technologies on acrylamide in potatoes
Acrylamide contents in potato products
Since the start of the acrylamide discussion, heated potato products have been in the focus of public interest due to the high acrylamide contents detected in some of these products. Fried potatoes, e.g. French fries, potato wedges, hash browns (Rösti), oven-fried potatoes and crisps are the most relevant products in this topic, whereas boiled potatoes contain virtually no acrylamide.
As mentioned in previous sections, these high amounts are mainly caused by large contents of free asparagine as one of the main precursors in potato tubers. This kind of product therefore is frequently monitored by government food authorities and a large amount of published data are available [see for example, (Reference Lineback, Wenzl, Ostermann, de la, Anklam and Taeymans55) or (56) for Germany or (57, 58) for the USA]. Maximum concentrations of 2310 μg/kg for ready-to-eat French fries and 4215 μg/kg for crisps were published by German food authorities for 2005(59). Median values are 212 μg/kg and 363 μg/kg, respectively, indicating a broad range of measured values in this kind of products.
Heated potato products, e.g. French fries or chips, often are consumed as a part of daily diets, especially in the case of children or adolescent people. Therefore, these make a significant contribution to acrylamide intake(Reference Dybing, Farmer, Andersen, Fennell, Lalljie, Muller, Olin, Petersen, Schlatter, Scholz, Scimeca, Slimani, Tornqvist, Tuijtelaars and Verger2). According to Wilson et al. (Reference Wilson, Rimm, Thompson and Mucci7) acrylamide intake from fried potatoes and potato crisps represents 35 % of total acrylamide intake in USA and up to 46 % in The Netherlands. Biedermann-Brem et al. (Reference Biedermann-Brem, Noti, Grob, Imhof, Bazzocco and Pferfferle60) estimated an additional intake of acrylamide of about 30 μg per day caused by one single portion of Rösti (250 g) per month.
Due to the high amounts of acrylamide measured in potato products and their significant contribution to daily acrylamide intake, many minimization efforts have been concentrated on these kinds of products. However, it has to be taken into account that heated potato products are also perceived as high quality products with respect to sensory properties. Therefore, lowering of the high quality standards established during decades is to be avoided when acrylamide mitigation is aimed at. In particular, colour (browning) and crispness are such quality parameters. The strong correlation between acrylamide content and degree of browning, which was found soon after detection of acrylamide in food, has driven the first measures to avoid an over-browning of these products. These include frying recommendations in the case of homemade French fries(Reference Grob, Biedermann, Biedermann-Brem, Noti, Imhof, Amrein, Pfefferle and Bazzocco61) or in removing over-coloured pieces in industrial processes. Nevertheless, process interventions which result in pale and soft products due to insufficient cooking and evaporation conditions arising from low temperatures or short frying times are perceived as low quality and, therefore, are not acceptable for the food industry. Such approaches will not be discussed below.
To obtain potato products with a desired and expected degree of browning and low acrylamide contents, the kinetic de-coupling of different paths of Maillard reactions remains the main challenge for this kind of product. Some of the published approaches in this very complex topic will be described and discussed below. It is not intended to discuss all known interactions regarding acrylamide formation during potato processing. Only approaches for an aimed reduction verified under lab-scale or industrial conditions will be considered.
A summary of mitigation measures including possible adverse effects of these measures on nutrition and health is given at the end of the chapter.
French fries and similar products
This section deals with the French fries type potato products characterized by a crispy outer texture and a soft mealy core. This means that these products retain their moist core where the temperature during processing does not exceed 100°C. Acrylamide formation is limited to the outer dehydrated layers(Reference Franke, Sell and Reimerdes62). During frying, large temperature and moisture gradients exist in these products(Reference Gökmen, Palazoglu and Senyuva63) resulting in significantly different local reaction conditions. Accordingly mitigation measures for acrylamide also have to consider local differences, especially the material exchange processes at the interface between product surface and surrounding frying oil, e.g. water evaporation and oil penetration, play an important role for chemical reactions in the outer product layers. In contrast, measured acrylamide concentrations are averaged over the whole product.
It has to be kept in mind that French fries often are industrially par-fried and sold in a frozen state especially for private households or in a refrigerated state for catering and restaurants. At this stage the acrylamide contents are very low or negligible. The majority of acrylamide is formed during final preparation in the household or restaurant, and, therefore, outside of the supervision of industry itself. Such a multi-step preparation process complicates the application of mitigation measures for this product category.
Raw material influence and pre-treatment before processing
With respect to potatoes, the very strong correlation of acrylamide formation and precursor contents (reducing sugars) has been confirmed by numerous authors and has been discussed in detail above. Normally, concentrations of the precursor free asparagine exceed the amounts of reducing sugars, so that a slight variability in asparagine contents only has negligible effects on acrylamide formation in potatoes. However, in the case of relative low contents of free asparagine in potatoes, this precursor will also control the final acrylamide contents as shown by Franke and Reimerdes(Reference Franke and Reimerdes64).
In addition to selection of appropriate farming and storage conditions, pre-treatments of potato sticks during industrial fabrication of par-fried French fries and similar products can be considered for mitigation measures(3). In particular, blanching and pre-drying of the sticks before par-frying are of interest with respect to possible interventions. Obvious measures are the reduction of precursors at the product surface and control of Maillard reaction pathways to suppress acrylamide formation during browning. The first way includes reduction of precursors by leaching, e.g. blanching, and by enzyme treatment. The enzymatic reduction of free asparagine by asparaginase in French fries has been described(Reference Heldt-Hansen, Rittig, Budolfsen Lynglev, Stringer and Ostergaard65–Reference Elder, Fulcher and Leung67). Heldt-Hansen(Reference Heldt-Hansen, Rittig, Budolfsen Lynglev, Stringer and Ostergaard65) found acrylamide reductions of 80 % compared with untreated samples in lab scale experiments. Regarding sources and legal status of asparaginase application for reduction of amino acid asparagine see the section ‘Health benefits of consuming whole grains compared with refined grains’. The elimination of free amino acids has also been proposed by Tricoit et al. (Reference Tricoit, Salucki and Rousset68) using silica gel as an adsorbing agent.
A shift of Maillard reaction pathways away from acrylamide generation can be achieved by modification of processing conditions during heating. One possible measure is lowering pH-value which reduces acrylamide formation. Pedreschi et al. (Reference Pedreschi, Kaack and Granby69) immersed potato strips in a 1 % citric acid solution and found an average reduction of 53 % in acrylamide formation. Jung et al. (Reference Jung, Choi and Ju70) reported reductions of about 80 % after soaking for about 1 h in 1 % citric acid. Baardseth et al. (Reference Baardseth, Blom, Enersen, Skrede, Slinde, Sundt and Thomassen71) also claimed that acid treatment of uncooked French fries prior to heating reduced the acrylamide content of the fried product. However, such a pre-treatment leads to distinct changes in sensory properties and is limited to special applications, e.g. French fries consumed with vinegar. Another possibility is the modification of the ionic strength in the outer layers, e.g. by soaking in salt (NaCl) solutions(Reference Reimerdes and Franke72–Reference Lindsay and Sungjoon74). Reductions of up to 40 % due to salting were found for French fries. Earlier investigations indicated lower fat uptake of French fries after soaking in salt solutions and similar sensory properties compared with French fries salted after frying(Reference Bunger, Moyano and Rioseco75). Another approach to shift reaction pathways is the addition of other amino acids(Reference Elder, Fulcher and Leung76–Reference Low, Koutsidis, Parker, Elmore, Dodson and Mottram79) or thiol components(Reference Elder80).
An enhanced pre-drying of blanched French fries before frying to reduce the frying time while maintaining similar quality with respect to browning and crispness can contribute to lower acrylamide contents in the final products(Reference Franke, Sell and Reimerdes62). In lab-scale experiments reductions of up to 75 % by application of salt treatment in combination with pre-drying were found. Recently, Erdogdu et al. (Reference Erdogdu, Palazoglu, Gökmen, Senyuva and Ekiz81) stated that application of microwave pre-treatment reduced acrylamide concentrations in French fries by up to 60 % compared with unblanched products. It has to be kept in mind that these reductions are measured in lab-scale experiments and possible effects of these measures in the industrial scale have to be checked for every product including its special quality requirements and for the processing lines.
Processing
The total heat load of French fries during processing, i.e. temperature and duration of frying, seems to have the major impact on acrylamide formation(Reference Matthäus, Haase and Vosmann82). Therefore, lower frying temperatures combined to slight extension of the frying time to obtain the desired degree of browning and crispness have been proposed(Reference Grob83, Reference Fiselier, Bazzocco, Gamma-Baumgartner and Grob84). Application of these specific and selective interactions have been utilized during the very early stage in discussions on reduction of acrylamide and, in the case of French fries, included in preparation instructions for the consumer on packaging. A two-step frying process with lower temperatures in the second step to avoid excessive acrylamide formation has been postulated by Barry et al. (Reference Barry, Burnham, Maganlal Desai, Joseph, Kin-Hang Leung, Masson, Mohan Rao, Saunders, Stalder and Topor85)
Potato crisps, including fabricated crisps
In French fries a major part of the moisture is retained in the soft core limiting the core temperature to approximately 100°C, whereas in potato crisp products moisture of the whole product is normally lowered to levels below 2·5 % resulting in core temperatures above 120°C. Therefore, acrylamide is formed through the whole product resulting in higher contents than in French fries despite shorter frying times. This very low moisture is necessary for the desired texture properties and storage stability of these types of potato products.
Generally, similar mitigation measures as discussed for French fries are applicable but modifications are necessary due to different product sizes and manufacturing processes. Especially in the case of fabricated crisps prepared from dried and powdered potato components, e.g. granules or flakes, and other ingredients, extended possibilities for pre-treatments are available for potato processors.
Raw material influence and pre-treatment before processing
The raw material influence of potato tubers has been discussed above. However, due to the thinner product sizes compared with French fries, pre-treatments on the surface, e.g. soaking or fermentation, are more effective.
Elder et al. (Reference Elder, Fulcher and Leung76) suggested an addition of other amino acids to potato crisps to prevent higher acrylamide contents in the fried crisps. Additional blanching steps or soaking of the slices before frying which have diluting effects on precursors, can also contribute to lower acrylamide contents in the final product(Reference Matthäus, Haase and Vosmann82, Reference Pedreschi, Kaack and Granby86). However, for shorter blanching times, which is the reality in industrial scale, these effects have not been found(Reference Wicklund, Ostlie, Lothe, Knutsen, Brathen and Kita87). Blanching of potato crisps can affect their final texture compared with untreated crisps. Additionally, the enzymatic degradation of reducing sugars (e.g. by glucose oxidase) before frying has been proposed in a patent specification as a way to reduce acrylamide formation(Reference Howie, Yau Tak Lin, Zyzak and Schafermeyer88). But no scientific publications are available on effects of enzymatic lowering of reducing sugars on acrylamide concentration and on product quality (browning, taste).
Furthermore, fermentation of crisps surfaces by micro-organisms, e.g. yeasts, to reduce precursors for acrylamide formation have been proposed(Reference Awad and George89, Reference Gröting, Lichtsinn, Meuser and Jank90). Awad(Reference Awad and George89) claims reductions in acrylamide formation of up to 81 % compared with untreated samples for fabricated potato crisps fermented by a mix of bacteria and yeasts. In the case of fabricated crisps, the exchange of potato components by other raw material, having much lower contents of free asparagine, e.g. wheat starch, has been recommended(3).
Processing
The influence of frying oil temperature is more significant for potato crisps compared to French fries due to the higher final product temperatures. Application of lower oil temperatures requiring longer frying times for dehydration reduces final acrylamide concentrations in the product(Reference Haase, Matthaus and Vossmann91). Granda et al. (Reference Granda, Moreira and Tichy92) reported acrylamide reduction rates of up to 90 % with the use of low-temperature vacuum frying (125°C instead of 180°C) in lab-scale. It has, however, also to be considered that lower frying temperatures often increase oil uptake during frying(Reference Saguy and Pinthus93, Reference Ufheil and Escher94).
In contrast, very high frying temperatures above 200°C can reduce final acrylamide concentrations due to intensified degradation reactions of acrylamide(Reference Taubert, Harlfinger, Henkes, Berkels and Schomig95, Reference Gökmen and Senyuva96). Therefore, ‘flash frying’ at very high temperatures with very short times can also contribute to lower acrylamide contents in potato crisps(3).
Summary and conclusions
Table 3 lists mitigation measures for potato products mentioned in the literature and possible side effects with respect to nutrition and health, whereas possible effects on product quality, texture, taste, colour, are not fully considered. It can be assumed that all manufacturers will adapt their process interventions for acrylamide reduction on their own quality standards to make sure that their products maintain consumer acceptance. Therefore, mitigation measures resulting in distinct quality modifications will not be implemented in industrial scale by the food processors.
List of potato products* and mitigation measures, which have been tested in labscale or pilotscale experiments

* For each product category qualities including taste and texture may also alter significantly.
† Reduction percentages are related to untreated samples.
It should be mentioned that the individual measures or interventions cannot be regarded as completely superimposable under industrial conditions because all percentage reductions are related to untreated control samples. This means that a combination of different interventions will be lower than the sum of each individual intervention relative to an untreated control. In addition, the possibility of interactions should be considered. Therefore, a simple addition of percentage reductions is not meaningful and all combinations of mitigation interventions have to be tested and verified under industrial conditions both with respect to achievable acrylamide reduction and with respect to possible quality impacts. In some cases, process simulations may be useful to predict effects of combinations of interventions on resulting acrylamide reduction(Reference Reimerdes and Franke72).
Due to the high complexity of the Maillard reaction pathways during cooking in real food systems with their heterogeneous composition, the understanding of formation of desirable and undesirable substances and their contribution to quality, nutrition and health relevant effects in human bodies is very incomplete and not sufficient for a fundamental assessment of these food heating processes. In particular the discovery of potential health promoting substances formed during heating, such as pronyl-lysine(Reference Lindenmeier, Faist and Hofmann97) and others, illustrates the need for further fine tuning of the heating process in order to eventually arrive at processing conditions that favour the generation of health promoting, at the expense of undesired substances(Reference Pedreschi, Kaack and Granby86).
Effect of food processing technologies on acrylamide in cereal products
Acrylamide content in cereal products
JRC (DG Joint Research Centre), in collaboration with CIAA, has set up a database collecting European monitoring data of the acrylamide content of various foods. To date, the database comprises 7150 data sets (latest update June 2006(57)). In this database, cereal products are roughly classified into different food types: fine bakery ware (covers all types of biscuits, except infant biscuits and biscuits for diabetics), ginger bread, crisp bread (all kinds; rye, wheat, sesame, etc.), infant food, diabetics' products, and breakfast cereals. Since the acrylamide concentration in bread is relatively low, soft bread is not specified as a cereal product class in this database. However, high intake of a low acrylamide product can also form an important contribution to total acrylamide intake. According to the USFDA-CFSAN(98) mean acrylamide intake from soft bread was 0·019 μg/kg bw per day; this was considerably lower than intake from cookies (0·036 μg/kg bw per day), breakfast cereal (0·043 μg/kg bw per day) or French fries (0·058 μg/kg bw per day)(99). For the overall Dutch population cereal products contribute about 30 % of the dietary exposure to acrylamide(Reference Boon, de, van, van, Brette and van Klaveren100). Therefore, mitigation of acrylamide concentrations in cereal products can play a vital role in the reduction of exposure to acrylamide. Table 4 summarises mitigation measures for cereal products with potential levels of reduction and side effects.
List of cereal products* and mitigation measures, which have been tested in labscale or pilotscale experiments

* For each product category qualities including taste and texture may also alter significantly.
† Reduction percentages are related to untreated samples.
‡ CBP = Chorleywood bread process, a rapid mechanical dough development method widely used in the UK.
Recipe
Several alterations in the recipe can lower the amount of acrylamide. For example, addition of trace amounts of trace elements such as Ca, Mg, and Zn is considered to reduce acrylamide concentrations. Addition of cocoa powder and glycine at relatively low concentrations results in acrylamide reduction. However, not all possible measures have been suitably evaluated for their impact on organoleptic factors. Also a benefit-risk evaluation is necessary before implementing these measures.
In laboratory scale experiments for fine bakery ware, ginger bread and crisp bread, the replacement of ammonium bicarbonate with sodium bicarbonate can lead to a reduction in acrylamide of up to 70 %(Reference Graf, Amrein, Graf, Szalay, Escher and Amado101) and >60 % when combined with addition of organic acid(Reference Amrein, Schonbachler, Escher and Amado102). This substitution is easy to incorporate in the process, however, the taste of the product may be affected, and the disadvantage of higher sodium concentrations has to be assessed in the context of public health strategies aimed at reducing sodium intake.
Similar to lowering the amount of sugar to reduce the amount of acrylamide being formed, the substitution of reducing sugars by non-reducing sugars leads to a reduction of approximately 60–70 %(Reference Graf, Amrein, Graf, Szalay, Escher and Amado101–Reference Vass, Amrein, Schönbächler, Escher and Amado103), however, browning of the product is insufficient after this replacement, leading to altered product characteristics. This measure has been successfully evaluated in fine bakery ware, ginger bread and crisp bread. Addition of citric acid has been tested in fine bakery ware, however, the reduction by this measure was relatively small at only 30 %(Reference Graf, Amrein, Graf, Szalay, Escher and Amado101), although product integrity remained intact.
Processing
Extended yeast fermentation reduces the amount of acrylamide in crisp bread. However, this may alter product properties considerably. A potential risk is the formation of 3-monochloropropane-1,2-diol (3-MCPD) that is brought about by the increase in glycerol in combination with an acidic pH(Reference Hamlet and Sadd104). Thus in this case, reducing acrylamide concentrations by extended fermentation processes will result in increased concentrations of another potentially hazardous compound. Since the chemical reaction that forms acrylamide from asparagine is a result of high temperature, lowering the thermal input may lead to a substantial decrease in acrylamide. However, shorter preparation time and lower temperature lead to a product that spoils easily. Further, product assets like colour, flavour, and texture may change dramatically.
Addition of asparaginase as a processing aid to the raw product is a very promising mitigating measure(Reference Heldt-Hansen, Rittig, Budolfsen Lynglev, Stringer and Ostergaard65, Reference Amrein, Schonbachler, Escher and Amado102, Reference Vass, Amrein, Schönbächler, Escher and Amado103, Reference Heikoop105). The naturally occurring enzyme converts asparagine into aspartic acid. As a result the amount of acrylamide in bread crust is decreased by 36–75 % and more than 80 % in crackers, cakes, cookies and Dutch honey cake(106). Asparaginase is produced by Aspergillus niger (107) or Aspergillus oryzae (108) and can be applied to an abundant variety of products. Aspergillus strains have been used for decades to produce food and feed enzymes, further, they produce asparaginase naturally. Many food enzymes, including those from Aspergillus, have been evaluated and accepted by JECFA, FDA and European national authorities. Also the GRAS notice on asparaginase as produced by Aspergillus niger (106) has received no objections from FDA and furthermore its safety is endorsed by the French Food Safety Authority, AFSSA. The use of asparaginase has several advantages; relatively little amounts are needed for a significant reduction in acrylamide level, the product characteristics and organoleptic properties remain intact, as for potatoes no recipe changes are needed for cereals, addition of asparaginase does not affect the nutritional value of the product, nor diminishes specific beneficial properties like antioxidant capacity, and addition of the enzyme is easily incorporated into most industrial baking processes.
End product characteristics
Consumers could be advised to lower their demands for colour, texture, and flavour. When they accept a product with a lighter colour, a shorter shelf life, and less crispy, baking time and temperature could be reduced and consequently acrylamide levels would be lowered.
Discussion and conclusion
Lowering baking temperature or shortening baking time can effectively reduce the acrylamide content of food items. However these measures also significantly affect product characteristics. Selecting raw materials low in asparagine or other types of grain also changes product quality and may lower nutritional value. Several activities by CIAA and industry are ongoing to develop effective measures for acrylamide reduction without affecting product integrity. Examples of this type of measures are the use of sucrose instead of reducing sugars, and the use of asparaginase as a processing aid. A summary of possible mitigation processes is shown in Table 5.
Acrylamide content of cereal products, possible reduction, mitigation measure used and sustainability of product quality

* AA, Acrylamide. Acrylamide concentrations adapted from JRC database(56).
† Median: the acrylamide content of 50 % of the considered samples were reported below that value.
‡ Change composition of breakfast cereals; avoid use of asparagine-rich grains like wheat bran. Limitation: wheat is an important source of fibre and other beneficial nutrients.
Effect of processing technologies on acrylamide in coffee
Introduction
Data gathered on acrylamide concentrations in roast and ground coffee powder in the European Union since 2002 range between 79 and 975 μg/kg, with a median value of 286 μg/kg. Depending on the country, coffee is one of the biggest contributors of dietary acrylamide intake (Table 6). In northern European countries, for instance, the contribution of coffee to acrylamide exposure reaches close to 40 %. The estimated contribution of coffee intake on overall human acrylamide exposure varies substantially, depending not only on cultural differences and the target age group observed, but also on the type of food intake assessments of national authorities(Reference Dybing, Farmer, Andersen, Fennell, Lalljie, Muller, Olin, Petersen, Schlatter, Scholz, Scimeca, Slimani, Tornqvist, Tuijtelaars and Verger2).
Exposure contribution of coffee to overall acrylamide exposure in various countries

Recipe (including blending)
Coffee is considered a single ingredient product, manufactured by roasting only the green beans, i.e. without the addition of other basic ingredients. However, blending of coffees (different varieties, differently processed, from different provenances) is used to generate coffee with consistent quality and certain mechanical factors such as formation of crema during the extraction of espresso coffees. Blending can be done before or after roasting(Reference Bee, Brando, Brumen, Carvalhaes, Koelling-Speer, Suggi Liverani, Teixeira, Teixeira, Thomaziello, Viani, Vitzthum, Illy and Viani47). More complex mixtures ensure the maintenance of quality when some ingredients change. Consequently, also any changes in the composition with respect to acrylamide precursor concentrations in one coffee variety will be diluted in the blend, unless these changes are realised in other or all of the coffee components in the mixture. Thus, alternatives to reduce acrylamide by changing the recipe or blend are very limited.
Most of the procedures applied in processing of potato products or cereals are not applicable to coffee, such as changes in pH, addition of ingredients that may compete with asparagine in the Maillard reaction (glycine, di- and tri-valent cations) or fermentation(3). Although some of the patent applications seem to involve the addition of compounds that may compete with the formation of acrylamide in the Maillard reaction, these methods have not been exploited experimentally and no quantitative data on acrylamide reduction are available.
Processing – roasting
Roasting of coffee is a complex process, involving transfer of heat through the three-dimensional structure of the bean, transport of water vapour, transport of CO2 and volatiles generated in roasting, and changes of volume, structure, material and chemical composition. Studies on acrylamide formation during roasting demonstrated that concentrations rapidly increase to high levels that peak after approximately 70 % of the roasting time, and then decrease again(Reference Lantz, Ternite, Wilkens, Hoenicke, Guenther and van der Stegen25, Reference Taeymans, Wood, Ashby, Blank, Studer, Stadler, Gonde, Van, Lalljie, Lingnert, Lindblom, Matissek, Muller, Tallmadge, O'Brien, Thompson, Silvani and Whitmore39, Reference Senyuva and Gökmen109). At the point where roasting is finished, acrylamide concentrations are reduced to 20–30 % of the maximum peak levels. Dark roast coffees, therefore, have a slightly lower average acrylamide content than regular or lighter roast coffees.
Table 7 illustrates the variability of acrylamide in roast and ground coffees from the market. The data variability is largest in the EU monitoring database(57), since it compiles data from a wide range of coffees from the European market analysed in different laboratories, using different analytical methods. Studies performed within a more limited scope with specific analytical methods show much less data variability.
Variability in acrylamide concentration (μg/kg) in roast and ground coffee

Throughout the European market, differences in consumer preferences exist regarding the roasting degree of coffees. In Germany, light to medium roast coffees are preferred, whereas in southern/Mediterranean Europe, consumers favour darker roast coffees. The degree of roast is inversely linked to acrylamide concentration in the roasted coffee, ranging from ~350 μg/kg in very light roast down to ~200 μg/kg in very dark roast(Reference Lantz, Ternite, Wilkens, Hoenicke, Guenther and van der Stegen25). In addition, radical scavenging activity (as measured by Trolox activity) similarly decreases with higher roasting grade(Reference Summa, De la Calle, Brohee, Stadler and Anklam110). In Spain, sugar is added during the roasting to achieve a stronger aroma (torrefacto coffees(Reference Clark111)). No information is available on the impact of sugar coating on acrylamide formation. However, since sugars are not the limiting factor for acrylamide formation, the impact of the torrefacto process is expected to be low.
Robusta beans contain slightly higher amounts of acrylamide than arabica beans when roasted under similar conditions, a fact that is thought to be related to the slightly higher content of free asparagine in the green robusta beans(Reference Lantz, Ternite, Wilkens, Hoenicke, Guenther and van der Stegen25, Reference Murkovic and Derler53). In addition, this variation can also result from different processing practices that are traditionally applied to arabica and robusta green beans (harvest, washing, drying, see above) that also have an impact on the free amino acid profile in general and the free asparagine content in particular before roasting.
The amount of carbohydrates does not seem to be correlated to the amount of acrylamide formed after roasting. The limiting factor in the formation of acrylamide in coffee appears to be the concentration of free asparagine rather than the concentrations of reducing sugars in green coffee beans(Reference Lantz, Ternite, Wilkens, Hoenicke, Guenther and van der Stegen25). The correlation is, however, weak, because the formation, which initially may be well correlated to the asparagine precursor concentrations, is later reduced by the destruction of acrylamide in the roasting process. No acrylamide is found in green coffee beans. Only a small fraction [less than 0·2 % on a molar basis, calculated from (Reference Lantz, Ternite, Wilkens, Hoenicke, Guenther and van der Stegen25)] of asparagine is converted to acrylamide. Virtually all free amino acids are, however, consumed during roasting and participate in the generation of aroma and flavour.
Process parameters
The following parameters were investigated for their impact on the formation of acrylamide during roasting:
● method of heat transfer (convection or conductivity)
● roasting speed (1·5–16 min)
● degree of roasting (very light to very dark)
● cooling (air, water)
● moisture content of green coffee (7–14 %)
Due to the formation kinetics of acrylamide, degree and speed of roasting have an effect on acrylamide formation if analyzed over the whole process range including under- and over-roasting(Reference Lantz, Ternite, Wilkens, Hoenicke, Guenther and van der Stegen25). At the same time these parameters are key to the organoleptic properties. For this reason there is only a narrow window for variation due to significant impact on the product characteristics, and acrylamide does not significantly change within that acceptable window. The method of heat transfer, cooling and initial moisture content did not affect the acrylamide concentration of the roasted product(41).
Mitigation (patents)
Several patents have been filed that claim a reduction of acrylamide in several processed foods including coffee. One of the patents involves the enzymatic hydrolysis of asparagine using asparaginase(Reference Dria, Zyzak, Gutwein, Villagran, Young, Bunke, Lin, Howie and Schafermeyer112). While trials using asparaginase have been successfully applied to the processing of fabricated potato crisps and cereals, no data are available on coffee processing. A reduction was furthermore claimed by Elder et al. (Reference Elder, Fulcher and Leung113), but no method was disclosed. A patent filed by Purtle et al. (Reference Purtle, Eyal and Vitner114) involves the addition of a reducing sugar and a reagent containing an amino acid to the raw beans. Sahagian and van Eijck(Reference Sahagian and van Eijck115) claim to reduce acrylamide while retaining the organoleptic properties of the cooked food by the treatment with glycine prior to heating. The practical applicability of these methods and their impact on the final coffee product, however, remains to be established.
Storage of roasted coffee
Acrylamide concentrations in roasted coffee were reported to decrease with storage time (Table 8). Delatour et al. (Reference Delatour, Perisset, Goldmann, Riediker and Stadler116) reported a decrease from 203 to 147 μg/kg in roasted coffee over a 7 months period. Similar results were reported by Andrzejewski et al. (Reference Andrzejewski, Roach, Gay and Musser117) Levels of acrylamide decreased from 305 to 210 μg/kg and from 285 to 200 μg/kg in roasted and ground coffee and roasted coffee beans, respectively, after 3 months of storage(Reference Hoenicke and Gatermann118). No decrease was however, observed in soluble coffee after several months of storage(Reference Delatour, Perisset, Goldmann, Riediker and Stadler116, Reference Hoenicke and Gatermann118).
Loss of acrylamide during storage of coffee

Recently, the loss of acrylamide during storage of roast and ground coffee was investigated in more detail over time(Reference Lantz, Ternite, Wilkens, Hoenicke, Guenther and van der Stegen25). The loss was greatest during the first 2–3 months of storage, and depended on the storage temperature. Higher storage temperature (+37°C) led to a more rapid and more efficient decrease, while low temperatures ( − 18 to +4°C) had only a minor effect. The reported decrease from 350 down to 200 μg/kg acrylamide at room temperature after 3 months of storage is consistent with results previously shown by others (see Table 8). The mechanism behind this loss is currently unknown. One study indicates that acrylamide is (by an as yet unknown mechanism) bound to the coffee matrix during storage, since spiking of roast and ground coffee with radioactively labeled acrylamide showed an increased retention of radioactivity in the coffee matrix after brewing with increased storage time(Reference Böhm, Baum and Eisenbrand119). It has to be stressed that reaction mechanisms that result in the reductions during storage are not an option to date to reduce acrylamide concentration in coffee, since it is directly linked to quality and organoleptic properties and, consequently, consumer acceptance. In addition, the storage loss of acrylamide is already to a certain extent occurring in the market, since coffees are already stored for some time before they reach the consumer. However, for the purpose of this paper, and since it is the only quantitative measure currently available, a partial decrease of 20 % is used in the modelling approach in order to assess the impact of acrylamide mitigation in coffee on human exposure and MOE.
Formation of other process related compounds
Important changes in chemical composition occur upon roasting of coffee, including caramelisation and degradation of carbohydrates, denaturation of proteins and reaction of free amino acids with carbohydrates in the Maillard reaction, leading to the formation of volatile and non-volatile aroma compounds, melanoidins, aldehydes, acids, etc. These reactions are discussed in detail elsewhere(Reference Clarke and Vitzthum52, Reference Illy and Viani120–Reference Charles-Bernard, Roberts and Kraehenbuehl123). Some process-related compounds, which are known for decades to occur in roasted coffee are discussed below. These compounds may be of importance in a risk-risk analysis of measures to reduce acrylamide. Quantitative data with respect to acrylamide reduction measures are unavailable to date, and hence will not be discussed within the scope of this publication.
3-Monochloropropane-l,2-diol (3-MCPD) was originally known to occur in acid hydrolysed vegetable proteins and soy sauce, but traces were also found in toasted bread and roasted coffee. Like acrylamide, 3-MCPD formation appeared correlated with the colour of roasted coffee beans, while arabica coffees contained lower 3-MCPD concentrations than robusta coffees(Reference Dolezal, Chaloupska, Divinova, Svejkovska and Velisek124). Furan (and various derivatives) is long known to be present in roasted coffee(Reference Maga125) and was more recently found to be formed in various heat-treated foods. Concentrations in coffee brew amounted to between 10 and 20 μg/kg. Since furan is highly volatile, its concentration decreases in coffee brew over time(Reference Goldmann, Perisset, Scanlan and Stadler126). Several groups have reported its occurrence in coffee(Reference Ho, Yoo and Tefera127, Reference Hasnip, Crews and Castle128) and databases were generated by the EU (updated 2006) and FDA (updated 2006). Information on the conditions and kinetics of furan formation are scarce, but sugars seem to be important precursors [(Reference Mark, Pollien, Lindinger, Blank and Mark129) and references therein]. The oxidation of polyunsaturated fatty acids at elevated temperatures and the decomposition of ascorbic acid derivatives were also discussed to play a role(Reference Becalski and Seaman130). 5-Hydroxymethylfurfural (HMF) is known to be formed by dehydration of carbohydrates under acidic conditions in various foods, including roasting of coffee [(Reference Murkovic and Pichler131) and references therein]. HMF is also considered an indicator of quality deterioration, as a result of excess heating or storage, and might indicate adulteration of honey with invert sugar syrup. HMF content is expected to increase with increased roasting.
Discussion and conclusions
No information is available on the reduction, nor the impact of reduction, of individual free amino acids and of asparagine, on organoleptic properties or the resulting acrylamide concentrations after roasting. Since free amino acids and proteins are strongly involved in formation of aroma and flavour, the quantity and type of amino acids directly affect the intensity and quality of aroma. Since the limiting factor for acrylamide formation seems to be the free asparagine content, the factors influencing the concentrations of the reducing sugar precursors fructose and glucose are of less importance.
Many studies have been performed on compositional changes during coffee roasting. The reactions taking place are complex, and involve many biologically/chemically active compounds. Up to now, one option to reduce acrylamide in coffee, that could potentially be made use of to a limited extent is its loss during storage. The practicability of this measure is, however, questionable. For the purpose of this work, as a working number a potential to reduce acrylamide by storage loss of 20 % was used. Grob et al. (Reference Grob83) recently acknowledged that for coffee, no significant further mitigation appears in sight. The variations in acrylamide concentration in coffee are related to the roasting degree, which closely resembles the market range and consumer preferences in Europe. The formation of other process-related compounds has been studied for some time, the formation of which partially depends on precursors that are also involved in acrylamide formation (sugars). The quantitative relationship between these compounds and acrylamide formation during roasting has not been extensively exploited to date.
Impact of roasting on other coffee constituents/biologically active compounds
Coffee is known to contain numerous (biologically active) compounds with various characteristics, the composition of which may or may not change significantly during post-harvest processing and roasting. With few exceptions, the presence, formation and/or degradation of these constituents during roasting have not been studied with respect to the formation of acrylamide to date. The presence and formation of coffee constituents and their biological effects have been described in detail elsewhere(Reference Clarke and Vitzthum52) and will only briefly be summarized in the following sections.
Carbohydrates
Sucrose is the major low molecular weight carbohydrate in green coffee, making up 7 % of the dry mass. Sucrose content is slightly higher in arabica coffee. Sucrose is rapidly degraded upon roasting, resulting in the formation of low molecular weight fragments and aliphatic acids (formic, acetic, glycolic and lactic acid). Sucrose is also consumed in caramelisation (dehydration) reactions forming important heterocyclic compounds (including aroma compounds) that can further polymerise to form melanoidin-type compounds. Furthermore, sucrose can react with amino acids or proteins in the Maillard reaction to form low or high molecular weight melanoidins that are responsible for the generation of the brown colour, taste, and volatile aroma compounds(Reference Arya and Rao121). The monosaccharide content is relatively low (1 % in total of glucose, fructose, raffinose, stachyose, galactose, arabinose, rhamnose, mannose(Reference Knopp, Bytof and Selmar54)). Glucose and fructose, which are also degradations products of sucrose, are rapidly degraded upon roasting(Reference Arya and Rao121).
The high molecular weight fraction of green coffee carbohydrates mainly consists of arabinoglactan polymer, mannan and/or galactomannan and cellulose. Total polysaccharides make up around 50 % in green coffee beans and are degraded by up to 40 % depending on roast degree. Polysaccharides contribute to organoleptic properties such as mouth feel, viscosity and foam stability(Reference Fischer, Reimann, Trovato and Redgwell132–Reference D'Agostina, Boschin, Bacchini and Arnoldi134). The insoluble hemicellulose (23–24 % of DM) and cellulose (13 % of DM) are largely unaffected by roasting, whereas structural changes (such as reduced degree of polymerisation) occur in arabinogalactans, galactomannans and mannans, leading to improved extractability(Reference Arya and Rao121).
Acids
The profile of acids in coffee changes during roasting, while acidity increases. Main acidity is generated at the beginning of roasting, indicated by a fall in pH. Acids are responsible for 11 % of green bean weight, and 6 % of roasted bean weight. Acidity is also recognized as an important attribute of sensory quality (fine acidity of arabica)(Reference De Wilde, De Meulenaer, Mestdagh, Govaert, Vandeburie, Ooghe, Fraselle, Demeulemeester, Van, Calus, Degroodt and Verhe38, Reference Ginz, Balzer, Bradbury and Maier135). Important acids in green coffee are chlorogenic, quinic, malic and citric acid, which also vary between different coffee varieties and origin. Citric, malic and chlorogenic acid decrease during roasting, while quinic acid increases due to the degradation of chlorogenic acid. Other aliphatic acids such as formic, acetic, glycolic and lactic acid are formed as products of sucrose degradation(Reference Ginz, Balzer, Bradbury and Maier135). Acidity of coffee also increases upon storage of coffee brew with time and temperature(Reference Verardo, Cecconi, Geatti and Giumanini136).
Oil
Oils make up around 15 % of dry mass in arabica beans, and 10 % in robusta beans. The loss of actual lipid matter upon roasting is low. Important components of the oil fraction are the coffee diterpenes cafestol and kahweol, free and esterified sterols, tocopherol and wax. Amounts of the diterpenes vary between arabica and robusta, and the concentrations of free diterpenes are low compared with the diterpenes bound in lipids. They are sensitive to heat, acid and light. The concentrations of esters also decrease with roasting temperature. Upon roasting, new diterpenes are formed (dehydrocafestol and kahweol), while cafestol and kahweol decrease (up to 80 % depending on roasting temperature). Some derivates are more stable during roasting (o-methyl-cafestol)(Reference Clarke and Vitzthum52). Cafestol and kahweol are thought to be responsible for an increase in serum cholesterol levels(Reference Higdon and Frei137–Reference Bonita, Mandarano, Shuta and Vinson139). At the same time, they induce the activity of glutathione-S-transferase activity. This is considered a chemoprotective effect, shown to provide protection against aflatoxin B1 induced genotoxicity(Reference Bonita, Mandarano, Shuta and Vinson140, Reference Cavin, Holzhaeuser, Scharf, Constable, Huber and Schilter141).
Sterol compounds in coffee are not affected by roasting. Roasting reduces the concentrations of α-, β- and γ-tocopherols by 80–100 %. Coffee wax makes up 0·3 to 0·3 % of total coffee lipids, and is found in the outer layer of coffee beans. Waxes are partly decomposed by roasting. A component of the wax, 5-hydroxytryptamide, is thought to be the agent responsible for gastric irritation, and therefore coffee low in wax is termed ‘low irritating’(Reference Arnold, Ludwig, Kuhn and Moschwitzer48, Reference Fehlau and Netter142).
Amino acids and protein
Free amino acid content in green beans is only 0·3–0·6 %(Reference Arnold, Ludwig, Kuhn and Moschwitzer48). They are largely transformed by roasting. With carbohydrates, they participate in reactions generating flavour and aroma compounds (Maillard reaction) and in the formation of melanoidins.
The protein content of coffee beans is reduced from 12 to 10 % upon roasting, corresponding to a loss of 21 %, taking into account the weight loss of the beans. Most of the protein (85 %) is represented by globulins (11S storage protein). The loss of individual amino acids during roasting depends on their reactivity (e.g. ε-aminogroups easily react to form melanoidins in the Maillard reaction). In addition, proteins are less soluble after roasting (extractability into the brew), which was attributed to protein denaturation, chemical reaction, degradation and conversion to aroma compounds(Reference Bekedam, Schols, van Boekel and Smit143).
Antioxidants and inducers of metabolic enzymes
Antioxidants are natural constituents in coffee and include phenolic compounds, chlorogenic acid, caffeic acid and caffeine. While many of the antioxidants naturally present in coffee are degraded (phenolic compounds, caffeic acid, ferulic acid, coumaric acid), others are formed by roasting in the Maillard reaction (melanoidins). Somoza et al. (Reference Somoza, Lindenmeier, Wenzel, Frank, Erbersdobler and Hofmann144) identified high phase 1 enzyme inducing activity in freshly brewed coffee, as determined by dose dependent induction of metabolic enzyme inducing activity cytochrome c reductase (CCR) and phase II glutathione-S-transferase (GST) enzyme activities in a human intestinal cell culture system(Reference Somoza, Lindenmeier, Wenzel, Frank, Erbersdobler and Hofmann144). The authors identified N-methylpyridinium as a key inducing compound in the low molecular weight ( < 1 kDa) hydrophilic fraction of a coffee brew, the concentration of which amounted to 5·39 mg/l of coffee beverage. However, the antioxidant activity of N-methylpyridinium in vitro as determined by linoleic acid autoxidation was low. In contrast, 5-chlorogenic acid, a natural coffee compound with strong antioxidant activity with respect to linoleic acid autoxidation, did not show significant effects on phase I and II enzyme induction in the intestinal cell culture model. In rats, feeding either lyophilised coffee brew or N-methylpyridinium similarly increased blood antioxidant capacity (measured as trolox equivalents and blood tocopherol). Increased phase II enzyme activities in the liver (GST and UDP-glucuronosyltransferase; UDP-GT), however, were statistically non-significant. Pyrazines are important flavour compounds generated in heated foods including coffee. A recent study investigated the relation between formation of acrylamide, colour, pyrazines and antioxidants in asparagine/glucose model systems(Reference Ehling and Shibamoto145). The formation of pyrazines increased with time and temperature, but in contrast to the formation kinetics of acrylamide, they did not degrade at later stages but rather accumulated. Higher asparagine concentrations seemed to favour pyrazine formation. Acrylamide formation was strongly correlated to colour formation but not to antioxidant activity as determined by hexanal oxidation. A more recent study investigated the formation of radical scavenging activity in coffee roasted to different degrees(Reference Summa, De la Calle, Brohee, Stadler and Anklam110). The authors demonstrate that degradation of acrylamide at the end of the roast process is strongly correlated to a decrease in radical scavenging activity and is furthermore correlated to the formation of colour.
Odorants
Hundreds of volatile compounds have been identified in roasted coffee, the profile of which is dependent on a number of factors, including species, provenance, and degree of roast, storage and brew. Odorants are mainly formed by the Maillard reaction, degradation of phenolic acids and carotenes, etc.(Reference Clarke and Vitzthum52)
Caffeine
Caffeine is an important physiologically active compound in coffee and its effects have been and are still addressed and discussed in countless studies. Caffeine is well known for its stimulative effect on the central nervous system, elevation of blood pressure, increase in metabolic rate and diuresis(Reference Higdon and Frei137). Coffee beans contain between 0·8 and 2·8 % caffeine, which also contributes to the bitterness of coffee. Since concentrations of caffeine are unaffected by roasting, and decaffeination does not seem to have an effect on acrylamide formation, caffeine will not be addressed in this report. However, some biological and health effects of caffeine and coffee in general will be briefly discussed later in this document (see the section ‘Potential health benefits of coffee in the diet’).
Potential health effects of potatoes, cereals and coffee in the diet
Introduction
The three foods in focus of this review were chosen on the basis of their potential contribution to acrylamide intake, not on the basis of their relative nutritional value. In this context they may be considered quite different in their contribution to a ‘healthy diet’. On the one hand, cereals dominate as sources of dietary energy intake for many populations; for some they also provide the bulk of dietary protein and micronutrients. Eaten in their ‘entire’ form as whole grains they provide a wealth of nutrients and bioactive compounds, the benefits of which are well documented. When refined, cereal flours form the basis of staple foods such as breads and pastas, and although many of the micronutrients, fibre and phytochemicals are removed in the refining process, the resulting flours still retain a high nutritive value. These flours dominate in the bakery industry.
Potatoes represent a carbohydrate source ranking after wheat, maize and rice as one of the most important food crops worldwide. Frequently associated with preferential intake by lower income consumer populations they are nevertheless a nutritious foodstuff low in fat and sodium, but high in potassium and vitamin C. They also are good sources of fibre (especially when the skin is eaten) and vitamin B6. Eaten as a boiled product, they are an excellent component of a healthy diet. However, a large proportion of potatoes are consumed as processed products, especially fried products such as French fries and potato crisps. These high-fat foods contribute significantly both to acrylamide intake (because of the manufacturing process and the focus of this review) but also to dietary fat and energy intake and consequently compromise their ‘healthy’ image.
Coffee is a beverage, which contributes very little to nutrient intake unless consumed with sugar and milk. Nevertheless it is one of the most popular beverages consumed worldwide. The myriad of water and lipid-soluble chemicals present in coffee provide the hedonic properties which make this drink so popular and, as suggested below, may confer a number of health benefits.
The following sections consider the importance of these foods in the diet. The potential health benefits of their consumption are considered in order to arrive at a balanced view on the effects mitigation of acrylamide formation may have on nutritive and health value.
Nutritional role and potential health effects of potatoes in the diet
Potato consumption
Potatoes are tubers – the edible, underground, swollen parts at the distal end of horizontally growing, underground stems or stolons. Worldwide, they are an important non-cereal energy crop. Fresh potato tubers have a much higher moisture content (approximate range 75–85 %) than cereals (14–20 %). Consequently, they are perishable but can be stored up to 8 or 9 months under controlled environmental conditions. Potatoes are sold fresh and as processed products which are dehydrated, canned or frozen and have a relatively long shelf-life. Cook/chill products, for example dishes containing mashed, boiled, baked or par-fried potatoes must be consumed within a few days of manufacture.
The history of the crop is well-documented(Reference Salaman146) and its significance as a major food source is evidenced by its revered position over 1000 years ago in the Inca civilisation of South America and by the devastation of the Irish Potato Famine. In recent years a notable feature has been that the quantities produced, processed and consumed in less developed countries have increased very rapidly, in some cases replacing traditional non-cereal energy root and tuber crops such as sweet potatoes, cassava and yams. Elsewhere on the other hand, the situation has been static or in decline. Currently according to FAO(147), almost 300 million tonnes of potatoes are produced annually. Over a third of this amount is in developing countries, which have shown an increase of about 11 % over the past 40 years [see (Reference Andrzejewski, Roach, Gay and Musser117, Reference Scott148) for a comprehensive analysis]. China is the largest producer (75 million tonnes in 2004) followed by Russia (37 million tonnes); India (25 million tonnes); USA (20 million tonnes). The EU25 produces about 60 million tonnes or about 20 % of world output of which over half are used for human consumption(149). About 10 % are used as seed to plant the next season's crop (the crop is vegetatively propagated from tubers); some specific, high dry matter content types are used for starch production, for example in The Netherlands(Reference Wustman150) and as a feedstock for alcohol production including vodka and bio ethanol as a renewable energy source. Surplus tubers, including potato processing waste are often fed to livestock or discarded.
McCance and Widdowson's the Composition of Foods(151) gives detailed information about the composition of early/new/immature and old/maincrop/mature tubers cooked in different ways and with various additional ingredients. In general, potatoes are a good source of carbohydrate, but have a relatively low energy density. They are virtually fat free and have high contents of vitamins C and B6, magnesium and iron and they are perceived by consumers as an important component of a healthy, balanced diet(152). Recently, the health benefits of including potatoes in the diet have been promoted vigorously by potato processors, packers, retailers and industry support organisations intending to maintaining or increasing market share in the face of competition from other carbohydrate sources and the fashion for low-carbohydrate diets(152). Because of their high carbohydrate content the majority of potatoes and potato products when eaten hot have a high glycaemic index (GI) and glycaemic load (GL). This capacity to elevate blood glucose concentrations has implications for development of type 2 diabetes, cardiovascular disease (CVD) and obesity. As a result there has been considerable interest in research on factors influencing GI of potatoes such as maturity, variety and cooking method(Reference Soh and Brand-Miller153–Reference Henry, Lightowler, Strik and Storey155). Recent work by Henry et al. (Reference Henry, Lightowler, Strik and Storey155), showed variation between seven varieties, with Marfona being the lowest with a GI of 56( ± 13) and Maris Peer the highest at 94( ± 16). Waxy textured varieties tend to produce medium GI values and floury potatoes high GI values. To achieve a low value, a variety would need to have a GI of ≤ 55 and if such varieties can be developed, then they have potential for use in diets where GI can be controlled. Buyken and Kroke(Reference Buyken and Kroke156) advocate the adoption of conventionally boiled, ‘immature’ tubers as part of low-GI diets (although early harvested tubers have higher initial reducing sugar contents which would make them less suitable for processing). In addition, consuming other foods together with potatoes as part of a meal can reduce the overall GI substantially(Reference Henry, Lightowler, Kendall and Storey157). In the home, potato consumers prepare fresh tubers for cooking or use partly or fully processed potato products that undergo heating and/or further cooking to finish off the dish. Some products are served and eaten immediately without any treatment such as crisps, pulped potato and potato dishes in ready-to-eat take-away meals. To some extent, the food value of potatoes and potato products may change because of differences in seasonal conditions, management in the field and in the store and the variety grown although effects on composition and nutritive value are likely to be relatively small. Dry matter content of potatoes changes throughout growth as do the ratios of sugars to starch and also the amount of fibre in the skin. Typically, early harvested, ‘new’ potatoes have very thin skins, low dry matter percentages of about 16 % and high concentrations of reducing sugars compared with tubers harvested at maturity or after storage. In some cases, towards the end of the storage period, sugars will increase as the tubers begin to sprout and the tuber will lose turgidity as it loses moisture. However, it is the way that the fresh potato is prepared and cooked and eaten that will tend to have a greater effect on its food value. Eating cooked tubers with intact skins, such as large, baked ‘jacket’ and small, boiled salad potatoes with ‘set-skins’ increases fibre intake and is considered to be a healthy option. On the other hand, the higher fat content of fried products compared with boiled or steamed potatoes, the type of cooking oil used (particularly with regard to the amount of trans-fats) and quantities of salt in the seasoning and any other additives, particularly in flavoured crisps, potato snacks and French fries, may be considered to compromise the healthy image of the potato. Moreover, inclusion of flavouring components from animal products may exclude these products from certain consumer groups.
Inherently, potatoes are a safe food but they do contain glycoalkaloids, which contribute to flavour, but can be poisonous(Reference Friedman and McDonald158). They play a role in the plants' natural defence against pests such as slugs, wireworms and cutworms. Glycoalkaloid concentrations increase when tubers are exposed to the light, form chlorophyll and turn green so that it is imperative to keep tubers well-covered with soil in the field, or in the dark in storage or to ensure pre-packed potatoes in store display cabinets are sold before the overhead lights cause greening. Green potatoes are usually rejected by the consumer (and often much earlier in the supply chain) or the green tissue may be cut off the tuber and discarded before cooking the remainder. Therefore, the risk to health from glycoalkaloids is small. Possible links between the consumption of tubers infected with tuber blight and the incidence of babies born with Spina bifida and anencephaly to mothers who had consumed blighted tubers, have been mentioned in the literature(Reference Burton159, Reference Ulman, Taneli, Oksel and Hakerlerler160). However, it is difficult to envisage circumstances in which blighted tubers would be eaten by, or fed to, pregnant women. Pesticide residues are also an issue, partly because the potato crop is by far the biggest user of agrochemicals. Of course, crop protection chemicals must be used according to strict regulations to ensure that maximum residue limits (MRLs) are not exceeded, but concerns of many consumers about pesticide residues in food have contributed to the expansion in production and consumption of potatoes and other foodstuffs grown according to ‘organic standards’.
In 2003/04, the average rate of consumption of potatoes in the EU was 76·9 kg/head per year, ranging from 43·7 kg/head per year in Italy to 156·1 kg/head per year in Latvia(149). These figures are based on raw equivalents which are the weight of freshly prepared, cooked tubers eaten plus the weight of the raw equivalent of processed potato products, using the following ratios to convert weights of fresh, raw potatoes to processed products: canned 1:1; crisped 4:1; dehydrated 6·2:1; frozen 1·9:1(161). In 2005 in the UK, excluding Northern Ireland, average consumption was 94·7 kg/head per year but from 1988 to 2005, was fairly constant at between 100 and 110 kg/head per year. Over this period, the trend has been for a decrease in the ratio of fresh to processed consumption. In 1988, the ratio was about 3:1, but by 2005 had reached 1:1 indicating that half of consumers' potato intake was in the processed form. This included products manufactured from about 3 million tonnes of UK-grown potatoes and imported products, mainly frozen French fries from The Netherlands and France equivalent to almost 1 million tonnes of raw potatoes. Over the same period, about a half of consumers' intake was through food service outlets, where ready cooked potatoes are served as a snack or part of a meal outside of the home(162) and these trends are expected to develop globally. In the USA, potato consumption is lower than in many European countries at about 56·3 kg/head per year forecasted for 2006, but almost two-thirds are processed in one form or another. As in Europe, frozen French fries account for the biggest proportion of consumption (42 %), followed by potato chips or crisps (13 %), and dehydrated products (11 %), whilst the consumption of canned potatoes is negligible(163).
Potato tuber quality for the fresh market and for processing
The qualities of potato tubers relate almost entirely to their fitness for purpose, either for potatoes that are sold fresh or used for processing. Hardly any relate directly to the food value but more to the aesthetic properties of the raw material and processed products. Packers and processors have very specific qualities that their suppliers must meet, otherwise the price will be discounted or the consignment rejected. Some of the qualities are similar for both fresh and processing outlets; some are different and some are very specific to a particular process. For fresh tubers – the majority of which are washed before sale either pre-packed or loose – the main criteria relate solely to their appearance. They must be free from, or have very low levels of mechanical and pest damage, disease (particularly the blemishing diseases such as common scab, black and silver scurf, skin spot), sprouting, greening, secondary growth. They must also be of a particular size (e.g. small for salad potatoes; large for baking potatoes) and skin and flesh colour may also be important as is freedom from after-cooking blackening in boiled or steamed potatoes. Organoleptic attributes such as flavour, aroma and texture seem to be less important. However, with the growing interest in gastronomy, this is beginning to change and providing opportunities for the development of niche markets.
Potatoes for processing must also be free from damage, greening and secondary growth but the tuber blemish diseases are much less of a problem because the tubers are peeled prior to processing and the consumer does not see the potato in the raw state. Tuber dry matter content is extremely important because it affects the out-turn of the final product from the raw material and also its quality. At the factory, it is usually determined on the basis of specific gravity of a sample of fresh tubers rather than by oven-drying a sample to constant weight, because results are achieved within minutes rather than hours. For canning whole, new, immature potatoes must have low dry matter contents or they may disintegrate during the canning and cooking process. For fried products, i.e. French fries (often referred to as chips in the UK) and crisps (usually referred to as potato chips in North America), a high tuber dry matter percentage is required: it affects the texture/mouth-feel of the final product; the amount of water that must be driven off during frying and the amount of cooking oil that is absorbed. The latter influences the cost of the process because it determines the frequency with which the cooking oil must be replenished and also the fat content of the fried product, as previously discussed in this report. The amount of fat absorbed may also be influenced by the shape of the French fry (e.g. straight-cut or crinkle-cut), which affects the surface area per unit weight of raw material fried. Internal bruising or black spot (formation of necrotic areas resulting from reactions involving tyrosinase following internal damage) is also a problem close to the vascular ring, particularly for high dry matter processing varieties, which can bruise easily during harvesting and handling because it discolours the product. However, use of less susceptible varieties, careful harvest and handling techniques into and out of store and avoiding cold temperatures during these procedures can alleviate the problem. Green potatoes must also be avoided, especially in crisp manufacture as an unsightly green/purple discolouration with a bitter taste may be produced near the edge of the crisp.
As already discussed, the reducing sugar content is most important because of its involvement in the Maillard reaction that can lead to French fries and crisps that are unacceptably dark in colour. On reception at the processing factory, sugar concentrations of samples are measured and also small-scale test frying is done and the colour of the product is assessed relative to specific colour charts(164). Factors affecting sugar concentrations have already been discussed at some length in this report. Steps can be taken to ensure that reducing sugars in the raw material are at acceptable concentrations to begin with, but the cooking procedures can be adjusted to minimise excessive colouring with samples that have reducing sugar concentrations above the optimum (see the section ‘Summary and conclusions’, Table 3). Reducing sugar content may not be as critical for processors manufacturing products such as roast potatoes, wedges and croquettes which are flash-fried for a short time, than for products that are fried for a longer period such as crisps. Cooking of flash-fried products is finished by baking in the oven either at the consumer's home or the food service outlet, so that the degree of browning achieved is determined after the initial processing stage. With ‘hand-cooked’ brands of crisps, a finished product that is darker than the industry-standard, pale-straw colour seems to be acceptable and so reducing sugar concentration of the raw potatoes used for making them is probably less important than it is for conventionally cooked crisps. This may also be the case for fresh potatoes used to make crisps that are flavoured with dark-coloured ingredients and will mask the colour of the crisps as they come out of the frier. On the other hand, whilst reducing sugar concentrations of fresh tubers are not usually important in the manufacture of dehydrated potato mash or flakes, they may be when the reconstituted product is deep-fried to produce potato-based snacks.
Whilst the Maillard reaction and non-enzymatic browning is of primary concern, enzymatic browning is much less so because steam-peeling prevents it and the time between peeling and cooking is usually too short for the reaction to occur. For freshly peeled and cut chips, where there is a delay in frying, whitening preparations based on sodium metabisulphite as an anti-oxidant could be used.
The potato is a particularly good subject for genetic modification. Several GM varieties have been produced, particularly to provide pesticide-free control of certain pests and diseases. Some have also been modified to increase the protein content with the aim of improving the diets in some developing countries. Production of pharmaceuticals by GM potatoes is also an objective. Whilst this approach could offer potential solutions to a number of problems, there is intense debate and concern about the safety and acceptability of GM foods. Lack of consumer acceptance in Europe and Japan has led to the refusal of the major food service companies to include GM potatoes in their products anywhere in the world. Consequently, none are currently grown or processed commercially. However, China may be more willing to embrace this technology and provide a potential market for GM potato products(Reference Curtis, McCluskey and Wahl165).
Genetic modification may provide a potential solution to the problem of acrylamide in fried potato products. Recently in the USA, the variety Russet Ranger (an alternative to Russet Burbank for French-fry production) has been modified to overcome its susceptibility to bruising and cold-induced sweetening. Concentrations of acrylamide in French fries made from modified Russet Ranger following cold-storage were approximately a third (300–400 μg/kg) of those made from control, unmodified Russet Burbank and Russet Ranger tubers (1000–1200 μg/kg)(Reference Rommens, Ye, Richael and Swords166). As the modification was an all-native DNA transformation method that silenced specific genes and so did not involve insertion of foreign DNA and improved important quality traits, the authors suggest that such intragenic varieties may be more acceptable to consumers than transgenic food crops.
Potato varieties
Solanum tuberosum is the main species grown for consumption in Europe and North America but there are many species. Some of these are used for human consumption in South America and they are also an important resource for breeders to introduce pest and disease resistance and other qualities such as ability to grow at low temperatures, into cultivated types (the Commonwealth Potato Collection is one such resource(Reference Neilson167). There are many varieties of cultivated potatoes available in every country, but in practice a relatively small number dominate the area of production. This is because they are robust, yield reasonably well and are particularly suited to specific uses and markets. Indeed the buyers – the supermarkets and processors – are very specific about the varieties that they will accept and so contractual arrangements between growers and buyers are increasingly common. Some varieties are still in widespread use today that were introduced about a century ago. For example, in the UK, Jersey Royals and King Edwards are still premium varieties and there is currently growing interest in ‘Heritage’ potato varieties. For processing, the varieties Russet Burbank and Yukon Gold from North America are good examples of old varieties. Russet Burbank (1877) is still grown to produce high quality French fries for fast-food restaurants, but it is not a popular variety with growers because it is very susceptible to Late Blight, drought and damage and produces many mis-shapen tubers. However, many relatively newly introduced varieties have been adopted for processing because they have better characteristics than the more traditional ones. The build-up of reducing sugars during low temperature storage has already been mentioned and the practice of reconditioning at higher temperature to condense the reducing sugars is an important technique to consider. Not all varieties will recondition well and so breeders are keen to develop varieties that do not sweeten at low temperature. Once again it is varieties' fitness for processing, or their aesthetic or organoleptic properties if they are to be prepared from fresh, that far outweigh the nutritive aspects. In the UK, a good example of the latter is the recently introduced variety Mayan Gold, which is a new variety of the Phureja species(168). It has a very good flavour and texture and cooks more quickly than tuberosum varieties: it is a favourite of several ‘celebrity’ chefs. Other Phureja varieties seem to be in the pipeline. Vivaldi(169) is another new UK variety, said to have about 25 % lower carbohydrate than other varieties and therefore may be useful as part of a calorie-controlled diet with a lower GL compared with other varieties (see above). Potentially low GI varieties may also have lower reducing sugar contents and contribute either directly, or following further breeding, to less browning during frying or baking provided that the final products were acceptable to the consumer.
Breeding for varieties with longer dormancy is also an important objective as this affects the onset of sprouting and may delay the build up of reducing sugars and the process of senescence-sweetening and decrease the requirement for chemical sprout suppressants during long term storage.
Conclusion
Potatoes are a cheap, readily available, high carbohydrate food and perceived by consumers as being an important component of healthy, balanced meals and diets. The proportion eaten in the ready processed form (and as fried potato products in particular) and eaten outside the home through foodservice is increasing and at a faster rate in less developed countries than in North America and Europe. The concentrations of reducing sugars which are the key factor in the formation of acrylamide can be manipulated by crop agronomy in the field and store, influenced by breeding and managed by adjustments to processing methodology as described earlier in this report. Such approaches are well established and were developed long before the issue of acrylamide in potatoes appeared in media reports in spring 2002(170); the primary objective was to control the browning of fried products rather than the levels of acrylamide per se. None of these measures are likely to be detrimental to the nutritive value of the potato as a food, but of course, reduction of acrylamide levels is a desirable objective and must be explored.
Nutritional role and potential health effects of wholegrain cereal products
Cereal grain consumption
The cereal grains consumed both by humans and animals are the edible seeds of the domesticated members of the Gramineae grass family(Reference Seal, Jones and Whitney171). Worldwide grain production is dominated by wheat and rice, which collectively account for one-third and one-quarter of total grain production, these together with maize are the major cereals(Reference Slavin172). The minor grains are barley, sorghum, millet, oats and rye; non-cereal grains and seeds, which are structurally similar to the Gramineae with relatively similar nutritional characteristics include, amaranth, buckwheat, psyllium and quinoa(Reference Seal, Jones and Whitney171). The relative amounts of grains consumed varies between countries, with quite marked differences between geographic areas best suited to the agronomic conditions required for their cultivation. For example, rice can be grown in water in tropical and subtropical climates, wheat production occurs in temperate zones and rye, which accounts for less than 2 % of world grain production, is an important crop in cooler climates such as those found in Scandinavia and Eastern European countries. Grains are important plant foods as they constitute dietary staples in most diets and are a major source of energy, protein, B vitamins and minerals for the world population(Reference McKevith173). Grains provide approximately two-thirds of the energy and protein intake in the world although, again, exact proportions vary between countries. In the UK, cereal foods provide approximately 30 % of energy, 25 % of protein and almost 50 % of available carbohydrate intakes, and are dominated by wheat-based products such as breads, breakfast cereals, biscuits and cakes. In contrast, in less affluent countries, the importance of cereals increases with many parts of rural Africa and Asia deriving more than 70 % of energy intake from cereal sources(Reference Southgate, Garrow, James and Ralph174). The per capita consumption of rye in countries with high consumption ranges from the nearly 40 kg/year in Belarus and Poland to 10–20 kg/year in the Baltic and Scandinavian countries, Ukraine, Austria, Czech Republic, Slovakia, and the Russian Federation(147). Rye is traditionally used for bread (fresh bread, crisp bread, and thin crisp) made with sourdough containing wholemeal rye flour, water, salt and starter culture(Reference Kujala175). Pumpernickel rye bread, which is more popular in the central Europe, is made of rye kernels, wheat flour and malt(Reference Poutanen176). In addition to bread, there are different types of flours, groats, and flakes for baking, and porridges and breakfast cereals, as well as rye-based Easter pudding and rye-dough covered baked dish containing fish and pork traditionally used in Finland. Modern rye products are rye pasta, rye hamburgers and rye-based snacks.
Cereal grains provide a wide range of nutrients other than energy to the diet, varying somewhat between the different grains. The endosperm, which constitutes approximately 80 % of the grain by weight is a rich source of starch but also contains soluble fibres, protein and considerable quantities of riboflavin and pantothenic acid. The bran, or the protective ‘outer shell’ of the grain provides predominantly insoluble fibre, B vitamins, trace minerals, phytochemicals (such as lignans, tocotrienols and phenolic compounds) and antinutrients (including phytic acid, tannins and enzyme inhibitors). Finally, the germ contains further B vitamins, vitamin E, trace minerals, phytochemicals, antioxidants and lipids(Reference Slavin172, Reference Slavin, Jacobs, Marquart and Weimer177). Examples of how the relative amounts of the bran and germ constituents can differ from one species to another have been described by Seal(Reference Seal178). For example, brown rice has a very low bran content (30 mg/g) compared with maize (around 60 mg/g) and especially wheat ( ≤ 160 mg/g). With the exception of rice, whole grains are high in dietary fibre; wheat is a valuable source of insoluble dietary fibre whilst oats, barley and rye supply soluble fibre to the diet(Reference Seal, Jones and Whitney171, Reference Slavin172, Reference Smith, Kuznesof, Richardson and Seal179). Wholegrain foods contribute significantly to dietary fibre intake and consequently to the intake of many fibre-associated compounds such as lignans, phenolic acids, alkylresorcinols, phytosterols, and some vitamins and minerals. In the Finnish diet rye bread is the most important single food as a fibre source, providing on average 1/3–1/2 of the daily fibre intake of adults. The concentration of individual nutrients in grains is also very variable; for example fat concentrations range from 2·0 g/100 g in whole rye flour to 8·7 g/100 g in oatmeal. For further data on compositional differences between grain flours see Holland et al. (Reference Holland, Unwin and Buss180)
Processing of grains
The majority of grains undergo some processing before consumption to improve flavour, texture, appearance and shelf stability. Grains used for muesli and in some granary breads undergo mild heat treatments which will inactivate enzymes but which are not expected to generate acrylamide(Reference Slavin172). The range of processing techniques used include milling, heat extractions, cooking and parboiling(Reference Richardson181). Ready-to-eat breakfast cereals are also produced using techniques such as flaking, extruding, puffing and shredding(Reference Fast, Fast and Caldwell182). Cereal flours are subjected to yeast or bacterial fermentation during the production of different breads. These processing techniques have a profound impact on the nutrient profile of the product. Refined grains, where the outer layers of the grain are removed during milling, have reduced concentrations of dietary fibre, vitamins, minerals, phytic acid, lignans, phytooestrogens and phenolic compounds(Reference Smith, Kuznesof, Richardson and Seal179, Reference Slavin183). The changes are most significant for nutrients and components found in the bran and germ layers which are stripped from the grain in modern milling processes. The degree of reduction is dependent on the extraction rate, ranging from no reduction in wholemeal flours (100 % extraction, containing all fractions of the grain) to the highest reduction in white flours (approximately 70 % extraction with only the starchy endosperm remaining). Some minerals and vitamins are added to refined flours to compensate for the losses incurred during milling. Processing may significantly influence the concentration and bioavailability of the fibre-associated bioactive compounds in cereals since they are mostly concentrated in the bran-layers of the grain, and are only present at low concentrations in the flour endosperm(Reference Liukkonen, Katina, Wilhelmsson, Myllymaki, Lampi, Kariluoto, Piironen, Heinonen, Nurmi, Adlercreutz, Peltoketo, Pihlava, Hietaniemi and Poutanen184). Concentrations of folate and easily extractable phenolic compounds increase during germination and sourdough baking of rye flours, while those of tocopherols and tocotrienols are reduced and only negligible changes in the concentrations of sterols, lignans and alkylresorcinols are observed(Reference Liukkonen, Katina, Wilhelmsson, Myllymaki, Lampi, Kariluoto, Piironen, Heinonen, Nurmi, Adlercreutz, Peltoketo, Pihlava, Hietaniemi and Poutanen184). Phytate concentrations are also reduced during sourdough baking. The increase in concentration of folate seen during germination of rye grains compensates for the reduction observed during heat processing (extrusion, autoclaving, puffing, roasting), and the final product contains more folate than the native grains.
Health benefits of consuming whole grains compared with refined grains
There is a growing body of evidence, predominantly from epidemiological and cohort studies, demonstrating strong relationships between consumption of wholegrain foods and disease risk. For the major non-communicable diseases such as CVD, type 2 diabetes and some cancers these relationships are strongly inverse; i.e. with increasing whole grain consumption the disease risk is reduced. There are numerous reviews of the literature summarizing these observations. The strongest relationships have been found for CVD(Reference Seal178, Reference Anderson, Hanna, Peng and Kryscio185–Reference Flight and Clifton188) where the reduction in risk of CVD between the lowest whole grain consumers and the highest whole grain consumers is reportedly between 20 and 40 %. Many of the studies reported in these reviews are based on large cohorts from the US and Northern Europe. The large numbers of subjects in the individual studies allows for good statistical interrogation of the data and, in particular, for adjustment for lifestyle and other confounding factors. In the majority of studies, for example, those who consumed more wholegrain foods were more likely to, smoke less, eat more fruits and vegetables, eat less red meat and be more physically active(Reference Seal178, Reference Anderson, Hanna, Peng and Kryscio185). Nevertheless, the relationships hold true when these factors are taken into account, and the effects remain stronger in many cases for whole grains compared with cereal fibre alone. The mechanisms by which whole grains exert this beneficial effect remain unclear, however, for oats, barley and rye the effect may be due in part to the soluble fibre present in these grains. Whole grain rye contains high amounts of soluble arabinoxylans, which can lower serum cholesterol concentration, a known risk factor of CVD. For example, an inverse association was found between the amount of dietary fibre in the diet, to a large extent derived from rye, and CVD in Finnish men(Reference Pietinen, Rimm, Korhonen, Hartman, Willett, Albanes and Virtamo189). The benefit of rye was demonstrated in a dietary intervention during which serum cholesterol, serum total and LDL cholesterol concentrations were reduced during the rye-bread-consumption period(Reference Leinonen, Liukkonen, Poutanen, Uusitupa and Mykkänen190) in hypercholesterolaemic men. The cholesterol-lowering effects of oats have been well documented and a health claim is authorised, both in America(191) and in the UK(192), based on the presence of the soluble fibre, β-glucan. A similar claim for barley has also now been approved(193).
The relationship between whole grain consumption and cancer risk has also been investigated in a number of studies, with similar reductions in risk. The evidence supporting the assertion that consumption of wholegrain foods was associated with reduced risk of cancers was first reported in a review of 40 case–control studies published between 1984 and 1998 from the US and Europe(Reference Jacobs, Marquart, Slavin and Kushi194). For these studies, the pooled odds ratio averaged across all studies was 0·66 (95 % confidence interval, 0·60–0·72), and was in the range of 0·50–0·80 with only breast cancer (0·86) and prostate cancer (0·90) being higher. A similar systemic review of case–control studies conducted using a common protocol in northern Italy between 1983 and 1996 (some of which were included in the Jacobs' meta-analysis) also showed an inverse relationship between frequency of whole grain consumption and risk for cancer(Reference Chatenoud, Tavani, La Vecchia, Jacobs, Negri, Levi and Franceschi195). Although there is a common agreement that a fibre-rich diet containing grains helps to reduce the risk of some cancers, especially those of the lower bowel, the data derived from human and animal studies on the potential of specific cereal products in reducing the risk of cancer is inconclusive. Decreased intake of lignans has been proposed to explain the incidences of many types of cancers(Reference Adlercreutz196), but the observational studies following this suggestion have yielded conflicting results. Using an animal model, multiple intestinal neoplasia (Min) mice, Mutanen et al. (Reference Mutanen, Pajari and Oikarinen197) showed that rye bran was beneficial against intestinal tumorigenesis. However, recently this group has shown that in the same animal model individual plant lignans do not protect against tumour production(Reference Pajari, Smeds, Oikarinen, Eklund, Sjoholm and Mutanen198), so the mechanisms for the possible protective effects remain unclear.
Epidemiological studies have also consistently shown significant inverse relationships between the risk for type 2 diabetes and increased consumption of whole grains. Pooled data from seven prospective cohort studies from the US showed the average relative risk of developing type 2 diabetes was 0·70 comparing the highest and lowest categories of whole grain intake(Reference Liu199). In northern Europe a similar protective effect was observed for Finnish men and women(Reference Montonen, Knekt, Jarvinen, Aromaa and Reunanen200). These studies also demonstrate the inverse association between dietary fibre intake and reduced risk of type 2 diabetes and, with the exception of the Finnish study, they all show no benefit or even harmful effects of refined grain products when they are eaten in place of fats or wholegrain foods(Reference Liu199). Studies in healthy subjects have shown that postprandial plasma insulin responses are significantly lower after the consumption of a whole grain rye bread compared with a white wheat bread, but no significant differences in plasma glucose concentrations were found(Reference Leinonen, Liukkonen, Poutanen, Uusitupa and Mykkänen190, Reference Juntunen, Niskanen, Liukkonen, Poutanen, Holst and Mykkanen201, Reference Juntunen, Laaksonen, Autio, Niskanen, Holst, Savolainen, Liukkonen, Poutanen and Mykkanen202). It is possible that wholegrain rye slows the digestion and absorption of dietary carbohydrates since it has a high content of soluble fibres, especially arabinoxylans. However, the lower insulin response after rye bread consumption was not explained by the amount of fibre because a low-fibre rye bread was shown to reduce the insulin responses similarly to a high-fibre rye bread(Reference Juntunen, Laaksonen, Poutanen, Niskanen and Mykkanen203). Structural properties and differences between rye and wheat breads, rather than the fibre content, may explain the observed findings. A diet containing high-fibre rye bread for 8 weeks improved insulin secretion (measured by an intravenous glucose tolerance test) in healthy individuals and in subjects suffering of metabolic syndrome(Reference Juntunen, Laaksonen, Autio, Niskanen, Holst, Savolainen, Liukkonen, Poutanen and Mykkanen202, Reference Laaksonen, Toppinen, Juntunen, Autio, Liukkonen, Poutanen, Niskanen and Mykkanen204).
The epidemiological evidence that whole grain consumption is of benefit to health is a powerful indicator of a relationship, however such relationships do not demonstrate causality. To date evidence from controlled dietary intervention studies with large numbers of subjects showing clear benefit of increased consumption of wholegrain foods on markers of disease risk are very few, and attempt to describe mechanisms of action, therefore, are speculative(Reference Seal, Brownlee and Jones205). However, many plausible explanations have been proposed including the increased intake of antioxidant substances, bio-active components such as plant lignans, phytooestrogens, soluble and insoluble fibre, phytates and phenolics. Intakes of many of these components have been linked to improved immune function, antioxidant status, endothelial function and blood pressure, tumour suppression, and inflammation. A small number of studies published recently have shown benefit of incorporating whole grains into the diet, although these have used ‘at risk’ subjects. For example, Behall et al. (Reference Behall, Scholfield and Hallfrisch206) showed that wholegrain foods whether high in soluble or insoluble fibre reduced blood pressure in mildly hypercholesterolemic men and women. Similarly, Qi et al. (Reference Behall, Scholfield and Hallfrisch207–Reference Lopez-Garcia, van Dam, Qi and Hu209) showed that intakes of whole grain were associated with decreased concentrations of systemic inflammation in diabetic women. Wholegrain food consumption has also been linked to weight management and obesity control, but most of the evidence is from cohort studies with self-reported weight.
Promoting whole grain consumption
The evidence for improved health with increased whole grain consumption has spawned the development of health claims for use on foods, and to the incorporation of wholegrain messages in healthy eating campaigns. The American Food and Drug Administration (FDA) were the first to approve a health claim based on wholegrain foods in 1999 although this was modified in 2003(210). Health claims in Europe did not arrive until 2002 in the UK(211) and 2003 in Sweden(212). In the UK and the US, wholegrain foods were defined as foods containing >51 % whole grain by weight and >50 % in Sweden. The most commonly used definition of whole grain was produced and adopted in 1999 by the American Association of Cereal Chemists as follows: ‘Whole grains shall consist of the intact, ground, cracked or flaked caryopsis, whose principal anatomical components – the starchy endosperm, germ and bran – are present in the same relative proportions as they exist in the intact caryopsis’(213). Slight modifications of this definition are proposed by the Food and Drink Administration in the US(214) and have been adopted in Australia and New Zealand(215). There is no standardised definition agreed for the UK.
Specific recommendations for whole grain consumption tied to target quantities of consumption currently exist only in the US, where they are embedded in the US Dietary Guidelines for Americans(216). The guidelines give an explicit recommendation for adults to consume at least three ounce-equivalents of whole grain per day, and that at least half of the grains consumed should be whole grains. Currently there are no dietary recommendations for whole grains in the UK, although they now receive specific mention in the Food Standards Agency's Eat Well, Be Well programme(217). Similar advisory recommendations to eat more whole grains now exist in Switzerland and Australia.
Despite the scientific interest in promoting whole grain consumption, and the growing industry drive to promote consumption of wholegrain foods, especially breakfast cereals, consumption levels across Europe and the US remain very low. Data from the US collected in the late 1990s showed that adults consumed an average of only 1 serving (about 16 g) of whole grain per day with only 8 % of the population achieving the target of 3 servings (48 g)(Reference Cleveland, Moshfegh, Albertson and Goldman218). More recent analyses of data from the 1999–2002 National Health and Nutrition Examination Survey once again confirmed that the majority of Americans fell well short of the 2005 Dietary Guidelines for total and whole grain consumption with just 11 % from whole grains compared with the recommended 50 %. Just 4 % of the population met the target of consuming at least half of their grains as whole grains(219). The situation is no better in the UK with about one-third of British adults consuming no whole grain at all and less than 5 % meeting the US target(Reference Lang, Thane, Bolton-Smith and Jebb220). For young people aged 4–18 in the UK whole grain intake is even lower(Reference Thane, Jones, Stephen, Seal and Jebb221). Comparisons between whole grain intake in the UK between 1986–7 and 2000–1 show a decline in intake in this 14-year period(Reference Thane, Jones, Stephen, Seal and Jebb222). Typical consumers of wholegrain foods in the UK tend to be older, from a high socioeconomic group, less likely to smoke and more likely to exercise(Reference Lang and Jebb223). In Finland rye bread is consumed most frequently in rural parts of the country among the lower educated population groups, more frequently among men than women, and more frequently among the old than young(Reference Prattala, Helasoja and Mykkanen224). Finnish men and women consume on average 100 and 66 g of rye bread per day, respectively(Reference Männistö, Ovaaskainen and Valsta225) providing approximately 55 and 36 g of whole grain per day from this one dietary source. Despite this one case of relatively high consumption much work is needed across most of Europe and North America if public health strategies are to achieve the intake levels for wholegrain foods advocated by the scientific community.
Conclusion
The current drive to increase consumption of wholegrain foods presents a problem in the context of acrylamide consumption since without mitigation of acrylamide content any increase in whole grain consumption could potentially result in increased intake of acrylamide. However, the relative disease risk increase associated with increased acrylamide consumption must be balanced against the relative disease risk reduction associated with increased whole grain consumption. For example, take a non-whole grain consumer who adopts the recommendation to consume 48 g of wholegrain per day(216). If this individual consumes this whole grain all in the form of ‘dark rye wholemeal crisp bread’ with an average acrylamide content of 1520 μg/kg (mean of 6 samples, range 1250–1670(57)), assuming a wholegrain rye content of 84 % on a dry matter basis for the rye crisp bread(Reference Seal, Brownlee and Jones205), this would equate to an increase in acrylamide consumption of approximately 87 μg/day. This assumes that this change in intake was an addition to the diet rather than a substitution for a non-whole grain baked alternative. In the case of substitution, the change in acrylamide intake could be very small or indeed result in a reduction in acrylamide intake compared with some foods. The additional ‘risk’ of this consumption is hard to calculate but is likely to be small based on the lifetime exposure calculations described in the section ‘Background’. This would be in contrast to the much greater population health benefits such as reductions in risk of CVD, type 2 diabetes and cancers associated with increased whole grain consumption predicted from epidemiological and cohort data described above which are in the order of 20–30 %. These calculations, and the assumptions therein, need careful consideration and further evidence and research is clearly needed before appropriate health messages can be developed.
Potential health benefits of coffee in the diet
Ingredients in coffee
Despite 20 years of reassuring research, many people still avoid coffee because they worry about its health effects. However, current research reveals that a moderate coffee intake of two to four cups per day is not only safe but may even offer some health benefits. Some of the health effects of moderate coffee intake have been already attributed to chemically characterised coffee ingredients. The substances which, during brewing, dissolve in water to form the beverage are classified as non-volatile taste components. These include caffeine, trigonelline, chlorogenic acid, phenolic acids, amino acids, carbohydrates and minerals. Volatile aroma components formed during roasting include, for example, organic acids, aldehydes, ketones, esters, amines, and mercaptans.
Effect of caffeine
Probably the most widely studied physiologically active substance in coffee is the alkaloid caffeine, also called guaranine or methyltheobromine. Caffeine is a naturally occurring substance found in the leaves, seeds or fruits of more than 60 plants, including coffee and cocoa beans, cola nuts and tea leaves. One cup of coffee, depending on its strength, may contain some 20–100 mg of caffeine. Caffeine acts as a mild stimulant of the central nervous system, helping to reduce feelings of drowsiness and fatigue.
The hypothesis that high doses of caffeine ingestion adversely affects human health has been investigated by Nawrot et al. (Reference Nawrot, Jordan, Eastwood, Rotstein, Hugenholtz and Feeley226) based on reviews of published human studies obtained through a comprehensive literature search. Based on these data, it was concluded that for the healthy adult population, moderate daily caffeine intake at a dose level up to 400 mg per day is not associated with adverse effects such as general toxicity, cardiovascular effects, effects on bone status and calcium balance, changes in adult behaviour, increased incidence of cancer and effects on male fertility. The data reviewed by Nawrot et al. (Reference Nawrot, Jordan, Eastwood, Rotstein, Hugenholtz and Feeley226) also show that only reproductive-aged women and children are ‘at risk’ subgroups who may require specific advice on moderating their caffeine intake. Based on available evidence, it is suggested that reproductive-aged women should consume not more than 300 mg caffeine per day, equivalent to 4·6 mg/kg bw per day for a 65 kg person. Children should not consume more than 2·5 mg/kg bw per day. With a moderate consumption of two to four cups of coffee, the resulting caffeine intake is unlikely to cause adverse effects in healthy adults.
Coffee and reduced disease risk
Latest research has not only confirmed that moderate coffee consumption does not cause harm (Table 9), it has also uncovered possible health benefits. Most of these benefits have been identified through statistical studies that track a large group of subjects over the course of years and match incidence of various diseases with individual habits, like drinking coffee, while controlling for other variables that may influence that relationship. According to recent large epidemiological and population-based cohort or cross-sectional studies, moderate coffee drinking may lower the risk of numerous diseases listed in Table 9.
Diseases for which the consumption of coffee is associated with a significant risk reduction

According to the data published so far, strong evidence exists for a significant reduction of type 2 diabetes, which is predominantly influenced by lifestyle factors and nutrition. In a prospective follow-up study in 10 188 Finnish men and 11 197 women aged 35–74 years without a history of stroke, coronary heart disease (CHD) or diabetes, hazard ratio of type 2 diabetes in participants who drank 0–2, 3–6 and ≥ 7 cups of coffee per day were 1·00, 0·77 and 0·66 in men and 1·00, 0·71 and 0·52 in women, respectively(Reference Hu, Jousilahti, Peltonen, Bidel and Tuomilehto227). The relationship between coffee consumption and risk of CVD, being one of the major late complications of type 2 diabetes, has been examined in a study by Bidel and colleagues(Reference Bidel, Hu, Qiao, Jousilahti, Antikainen and Tuomilehto228). This study was designed to assess the association between coffee consumption and CVD mortality among 3837 Finnish patients with type 2 diabetes. During the average follow-up of 20·8 years, 1471 deaths were recorded, of which 909 were coded as CVD, 598 as CHD and 210 as stroke. The respective multivariate-adjusted hazard ratios in participants who drank 0–2, 3–4, 5–6 and ≥ 7 cups of coffee daily were 1·00, 0·77, 0·68 and 0·70 for total mortality (P < 0·001 for trend), 1·00, 0·79, 0·70 and 0·71 for CVD mortality (P = 0·006 for trend), 1·00, 0·78, 0·70 and 0·63 for CHD mortality (P = 0·01 for trend), and 1·00, 0·77, 0·64 and 0·90 for stroke mortality (P = 0·12 for trend). These results clearly show that, in type 2 diabetic patients, coffee drinking is associated with reduced total, CVD and CHD mortality(Reference Tuomilehto, Jousilahti, Rastenyte, Moltchanov, Tanskanen, Pietinen and Nissinen229). Caffeine, however, is probably not the active coffee component affecting the risk of type 2 diabetes. This has been demonstrated in a recently published study by van Dam et al. (Reference van Dam, Willett, Manson and Hu230) In a cohort of 88 259 US women of the Nurses' Health Study II, associations of coffee consumption and the risk reduction of type 2 diabetes were similar for caffeinated and decaffeinated coffee as well as for filtered and instant coffee.
The risk of colon cancer has been reported to decrease by about 25 %(Reference Tavani and La Vecchia231), that of gallstones by 22 %(Reference Leitzmann, Stampfer, Willett, Spiegelman, Colditz and Giovannucci232) and that of cirrhosis of the liver by 60 %(Reference Klatsky, Morton, Udaltsova and Friedman233). A 29 % risk reduction of having current asthma symptoms have been observed for regular coffee drinkers suffering from asthmatic symptoms when compared with non-coffee drinking patients(Reference Schwartz and Weiss234). Other benefits discussed include a reduction in the risk of Alzheimer's disease(Reference Lindsay, Laurin, Verreault, Hebert, Helliwell, Hill and McDowell235) and Parkinson's disease(Reference Hernan, Takkouche, Caamano-Isorna and Gestal-Otero236) and, at least among a large group of female nurses tracked over many years, fewer suicides(Reference Kawachi, Willett, Colditz, Stampfer and Speizer237).
Coffee intake has also been shown to improve cognitive performance(Reference Klatsky, Morton, Udaltsova and Friedman233) as well as endurance performance(Reference Graham238).
The mechanisms, however, by which coffee consumption may reduce the risk of the above mentioned diseases are still unknown. In some cases, like for the onset of type 2 diabetes, data on different types of coffee(Reference Tuomilehto, Hu, Bidel, Lindstrom and Jousilahti239, Reference Wu, Hankinson, Willett and Giovannucci240) and on different coffee constituents such as caffeine(Reference Greer, Hudson, Ross and Graham241–Reference Lane, Barkauskas, Surwit and Feinglos243), chlorogenic acids(Reference Johnston, Clifford and Morgan244), quinides(Reference Shearer, Farah, de Paulis, Bracy, Pencek, Graham and Wasserman245), and magnesium(Reference de Valk246) affecting glucose metabolism are available from animal studies and human trials. A recently published study by Atanasov et al. (Reference Atanasov, Dzyakanchuk, Schweizer, Nashev, Maurer and Odermatt247) demonstrated an inhibitory activity in vitro of coffee extracts on glucocorticoid induced expression of phosphoenolpyruvate carboxy kinase, a key enzyme of the gluconeogenic pathway, which may result in decreased blood glucose concentrations. Some studies have also demonstrated an increase in plasma antioxidant capacity after coffee consumption(Reference Somoza, Lindenmeier, Wenzel, Frank, Erbersdobler and Hofmann144, Reference Natella, Nardini, Giannetti, Dattilo and Scaccini248). The antioxidants which dominate quantitatively in coffee are chlorogenic acids(Reference Somoza, Lindenmeier, Wenzel, Frank, Erbersdobler and Hofmann144) and phenolic compounds, such as caffeic and ferulic acid(Reference Fujioka and Shibamoto249), whereas also N-methylpyridinium ions have recently been demonstrated to increase plasma antioxidant activity after dietary intake(Reference Somoza, Lindenmeier, Wenzel, Frank, Erbersdobler and Hofmann144).
Conclusion
The results of controlled trials on health benefits of moderate coffee consumption are often conflicting, as they are based on substantially varying study designs using different coffee beverages administered in varying doses. In particular, the results on caffeine are difficult to interpret, as chronic caffeine intake leads to metabolic adaptation(Reference Robertson, Wade, Workman, Woosley and Oates250) which makes it difficult to compare an outcome of short term controlled trials with that of long term epidemiological cohort or cross-sectional investigations. What can be stated about possible health effects of coffee is that there is emerging evidence that, in moderate doses of two to four cups per day, long-term coffee consumption offers some health benefits. The question of whether these health benefits can be improved by applying processing technologies by which the contents of health promoting compounds such as chlorogenic acid or N-methylpyridinium ions can be increased, or by which the contents of harmful compounds such as acrylamide can be lowered, and simultaneously has to be answered in future epidemiological and appropriately designed and controlled human trials.
Modelling the effect of mitigation measures on exposure to acrylamide
Calculation method and data
The scenarios underlying the calculation of exposure were based on consumption and acrylamide concentration data. The database of the Dutch National Food Consumption Survey (DNFCS) has been used as input for the consumption data(Reference Kistemaker and Bouman251). This survey was conducted in 1997–98 and contains weighed food record data from 6250 individuals, aged 1–97 years, on two consecutive days. The concentration data originates from the European Commission's Joint Research Centre (JRC) database(57). For the purpose of this calculation, concentration data from 2002 and 2003 were used, which included ca. 3500 values. The 2002–2003 data were used because these concentrations were assumed to represent the original acrylamide concentrations, before any mitigation measures were applied.
Single food items containing acrylamide have been grouped into 11 food groups with the same properties, average acrylamide levels per food group are listed in Table 10. Grouping is important because only a few food items representing the food group have been analyzed and their acrylamide levels are assumed to represent levels in other food items belonging to the same food group.
Food groups with average acrylamide levels
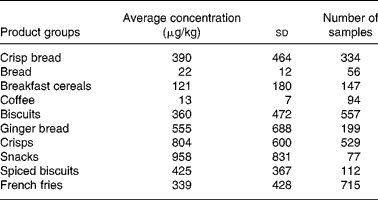
Levels are based on JRC data measured in the years 2002–2003.
The selected food items and mitigation measures applied in the scenario analyses, and their possible effects on acrylamide reduction are summarized in Table 11, while Table 3 provides a full overview of mitigation measures. Most of the mitigation measures presented in the tables were only tested in the laboratory or in pilot settings, therefore the mitigation measures are theoretical for the industrial foods. It is not clearly known whether these percentage reductions will ever be achievable at the level of food processing at a factory scale. In the mitigation scenarios the original acrylamide concentrations of the food items in a food group were decreased by the mitigation percentages. Exposure was calculated after application of the single mitigation measures and in the ‘total scenario’ for all mitigation measures together.
Exposure to acrylamide for different mitigation scenarios, based on labscale experiments

* It has to be stressed that reaction mechanisms leading to storage loss are not an option to date to reduce acrylamide concentration in coffee, since is it directly linked to quality and organoleptic properties and, consequently, consumer acceptability. However, for the purpose of this paper, an estimated degree of potentially achievable decrease is used in the modelling approach in order to assess the impact of acrylamide mitigation in coffee on human exposure and MOE.
All calculations were performed with the Monte Carlo Risk Assessment programme version 4 (MCRA 4.0 – programme, RIKILT – Institute of Food Safety, Wageningen, The Netherlands(Reference van der Voet and de Boer252)). In this programme a consumer is randomly selected from the food consumption database. A consumption day (day 1 or day 2) is selected and the consumption of each relevant food on that day is multiplied with a randomly selected acrylamide concentration per food when assessing acute exposure and an average compound concentration when assessing usual intake. By summing up the intake per day the total acrylamide intake for this consumer on a certain day is calculated. By repeating this 100 000 times, a reliable exposure distribution in a population is achieved, representing the whole range of exposure levels that may occur in a population. A statistical method described by Nusser et al. (Reference Nusser, Carriquiry, Dodd and Fuller253) and Dodd(Reference Dodd254) was built into the MCRA-programme to estimate usual intake. All estimated intakes were adjusted for the individual's self-reported body weight and expressed in ‘μg/kg bw per day’. Intake can be put into perspective by calculating the MOE. The MOE represents the ratio between a defined point on the relevant dose-response curve, the BMDL and the consumer exposure. In this calculation the BMDL of 300 μg/kg bw per day as used before by JECFA was applied(17).
Results of calculation of effects of mitigation of different products
The exposure without any mitigation ranged from 0·4 μg/kg bw per day for the P50 to 1·6 μg/kg bw per day for the P99. The mitigation scenarios decreased the exposure by 1–14 % (Table 11). The largest exposure reduction was obtained in the scenario for biscuits with 69 % lower acrylamide concentrations (Fig. 4). When all mitigation measures were applied simultaneously, the exposure could be reduced by 31–39 %, varying slightly for the different percentiles. The application of all mitigation scenarios resulted in an exposure of 0·27 μg/kg bw per day for P50 and 1·11 μg/kg bw per day for P99.
Acrylamide exposure for different mitigation measures relative to the original exposure for the P50 exposure.

In Fig. 5, exposure is expressed as MOE for the different scenarios. For calculation of the MOE the BMDL of 300 μg/kg bw per day was used. The MOE for the acrylamide exposure before mitigation measures are applied is 690 (P50), JECFA estimated the MOE of the general population at 300(17). The scenarios of the single food groups increased the value of the MOE maximally by one hundred (for the P50), the mitigation measure for biscuits resulted in the largest increase in MOE: 795 (P50). When all mitigation measure scenarios are applied simultaneously, the MOE increases further to 1200 (P50), the MOE of the P90 increased only from 190 to 270.
Exposure expressed as MOE for the original scenario and the mitigation scenarios.

In different scenarios (based on best estimates of lab-scale mitigation measures), the effect of mitigation on the overall exposure levels has been studied. The magnitude of exposure reduction differed between the scenarios. The mitigation measures for biscuits showed the strongest reduction of exposure, while those for crisp bread showed the smallest reduction. This is despite the fact that at the food group level the reduction in acrylamide concentrations due to mitigation measures was greater for crisp bread (80 %) than for biscuits (69 %). This discrepancy is due to the minor contribution of crisp bread to the Dutch diet. Boon and co-workers quantified the possible reduction of exposure in response to mitigation measures applied to ginger bread and potato crisps. They showed that mitigation measures would have a low impact if consumption of those products was low(Reference Boon, de, van, van, Brette and van Klaveren100). FDA showed low impact of theoretical reduction of acrylamide concentrations in coffee, breakfast cereals and snack foods (8–14 %) only French fries without acrylamide would lower the exposure more (30 %)(210). Petersen and Tran(Reference Petersen and Tran255) demonstrated that reduction of acrylamide levels in single product groups to zero, had little impact on lifetime excess cancer risk. Exposure calculations have shown that potato products (e.g. French fries and crisps), breakfast cereals, bread, biscuits, and coffee are the main food groups that contribute to acrylamide exposure. However, specific consumption patterns, which differ between age groups and cultures, determine the importance and order of the food groups(Reference Dybing, Farmer, Andersen, Fennell, Lalljie, Muller, Olin, Petersen, Schlatter, Scholz, Scimeca, Slimani, Tornqvist, Tuijtelaars and Verger2). Each food group contributes between 10 and 30 % to the exposure. Decreased concentrations in one food group will only have a small effect on exposure. Therefore mitigation measures have to be addressed to all of these food groups. When all mitigation measures were applied simultaneously, the MOE increased from 690 to 1180 (P50) and from 160 to 230 (P95). Thus the mitigation measures studied in this paper can nearly double the MOE.
Discussion
Current and future discussions regarding risk management goals will be related to the extent exposure levels can be reduced in a practically achievable way on one hand, and to what extent exposure levels have to be reduced before achieving the standards set for genotoxic compounds. In risk management the ‘as low as reasonably achievable’ (ALARA) principle has been used for environmental contaminants and it might be useful for carcinogenic compounds as well. The ALARA principle is, however, not suitable to prioritise the potential health risk of individual compounds and does not indicate the urgency to take measures. Because of these drawbacks the JECFA and EFSA have introduced the MOE concept. The MOE was first of all used as a tool to compare genotoxic and carcinogenic compounds and as an indicator for priority setting in risk management(17, 21). The calculation in this paper is a refined calculation of the MOE compared with the JECFA calculation. Instead of food consumption estimates based on food balance sheets used by JECFA a more refined food consumption database has been used in this study based on a national food consumption survey using a food record method to determine dietary intake of 6250 individuals more accurately. However, it should be noted that the national food consumption surveys were not designed to accurately reflect intake of a compound such as acrylamide from the diet.
It has also been debated that the MOE is a risk assessment tool. EFSA provides some guidance on the interpretation of MOEs. It considers a MOE of at least 10 000 acceptable which is based on the 100-fold safety factor for inter and intra-species differences and an additional factor of 100 to allow for additional uncertainties in the calculation(21). Most of these uncertainties are related to the underlying biological processes, which are as yet unknown, and which cannot be studied with the current test protocols. Next to biological uncertainties other uncertainties like completeness and representativeness of acrylamide concentration data and food consumption data, as well as the statistical methods to derive the long-term dietary intake from the reported intake might affect the results of the calculations.
For the calculations, it was assumed that the 2002–2003 concentration data reflect the original concentrations in foods at the time dietary data were collected. However, exposure at present may be lower than the exposure used in this calculation as a reference because some mitigation measures have been applied since the discovery of acrylamide. Time trend analysis performed by JRC showed that for some products, such as potato products, acrylamide concentrations decreased from 2002 to 2005, whereas some other products showed no decrease(Reference Wenzl256). It should also be mentioned that the data of 2002–2003 may have not be fully representative because sometimes overheated food was selected and there was a limited number of samples of some of the food items. The analytical methods used to determine acrylamide levels in the early years have also been improved and validated.
The consumption data are derived from a two-day consumption survey using quantitative information from a food record method, which is assumed to be a very accurate method(Reference Hoffmann, Boeing, Dufour, Volatier, Telman, Virtanen, Becker and De257). It is, however, difficult to predict long-term intake on the basis of a two-day food recording method. The Monte Carlo Risk Assessment (MCRA) Software transformed short-term intake information into long-term information using between days variation of intakes of the same individual and between individual variation within the population. This is assumed to be a good statistical approach(Reference Nusser, Fuller and Guenther258). Another point of attention is the representativeness of the population asked to record their food consumption. The average (or total) food intake of food items measured by the Dutch National Food Consumption Survey (DNFCS) of certain food items is, however, in good agreement with market information. For example, market volume data on crisps in The Netherlands (from the European snacks association over 2003; personal communication D. Müller, Procter & Gamble) show an average daily intake of 5·8 g. This resembles well the long term intake estimated with MCRA and consumption data of DNFCS 1997–1998, of 5·5 g/day. However, the calculations are made for the Dutch situation and mitigation measures may have a different impact on exposure in other countries.
Another uncertainty lies in the linkage between the analyzed and consumed food items; the food group classification used; and the assumption that the mitigation measures developed in a single food item applies to the whole food group. Some of these uncertainties can be studied by conducting uncertainty analysis(Reference Dybing, Farmer, Andersen, Fennell, Lalljie, Muller, Olin, Petersen, Schlatter, Scholz, Scimeca, Slimani, Tornqvist, Tuijtelaars and Verger2, Reference Boon, de, van, van, Brette and van Klaveren100, Reference Klaveren, Boon, de Mul, Skog and Alexander259).
The calculations of exposure highlighted in this paper give an impression of the theoretical reduction in exposure. However, some comments have to be made about the implementation of the mitigation steps. As stated before, the majority of the mitigation measures used in the scenarios have been developed on lab-scale and up-scaling to industrial scale has yet to be done. The reduction in reality might therefore be lower than calculated in this section. Secondly, product quality is affected by the mitigation steps and therefore, implementation requires further development of the techniques to produce products with good quality that are accepted by consumers. Finally, mitigation measures may increase concentrations of other compounds with negative health effects. In the next section we will try to quantify a possible side effect of a mitigation measure in a scientifically sound manner.
Risk–benefit modelling of acrylamide mitigation measures
Mitigation measures have shown to change product characteristics(Reference Dybing, Farmer, Andersen, Fennell, Lalljie, Muller, Olin, Petersen, Schlatter, Scholz, Scimeca, Slimani, Tornqvist, Tuijtelaars and Verger2, 3). These changes in product characteristics may have health, quality or nutritional implications(3). Potential side effects that have been described in the CIAA Toolbox(3) and earlier in this paper are (i) increased fat content resulting from lower frying temperatures and longer frying times of potato products; (ii) increased sodium content as a result of use of sodium carbonate; (iii) lower bran content as a result of refined flour use; and (iv) increased 3-MCPD in cereal products as a result of different mitigation measures(Reference Hamlet, Jayaratne and Morrison260). Furthermore, yet unknown changes are expected in Maillard reaction products, which may have negative or positive health effects(Reference Dybing, Farmer, Andersen, Fennell, Lalljie, Muller, Olin, Petersen, Schlatter, Scholz, Scimeca, Slimani, Tornqvist, Tuijtelaars and Verger2, 3). CIAA put forward that for any proposed mitigation measure, a risk-risk or risk-benefit evaluation should be carried out to avoid creating potentially larger risks(3). However, given the current state of the knowledge it is difficult to assess risks v. benefits in a scientific sound manner(24). As an example, in this paper we will quantify the reduction of acrylamide exposure levels by using sodium bicarbonate as a baking agent. The decrease of acrylamide exposure levels will be quantified against a possible increase in sodium intake.
Method and data
Food consumption data as described in the section ‘Potential health effects of potatoes, cereals and coffee in the diet’ were used. Acrylamide concentration data has been described in Table 10. The sodium data are available for all consumed products from the Dutch Food Composition Table 1996, including the 2003 update(261). Not only are sodium or acrylamide concentration data for biscuits and ginger bread relevant, but also the concentration of sodium and/or acrylamide in all other food items. The effect of the mitigation measures on acrylamide concentrations and the assumed magnitude of increased sodium intake are summarized in Table 12. The Dutch National Food Consumption Survey (DNFCS) is used as input for the Monte Carlo Risk Assessment (MCRA). First calculations are done separately for acrylamide and sodium using MCRA software-release 4.0(Reference van der Voet and de Boer252). Based on the long-term estimates of the individuals an additional simultaneous exposure model (risk-benefit model) has been developed. The model quantifies the simultaneous distribution of the long-term average daily exposure to acrylamide and sodium. The model considers the total dietary intake, and it is used to study effects on the balance between acrylamide and sodium exposure following the mitigation measure. The exposure levels for both acrylamide and sodium are modeled using a bivariate lognormal distribution. In a last step probabilities for exposure in predefined classes are estimated using Monte Carlo simulation(Reference van der Voet and de Mul262). The classes for sodium consumption are based on sodium amounts used in epidemiological studies to study effect of sodium on blood pressure. These intervention studies defined the exposures; low (3·5 g salt, equals 20 mg sodium/kg bw per day for a person with an average body weight of 65 kg), moderate (6 g salt, equals 35 mg sodium/kg bw per day) and high (9 g salt, equals 53 mg sodium/kg bw per day) salt intake in relation to blood pressure(Reference Sacks, Svetkey, Vollmer, Appel, Bray, Harsha, Obarzanek, Conlin, Miller, Simons-Morton, Karanja and Lin263, Reference Melander, von, Frandsen, Burri, Willsteen, Aurell and Hulthen264). The exposure levels are used to create exposure classes in which the sodium exposure in this calculation was classified (Table 14), additional to these classes a class below the 10 mg and one above 55 mg/kg bw per day were defined to cover all exposures in the population.
Acrylamide reduction after lab-scale experiments with coincidental side effects

Results
Table 13 reports the change in overall acrylamide and total sodium exposure concentrations before and after mitigation. The mean overall acrylamide exposure decreased from 0·41 to 0·31 μg/kg bw per day and mean sodium intake increased from 42 to 44 mg/kg bw per day after mitigation (Table 13). Sodium intake of 44 mg/kg bw per day approximates a daily salt intake of 7·2 g. In Fig. 6 the simultaneous exposure to acrylamide and sodium before and after mitigation measures are plotted for each simulated individual.
Mean acrylamide and sodium exposure before and after substitution of ammonium bicarbonate with sodium bicarbonate as a theoretical mitigation scenario

Simultaneous exposure to acrylamide and sodium in (a) original scenario and (b) after usage of sodium as a baking agent in cookies.

After mitigation the exposure to acrylamide is shifted down and the exposure to sodium is shifted up (Fig. 6). Table 14 gives a condensed view on the change in exposure levels before and after mitigation. The mitigation measures caused a small decrease in the number of persons in the low sodium exposure class (10–25 mg/kg bw per day) and the average exposure class (25–40 mg/kg bw per day) and a small increase in the high exposure classes (40 to >55). For acrylamide, the strongest increase of the number of persons was in the 0·1–0·2 μg/kg bw per day exposure class. A relative decrease was found in the 0·5–1 μg/kg bw per day exposure class.
Percentage of consumers in different exposure classes for sodium and acrylamide before and after mitigation

The mitigation measure changed the size of the contribution of certain food groups to acrylamide and sodium exposure. For acrylamide exposure the contribution of biscuits and ginger bread decreased after mitigation from 22 to 7 %, whereas for sodium exposure the difference before and after mitigation was small (Table 15).
Ranking orders of products contributing to acrylamide and sodium exposures before and after mitigation

Discussion
The results from the risk-benefit exposure calculations have to be weighed, i.e. put into perspective, to complete the risk-benefit analysis. Useful concepts for the ‘risk-benefit weighing’ have been proposed(265, Reference van Kreijl and Knaap266). But further development of risk-benefit analyses is an issue of scientific debate and further research projects have started or will be proposed in the future(24, 267–269). Relevant issues in these projects are dose-response modelling, how to make use of the Disability Adjusted Life Years (DALY)-concept(Reference Havelaar and Melse270) and how to integrate exposure and effect modelling. Comparing the acrylamide exposure with toxicological reference values and sodium exposure with nutritional reference values can be a first step.
Sodium exposure can be compared to some reference values, although no upper intake level was available. Mean daily sodium intake in Europe ranges from 3 to 5 g sodium (8–11 g salt), which are in excess of the dietary needs of 1·5 g sodium per day (4 g salt per day or 23 mg/kg bw per day). The average sodium intake in this calculation was 2·7 g per day (6·8 g salt per day). Despite the large amount of studies on effect of salt neither the European Commission's Scientific Committee on Food nor EFSA have established upper intake levels for sodium or salt, due to data shortage(271). Several countries like US, UK, Germany and The Netherlands advise a maximum intake level of 6 g salt per day to reduce the risk of stroke and CVD, which is a target level, not an upper level(Reference Jebb, Aggett, Mac Evilly and Lincoln272). The major association between sodium intake and negative health effects is elevated blood pressure. Several studies showed that a reduction in sodium intake could reduce blood pressure. In epidemiological studies individuals were put on diets reduced in salt to quantify the effect of sodium on blood pressure. The magnitude of reduction of blood pressure appeared to be dependent on the starting blood pressure and the level to which it is decreased. Cook et al. report a 1·2 mmHg decrease in blood pressure after a reduction of salt intake of 14 mg/kg bw per day (mean bw 65 kg)(Reference Cook, Cutler, Obarzanek, Buring, Rexrode, Kumanyika, Appel and Whelton273). Sacks et al. observed a decrease in blood pressure of 2·1 mmHg after reduction of sodium intake from 53 to 35 mg/kg bw per day and a decrease of 4·6 mmHg after reduction of sodium intake from 35 to 23 mg/kg bw per day(Reference Sacks, Svetkey, Vollmer, Appel, Bray, Harsha, Obarzanek, Conlin, Miller, Simons-Morton, Karanja and Lin274). It is debatable whether the effect observed is solely attributable to sodium or that other nutrients influence the observed effect as well. Adrogue and Madias observe that most of the individuals with a sodium intake above 35 mg/kg bw per day are normosensitive(Reference Adrogue and Madias275).
Epidemiological studies indicate an association of elevated blood pressure with increased risk of morbidity and mortality from CVD, there are however inconsistencies in the results from different studies. Cook et al. reported that a reduction of 2 mmHg in diastolic blood pressure would result in a 17 % decrease in the prevalence of hypertension, a 14 % reduction in the risk of stroke and transient ischemic attacks, and a 6 % reduction in the risk of CHD(Reference Cook, Cohen, Hebert, Taylor and Hennekens276). Cohen et al. reported a beneficial effect of reduction of high sodium intake to moderate sodium intake on CVD. However moderate to low intake did not lower the risk further or provide an additional benefit. This lack of effect may be explained by other dietary factors, hormonal differences or a J-shaped dose-effect-curve(Reference Cohen and Alderman277).
In this study we calculated an increase of 0·5 % in the number of people in the sodium exposure class 40–55 mg/kg bw per day and an increase of 0·8 % in the number of people in the class >55 mg/kg bw per day. The latter class being in the range where Sacks et al. observed effects on blood pressure.
The calculations performed in this study are related to the Dutch population in general. No subgroups were identified. It has been reported that overweight persons might be more sensitive to the effect of sodium on blood pressure(Reference Tuomilehto, Jousilahti, Rastenyte, Moltchanov, Tanskanen, Pietinen and Nissinen229). The number of overweighed persons in the food consumption database was relative small to justify a separate risk-benefit analyses.
Table 15 shows a very limited contribution from biscuits and ginger bread to the overall sodium intake. Therefore the focus of a reducing-salt-intake-campaign would probably not be on these products. It should also be noted that a possible increased intake due to acrylamide mitigation measures might be compensated for by sodium reductions in other products. Another option to prevent increase of sodium concentrations in foodstuffs due to the use of sodium bicarbonate, might be adding less salt in the baking process (personal communication D. Müller, Procter & Gamble).
This example demonstrates that the risk-benefit model can calculate a simultaneous change in exposure levels of two compounds and that these types of models can be applied to judge the impact and effect of a mitigation measure. Further elaboration should be given to the dose-response relationship of both sodium and acrylamide and their effect on health. Once a clear dose-response curve can be established, and if current intake levels are within the range of the dose-response relationship, one can start to quantify the health impact of a change in intake of sodium or acrylamide in terms of health impact (e.g. Disability Adjusted Life Years). An increase in cancer incidence was estimated for dietary acrylamide exposure based on a linear extrapolation concept using data of high exposure levels in animals(8). However, it is also recognised that linear extrapolation is a worst-case assumption and the human body might be able to repair possible DNA damage at actual exposure levels(Reference Dybing and Sanner278). No indication has been observed from epidemiological studies of increased incidence of cancer as a consequence of acrylamide intake by humans(Reference Rice6).
This risk-benefit analysis showed that this mitigation measure to reduce acrylamide was successful, however it resulted also in a small increase in sodium exposure. A higher sodium exposure is related to higher blood pressure, and a higher blood pressure is related to an increased risk of CVD. In several countries campaigns are launched or are running to reduce the use of salt by industry and consumers. Increasing salt intake by changing food processing appears to be undesirable. It is however not clear how risk managers should weigh the effect and the overall impact and public health consequences of the increase of intake of sodium against the societal and scientific pressure to reduce acrylamide exposure in food. Risk–benefit modelling may help to quantify the change in exposure levels and inform the scientific debate.
Discussion, conclusions, gaps in knowledge
Since the discovery of the formation of acrylamide in a broad variety of heated foods, numerous exposure assessments have confirmed the initial exposure calculations, done by the FDA and the Swedish authorities, in different national food intake scenarios throughout the US and various European countries(Reference Dybing, Farmer, Andersen, Fennell, Lalljie, Muller, Olin, Petersen, Schlatter, Scholz, Scimeca, Slimani, Tornqvist, Tuijtelaars and Verger2, 279). Although the overall average and high intake human exposures are similar in different countries, the contributions of acrylamide exposure through different foods varies considerably, not only because of the high variability of acrylamide concentrations in foods (within and across food categories), but, as importantly, because of the different contributions of different foods to the overall human diet, which is impressively documented by the contribution of, for instance, coffee to the overall acrylamide intake in the US (7 %)(279) as compared to some European countries (40 % in Switzerland and Sweden)(280, Reference Svensson, Abramsson, Becker, Glynn, Hellenas, Lind and Rosen281). In addition, the example of coffee also demonstrates the importance of the contribution through different foods in different target consumer groups, with coffee likely being of little importance in the younger age groups, thereby increasing the relative importance of, e.g., cereals to the overall dietary exposure. Consequently, different mitigation measures in the different acrylamide containing foods may impact the human intake to different extent. The requirement for reducing the human intake should also consider the identification of target consumer groups that may be potentially at risk through acrylamide food exposure, in order to identify foods in which reduction measures have the highest impact on exposure minimisation, and where measures to reduce acrylamide would need to be pursued with highest priority.
JECFA's evaluation of acrylamide in 2005(17) newly applied the concept of MOE also to genotoxic carcinogens, this approach was also adopted in the EU(Reference O'Brien, Renwick, Constable, Dybing, Muller, Schlatter, Slob, Tueting, van, Williams and Wolfreys23, Reference Barlow, Renwick, Kleiner, Bridges, Busk, Dybing, Edler, Eisenbrand, Fink-Gremmels, Knaap, Kroes, Liem, Muller, Page, Rolland, Schlatter, Tritscher, Tueting and Wurtzen282). It is the present consensus in the acrylamide risk assessment, that the MOE of acrylamide is low for a compound that is considered to be both, genotoxic and carcinogenic. It is therefore not possible at the moment, to define safe levels of exposure, and food limits have not been established. Indeed, in view of the information available on acrylamide toxicity, it is unforeseeable at present whether ongoing or future research will change this situation. JECFA's recommendation to continue efforts to lower the human acrylamide intake will most likely be maintained.
It is clear that acrylamide is formed during heat processing of foods rich in the precursors asparagine and reducing sugars, under specific conditions (temperatures above 120°C, low water activity, etc.). It is also clear, that simply avoiding heating is by no means a solution to the problem. Therefore, any technological options to lower acrylamide formation in food has to balance the maximum desired effect (microbiological safety, taste, flavour) against a minimum undesired effect (acrylamide formation) or the introduction of other compounds that may have negative health consequences.
In the current paper, all measures published in the scientific literature and by the Confederation of the Food and Drink Industries in the EU (CIAA) to influence acrylamide formation are reviewed, ranging from agronomy through pre- and post-harvest treatment to heat processing and final preparation of the most important foods contributing to acrylamide intake, namely potatoes, cereals and coffee. The different sections summarise options to reduce acrylamide and highlight different approaches, including background and limitations, available for the different foods, and potential levels of reduction are calculated. The present paper finally makes an effort to quantify by probabilistic modelling the impact of currently published mitigation measures on the human acrylamide intake and MOE, using the European acrylamide database as a source for individual food concentration data and food intake data of the Dutch population. At the same time, an attempt is made to calculate the increased intake of a potential risk factor, salt, that is increased when replacing the ammonium salt of a leavening agent (ammonium bicarbonate) by its sodium salt in baking of cookies in order to minimise acrylamide.
The three food groups considered here, potatoes, cereals and coffee, comprise a big variety of very traditional foods that are consumed regularly and, partially, at considerable amounts. Some individual foods with low acrylamide concentrations, e.g. coffee, are consumed regularly at a certain volume, thereby contributing to a continuous acrylamide intake, while others with very high acrylamide concentrations, such as ginger bread, are consumed only occasionally, restricted seasonally, or by certain consumer groups, but still contribute a lot, albeit less constant, to acrylamide intake. This variability in food concentrations and intake levels makes it difficult to precisely model acrylamide exposure throughout a population and this is also different for different populations.
Another level of complexity is added by the fact that these foods are only partially industrially produced staple foods, but are to a significant amount prepared in the home, according to very individual preferences, or made in restaurants and catering services. The long history of use (cooking and eating habits) and cultural grounding of many basic foods for decades or even centuries will make it difficult to convince consumers of changing home cooking or eating habits to reduce acrylamide intake, even more so if they are asked to make compromises on flavour, taste or appearance.
Pre- and post-harvest effects
Potatoes, cereals and coffee are very different materials at all levels of cultivation, composition and processing. The only unifying characteristic is the occurrence of the acrylamide precursors asparagine and reducing sugars, and that the foods of concern made from these materials are subjected to a minimum of heat under certain conditions. The different concentrations in the raw material determine which of the precursors is the limiting factor, and where intervention with the raw material could possibly have an effect.
For potatoes, three main interacting components were identified: genetics, physiological age at harvest and storage conditions have a strong influence on the concentrations of reducing sugars in the tuber. Strong and clear recommendations concerning these components potentially allow for management of precursors at the raw material state to a certain extent.
Indeed these already exist, and were implemented originally primarily for control of the fry colour of processed products. Most potatoes used for French fry and crisp manufacture are grown on contract to the processors because tubers with the required specifications are rarely available on the open (‘free-buy’) market. Contracts between the processors and growers specify the variety (genetic component) to be grown and the concentrations of reducing sugars in the tubers that are acceptable on delivery at the factory (and other characteristics as described in the section ‘Concentrations of reducing sugars in the tuber (pre-harvest)’). Technical advice on crop management, harvesting (physiological age component) and storage (storage conditions' component) is also given to help producers to ensure that the contractual requirements for tuber quality are achieved. Failure to meet the quality requirements may result in the load being rejected unless the cooking process can be modified to make them usable (for example if reducing sugar concentration exceeds the threshold), although the price paid to the grower will be lower. Recently, a range of best practice recommendations focusing specifically on the reduction of acrylamide aimed at producers and processors (and also retailers, caterers and consumers) has been drawn up involving a number of approaches(3).
Unlike potatoes, cereals and coffee are stored as dried seeds, being metabolically more or less inert, offering no practical interventions at the storage level. For cereals, nitrogen fertilisation is the only management option to influence the concentration of asparagine. Therefore the selection of varieties low in asparagine, grown on sites with low nitrogen regime offer a potential to control precursors on the raw material level.
An advantage for both potatoes and cereals is that potential interventions can be implemented from one season to the next, since the crops are annual plants. This is not the case for coffee plants that are productive for more than 20 years. The first coffee cherry harvest of young plants is possible at the age of 3–5 years. In addition, cultivation conditions are very specific and restricted to certain climatic conditions, making the implementation of interventions concerning agricultural practice a difficult and lengthy process. However, some post-harvest practices were reported to interfere with the free amino acid content of green coffee beans, which might offer the opportunity for further investigations.
Gaps of knowledge
● Seasonal variability and weather conditions are unpredictable factors, and a source of a certain unavoidable variability in potato tuber quality and sugar content.
● As for potatoes, seasonal variability is a factor of uncertainty in cereals, and soil composition is a factor not entirely under control of the farmer. It remains to be seen if low nitrogen fertilisation which interferes with crop yield would be acceptable to the producer.
● Very little information is available on possible interventions regarding the cultivation, harvest and storage of coffee. Post-harvest processing such as washing and drying may be the only point of intervention and a subject for further study.
Effects of food processing technologies
Although several options to mitigate acrylamide have been identified (by the CIAA, the HEATOX project and research laboratories), little information is available on the practicability of the measures in industrial processing. Most of the trials were done at laboratory scale, at most at pilot plant level. However, it appears that it is impossible to eliminate acrylamide entirely from foods, and effects on consumer acceptance cannot be anticipated yet.
The use of asparaginase is very efficient in certain potato and cereal products that are prepared from doughs or slurries, and the enzyme has recently received GRAS status in the US. It has to be stressed that, even though asparaginase appears to be a very straightforward intervention, the appliccability of asparaginase is limited to specific products, and even total elimination in one product will not largely impact a whole food category or, consequently, human exposure. The use of asparaginase, however, demonstrates that even if asparagine is not the limiting precursor in potatoes, the complete removal of the non-limiting factor can still be effective. Nevertheless, the use of the enzyme has to go through the usual approval process with authorities, and additional constraints will be availability and cost of the enzyme.
The different interventions have been analysed separately to date, and often in model products. They are not super imposable, and combinations of mitigation measures have to be tested and verified under industrial conditions both with respect to achievable acrylamide reduction and possible quality impact and the potential formation or addition of compounds with negative health consequences.
Cereals are a very broad and diverse group of innumerable products, including breakfast cereals, breads, cookies, etc. Replacement of ammonium bicarbonate by sodium bicarbonate has raised the concern of increasing salt intake, which is considered a potential health risk. This and suggestions such as to use more refined flours in place of whole grains (with less acrylamide, but also less fibre) in processing of cereals have to be assessed in the context of public health strategies aimed at reducing sodium intake and increasing wholegrain products for health benefits.
Interventions in coffee have been largely unsuccessful to date due to important changes in organoleptic properties when changing the roasting conditions. Dark roast coffee contains less acrylamide than light roast coffee due to destruction of acrylamide during the roasting. This is reflected in the range of acrylamide content on the European market with lower acrylamide concentrations in Mediterranean countries where dark roast coffees are preferred, as compared to higher acrylamide concentrations in coffees in northern European countries where lighter roast coffees are preferred. This market range, however, cannot be used as a mitigation scenario, unless consumers are educated to drink darker roast coffee.
Furthermore, coffee is a single ingredient product and additives cannot be used. Coffee varieties from different origins are usually blended to obtain a constant product quality, therefore any measures in one part of the blend would be diluted in the final blend. The global sourcing of the green beans, long lifetime and special climatic needs of the coffee trees are further limitations to implement changes rapidly. Applying processes which are based on the reaction mechanisms causing the loss of acrlyamide during storage are currently the only imaginable options to lower acrylamide, but is certainly a quality issue and cannot be used as a measure to lower acrylamide to date. On the other hand, epidemiological studies on coffee consumption in general are more and more often linked to beneficial health effects with respect to diabetes, cancer, and a variety of other diseases (see below).
Gaps of knowledge
● Although several interventions have been identified, they are often specific to particular products with certain processing characteristics, and a generalisation of measures over a whole food category is therefore impossible.
● Most measures to date still need to be evaluated with respect to the impact on product quality and industrial practicability.
● Heat processing of foods is usually strongly adapted to product characteristics such as appearance, taste, flavour and texture which are strongly influenced by consumer acceptability and preferences. Any compromise on one of these factors should be avoided, because any mitigation is useless if the consumer does not enjoy (and subsequently does not buy) the product anymore.
Health effects of potatoes, cereals and coffee in the diet
Potatoes are a cheap, readily available, high carbohydrate food perceived by consumers as an important component of a healthy, balanced diet. A big proportion of potato derived foods is prepared by consumers in the home, albeit the consumption of pre-processed potatoes or potato foods eaten outside the home is increasing, rendering the processing of potatoes partially ‘out of control’ of the food processing industry. Consumption of potatoes has recently come under attack due to its high glycaemic index that may lead to elevated blood glucose concentrations and potential implications in development of obesity, type 2 diabetes and CVD(Reference Henry, Lightowler, Strik and Storey155). The wholesomeness of potatoes is clearly related to the preparation method. French fries and potato crisps are not generally perceived as healthy foods and rather have a reputation to be junk food, but fresh potatoes that are boiled or steamed usually are.
Epidemiological evidence for health benefits of wholegrain consumption has led to initiatives to advocate increased consumption of wholegrain foods(Reference Seal178). However, consumption levels of wholegrain products across Europe and the US remain low from the point of view of public health authorities(Reference Lang and Jebb223). These initiatives would be contradicted by recommendations to promote the use of refined flours for the sake of lowering acrylamide in processed products by reducing raw materials high in asparagine. Such statements clearly have to be made with care and only based on sound scientific evidence in order not to contradict current public health initiatives.
Coffee contributes substantially to acrylamide intake, depending on the target country and population. Coffee consumption has long been associated with increased risk factors for CVD. Current research, however, indicates that for the healthy adult population, moderate coffee consumption is not associated with adverse health effects. On the contrary, recent epidemiological studies have identified potential health benefits in the prevention of chronic diseases such as type 2 diabetes and Parkinson's disease [e.g. (Reference Higdon and Frei137) for a recent review]. The mechanisms by which coffee consumption can reduce the risk of certain diseases has only started to be studied in more detail.
Gaps of knowledge
● Ongoing research and epidemiological studies will further shed light on the health benefits and risks of the overall human diet as well as particular components of the human diet, particularly with respect to worldwide growing public health concerns linked to obesity, physical inactivity, diabetes and CVD.
Modelling the effect of acrylamide mitigation on exposure
Since 2002, many studies have been performed on the mechanisms of formation and mitigation of acrylamide in various foods, and available measures are regularly being summarised and updated by the CIAA in their toolbox approach and pamphlets, in order to provide industry (and small and medium sized enterprises (SMEs) with scientifically sound tools and to facilitate the implementation of mitigation measures into industrial processes. However, one of the most important questions, namely what is the effect of these measures, once implemented, on human acrylamide exposure and actual health risk, has not been addressed thoroughly to date. Consequently, this review was compiled in order to evaluate all the currently published efforts to lower acrylamide in the most important foods in a broader perspective, by assessing the impact of various mitigation measures on actual human exposure. This approach does by no means claim to be quantitatively exact, but should demonstrate the complexity of the effort, in order to help, in the future, to better define and prioritise areas of research need and to design more targeted methodologies.
The first obstacle in estimating acrylamide exposure is its wide distribution at highly variable concentrations in a broad variety of foods. Thus any exposure assessment has to consider all sorts of foods, consumed at low or high amounts, regularly or only occasionally. The food categories designed by the EU or national authorities dietary intake surveys are not necessarily optimised for estimating acrylamide exposure, and many categories will contain both foods that contain acrylamide and foods that do not at all contain acrylamide. In this approach, early acrylamide data were taken from 2002 to 2003, in order to ensure that potential mitigation measures had not yet been implemented. A disadvantage of using these early data is that some food categories, particularly roast and ground coffee (~90 samples), were only little represented at this stage. In addition, analytical methods were considerably improved after this period with respect to precision, sensitivity and food matrix, adding some uncertainty to the early data.
However, as a starting point, these data were applied to food categories as a whole as defined in the Dutch food intake database used here.
Most mitigation scenarios reviewed in this paper are derived from laboratory scale studies, at most pilot plant studies. Trials in industrial settings have not been published to a large extent. Therefore, the figures for potential mitigation used here have to be considered rather optimistic, and their implementation in reality needs to be established, validated and followed in the coming years by monitoring products on the market.
The calculated average and high exposures (without mitigation) are very similar to previous estimations in different European countries and the US, confirming the correctness and reliability of the basic modelling of human exposures. Individual mitigation effects (meaning the reduction is achieved in the entire category across products and brands) reduced the exposure of the average consumer (0·44 μg/kg bw per day) by 1–14 % with an acrylamide reduction of 20 % in coffee being the least effective, and 69 % reduction in biscuits being the most effective (13·7 %). Theoretically, when all mitigation scenarios were applied simultaneously, the exposure was reduced by 39 and 31 % for average and high consumers (99th percentile), respectively. This scenario, however, would only apply when all foods in the respective categories would reach similarly lowered acrylamide concentrations. The relative mitigation effects are much less in the high consumers (P95 and P99 percentile) for all individual categories as well as for the overall scenario.
For the different exposure scenarios, the MOE was calculated based on the BMDL of 300 μg/kg bw per day. The MOE was 700 for the average consumer. The scenarios of the individual food groups increased the value of the MOE by 100–800 at most. When all mitigation measures were applied simultaneously, the MOE increased further to 1150. As for the exposure calculations, the effects for the high intake groups were rather small.
In conclusion, taking into account the uncertainty and presumably optimistic assumptions in the calculations presented here, the impact of mitigation measures on human exposure and MOE is expected to be relatively small, particularly when looking at high intake consumers and is still very far away from the 10 000 recommended by JECFA and the EFSA.
Gaps of knowledge
● Mitigation measures applied are mostly laboratory scale, and reductions are unlikely to be translated 1:1 into factory scale.
● Individual mitigation measures are applicable to certain products, but not necessarily to a whole category of foods.
● Similarly, a food category likely consists of different foods, to which individual mitigation strategies are applicable and also it is likely that a fraction of foods for which no mitigation measures are available.
● This causes uncertainty in the exposure assessment and consequently in the calculations of MOE.
Risk–benefit considerations of acrylamide mitigation measures
It has been repeatedly emphasised that changing processing to lower acrylamide concentrations in foods may cause the formation of other, unknown, or potentially undesirable compounds. The undesirable effect of mitigation can equally be the loss of a beneficial effect or nutritional value. Thus, there is a need to consider and balance the potential risks of undesirable compounds (or a decrease in benefit) against the (however still putative) risk(s) of acrylamide exposure.
In this paper, the increased sodium intake as a potential risk factor corresponding to acrylamide mitigation has been estimated. Therefore, an additional, simultaneous exposure model has been developed which quantifies the distribution of the long-term average daily exposure to both acrylamide and sodium. Mitigation of acrylamide in biscuits and ginger bread was accompanied by a small increase in sodium intake. Around 1·3 percent of the population shifted from a sodium intake below to above 40 mg/kg bw per day.
Justification of classification of acrylamide and sodium intakes in relation to health risk
The classes of sodium intake were based on epidemiological studies demonstrating effects of sodium intake on blood pressure, a known risk factor for CVD.
In this calculation the total population was included. However, if the focus were on overweight persons the increase in sodium intake resulting from the mitigation measures applied might be of more concern because of the possible higher susceptibility of this group in the population to the effects of salt.
This example demonstrates that the risk-benefit model can calculate a simultaneous change in exposure levels of two compounds and that these types of models can be applied to judge the effect of mitigation. The model will be applicable for other mitigation measures as long as reliable quantitative data on concentration of compounds are available and if the relationship(s) is (are) known between the dose of a compound and possible health outcomes.
Gaps of knowledge
● A risk-benefit analysis has been attempted for one of the mitigation measures and its side effect is described in this article. The analyses might be applied to other risk-benefit cases, depending on availability of quantitative data.
● More exposure data is needed for vulnerable groups with respect to sodium intake, e.g. over weight consumers which are more susceptible to elevated blood pressure.
● Limited dose-response data for carcinogenic effects of acrylamide are available. Whether a linear extrapolation model can be used to predict cancer risk in humans at realistic exposure levels, is not clear, however. Further studies using appropriately designed experiments and animal models investigating metabolic fate and biological effects across the full range of acrylamide exposures are required.
● Quantification of uncertainties in data and modelling is needed.
Acknowledgements
The authors of this paper would like to thank RHM for providing quantitative data on reduction percentages in cereals.
This work was commissioned by the Process-related Compounds Task Force of the European branch of the International Life Sciences Institute (ILSI Europe). Industry members of this task force are Cereal Partners Worldwide, Danisco, DSM, Groupe Danone, Kraft Foods, Nestlé, PepsiCo International, Procter & Gamble, RHM Technology, Südzucker/BENEO Group, and Unilever. For further information about ILSI Europe, please call +32 2 7710014 or email info@ilsieurope.be. The opinions expressed herein are those of the authors and do not necessarily represent the views of the ILSI Europe.
Conflict of interest statement
For those experts affiliated with academic institutions, ILSI Europe covered the expenses related to their participation in Expert Group meetings, and an honorarium has been provided. None of the authors declare any interests that may conflict with the provision of their solely scientific input to the report.



