

Introduction
Genetic diversity among individuals of a species determines its overall ability to adapt to specific and changing environments. Wild plant species are the most significant resource of genetic diversity both for natural selection and for improvement of related domesticated crop species. Therefore, conservation of diversity in wild plant species may preserve genes useful both for evolution and for sustainable use of natural resources. In the case of endangered species that are often adapted to a narrow range of specific environments, assessment of genetic diversity may reflect the fitness and viability of particular population and overall species (Reed and Frankham, Reference Reed and Frankham2003). Accordingly, the level of genetic diversity of different populations may suggest the necessary conservation measures for entire species. Genetic diversity of a given population also reflects the history of interactions of this population with the environment and anthropogenic influence on this population.
Studies of genetic diversity in wild plant species are hindered by the lack of DNA sequence information, which is usually limited to a few nuclear and chloroplast genes. For this reason, the analysis of genetic diversity in wild species is commonly performed using molecular marker systems, which do not require any prior sequence information such as random amplification of polymorphic DNA, inter simple sequence repeat (ISSR) and amplified fragment length polymorphism (AFLP). However, some of them show low reproducibility between different laboratories, and they often cannot resolve the genetic relationships between populations or even between closely related species (Nybom, Reference Nybom2004). Assessment of genetic diversity at population level has always been a challenge, demanding sensitive marker methods and high level of polymorphism.
Sea holly (Eryngium maritimum L.) is a perennial coastal species belonging to carrot family (Apiaceae). It is distributed along coasts of Europe, including the coasts of the North Sea and the Baltic Sea, the Atlantic Ocean, the Mediterranean region and the Black Sea. In the Northern Europe, E. maritimum is on or near the distribution margin of the species. The species is threatened or endangered in most of the Baltic region, where the size and number of populations have decreased dramatically in recent years (Łabuz, Reference Łabuz2007; Zolkos et al., Reference Zolkos, Afranowicz, Bloch-Orlowska and Koziel2007; Aviziene et al., Reference Aviziene, Pakalnis, Sendzikaite, Cygas and Froehner2008; Olšauskas and Urbonienė, Reference Olšauskas and Urboniene2008). There is evidence of reduction of population size and even extinction of populations in other Northern European countries, e.g. Norway (Curle et al., Reference Curle, Stabbetorp and Nordal2007) and United Kingdom (Clausing et al., Reference Clausing, Vickers and Kadereit2000). Assessment of genetic diversity in Northern European populations of E. maritimum is essential for appropriate conservation measures, but the published ISSR markers (Clausing et al., Reference Clausing, Vickers and Kadereit2000) and chloroplast DNA sequences (see ‘Discussion’ section for more details) exhibited low level of polymorphism in E. maritimum populations from coastal regions of the Baltic sea and the North Sea. In order to address this issue, a more sensitive retrotransposon-based sequence-specific amplification polymorphism (SSAP) molecular marker system was developed. SSAP is based on insertion polymorphisms of Ty1-copia group long terminal repeat (LTR) retrotransposons (Waugh et al., Reference Waugh, McLean, Flavell, Pearce, Kumar, Thomas and Powell1997). LTR retrotransposons are ubiquitous in the plant kingdom; they are often present in a high copy number as heterogeneous populations distributed throughout the genome and they exhibit highly polymorphic insertion sites (Flavell et al., Reference Flavell, Dunbar, Anderson, Pearce, Hartley and Kumar1992; Kumar and Bennetzen, Reference Kumar and Bennetzen1999), making them suitable as molecular markers to assess genetic diversity at population level. SSAP marker system is a modification of AFLP system, which differs in the amplification step, where the SSAP system uses one adaptor-specific primer and a retrotransposon-specific primer. The latter is typically complementary to the 5′ terminal sequence of LTRs, which are not conserved among species; therefore, sequence information on the LTR 5′ terminal region is needed for every species to develop species-specific primers. A published LTR isolation protocol can be utilized to obtain LTR sequences from species such as E. maritimum, where such information is unavailable (Pearce et al., Reference Pearce, Stuart-Rogers, Knox, Kumar, Noel Ellis and Flavell1999).
SSAP molecular marker systems have been developed in several crop species, e.g. faba bean Vicia faba (Pearce et al., Reference Pearce, Stuart-Rogers, Knox, Kumar, Noel Ellis and Flavell1999; Sanz et al., Reference Sanz, Gonzalez, Syed, Suso, Saldaña and Flavell2007), pea Pisum sativum (Ellis et al., Reference Ellis, Poyser, Knox, Vershinin and Ambrose1998; Pearce et al., Reference Pearce, Knox, Ellis, Flavell and Kumar2000), barley Hordeum vulgare (Waugh et al., Reference Waugh, McLean, Flavell, Pearce, Kumar, Thomas and Powell1997), bread wheat Triticum aestivum (Queen et al., Reference Queen, Gribbon, James and Jack2004), alfalfa Medicago sativa (Porceddu et al., Reference Porceddu, Albertini, Barcaccia, Marconi, Bertoli and Veronesi2002), apple Malus x. domestica (Venturi et al., Reference Venturi, Dondini, Donini and Sansavini2006), globe artichoke Cynara cardunculus (Acquadro et al., Reference Acquadro, Portis, Moglia, Magurno and Lanteri2006), wild Lactuca serriola and cultivated Lactuca sativa lettuce (Syed et al., Reference Syed, Sørensen, Antonise, van de Wiel, van der Linden, Hooftman, Nijs and Flavell2005b). Although distribution and location of Ty1-copia group retrotransposons in genomes of wild plant species have been studied, e.g. Silene latifolia (Matsunga et al., Reference Matsunga, Yagisawa, Yamamoto, Uchida, Nakao and Kawano2002), genus Helianthus (Natali et al., Reference Natali, Santini, Giordani, Minelli, Maestrini, Cionini and Cavallini2006) and genus Hypochaeris (Ruas et al., Reference Ruas, Weiss-Schneeweiss, Stuessy, Samuel, Pedrosa-Harand, Tremetsberger, Ruas, Schlüter, Herrera, König and Matzenbacher2008), there are, to our knowledge, no reports on SSAP marker development in wild plant species unrelated to crop plants. This study reports the first characterization of E. maritimum retrotransposons and the development of SSAP marker system for analysis of genetic diversity in E. maritimum.
Materials and methods
Plant material
Leaf material from 150 individual plants from across Northern European distribution area was collected during 2006–2008 and consisted of 50 plants from Latvian population near villages Uzava and Ziemupe, 10 plants from Lithuanian population on Curonian Spit, 15 plants from Kihnu and Saaremaa islands (Estonia), 29 plants from locations near Krynica Morska, Piaski, Dabki, Lazy and Swinousjscie on the Baltic coast of Poland, 22 plants from Gothland and Oland islands (Sweden) and 24 plants from locations near Prestatyn, Newborough and Formby (UK) (Fig. 3). Detailed description of samples and collection sites will be provided elsewhere. Retrotransposon LTR sequences for primer design were cloned from genomic DNA from a single E. maritimum plant from Latvian population.
DNA extraction and isolation of retrotransposon LTR sequences
Genomic DNA was extracted using DNeasy Plant Mini Kit (Qiagen, Hilden, Germany) according to the manufacturer's instructions. E. maritimum LTR sequences were isolated according to protocol of Pearce et al. (Reference Pearce, Stuart-Rogers, Knox, Kumar, Noel Ellis and Flavell1999) with the modification of Syed et al. (Reference Syed, Surseshsundar, Wilkinson, Bhau, Cavalcanti and Flavell2005a). Briefly, approximately 0.5 μg genomic DNA was digested with MseI (New England Biolabs, Ipswich, MA, USA). To prepare the necessary template for pre-amplification, digested DNA was ligated with 500 ng of MseI adapters (MseI_oligo1: 5′-GACGATGAGTCCTGAG-3′; MseI_oligo2: 5′-TACTCAGGACTCAT-3′). Purified template DNA (50 ng) was used to amplify the RNaseH gene-LTR region of retrotransposon using conserved RNaseH motif 1 primer (5′-MGNACNAASCAYATHGA-3′) and MseI restriction site adapter-specific primer (5′-GATGGATCCTGAGTAA-3′). PCR was carried out as described by Pearce et al. (Reference Pearce, Stuart-Rogers, Knox, Kumar, Noel Ellis and Flavell1999). PCR products were purified and re-amplified using nested primer corresponding to the RNaseH motif 2 (5′-GCNGAYATNYTNACNAA-3′) and MseI adapter-specific primer. PCR products were purified again and cloned into pGEM-T Easy cloning vector (Promega, Madison, WI, USA). Insert sizes of clones were identified by PCR as described by Syed et al. (Reference Syed, Surseshsundar, Wilkinson, Bhau, Cavalcanti and Flavell2005a), and clones with inserts larger than 300 nucleotides were sequenced.
Identification of isolated LTR sequences and design of primers
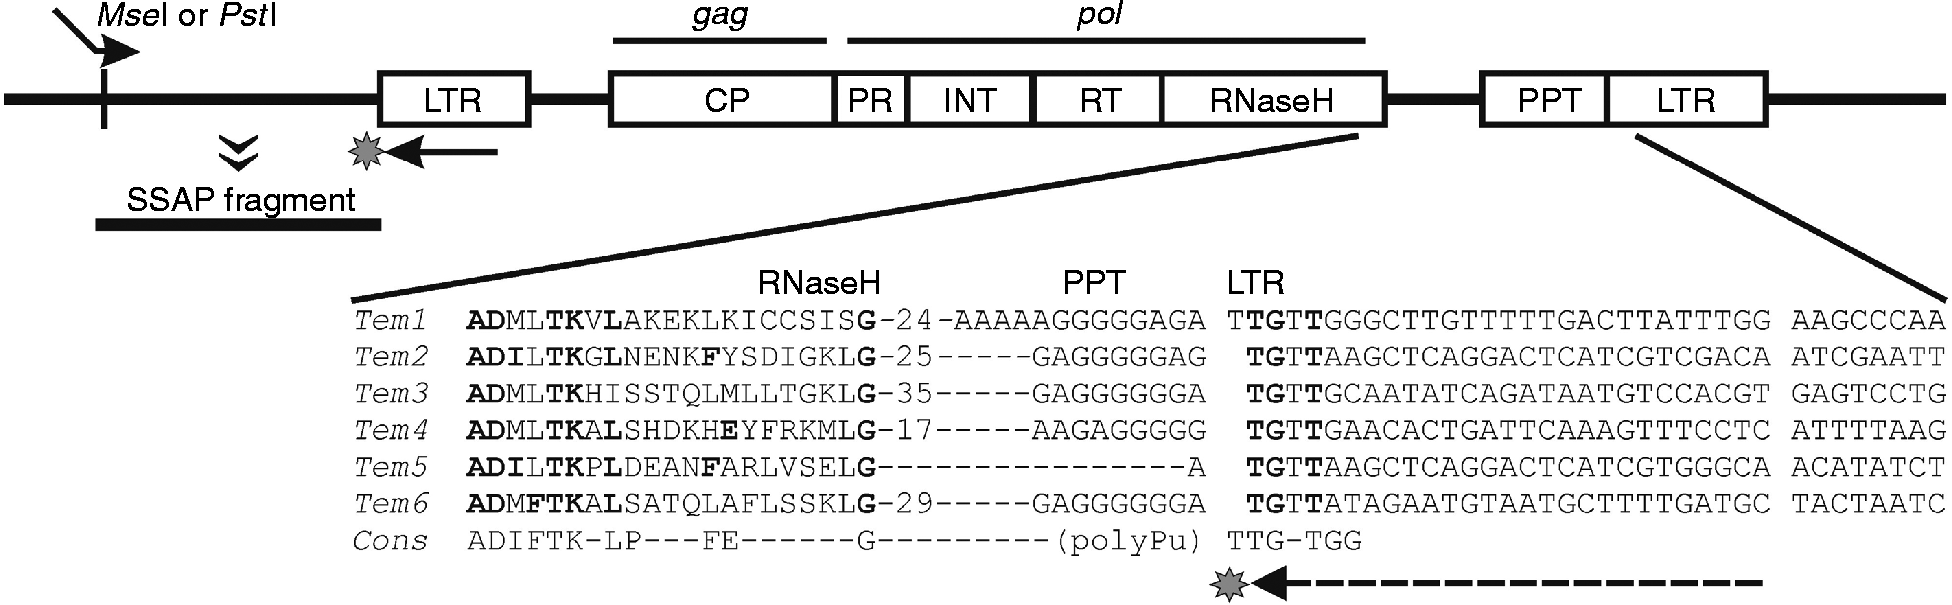
DNA sequences were screened for characteristic structural features of LTR retrotransposons, i.e. a conserved peptide motif of the RNaseH gene followed by polypurine tract (PPT) and initial TTG-T motif of LTR to detect novel E. maritimum RNaseH-LTR regions (Pearce et al., Reference Pearce, Stuart-Rogers, Knox, Kumar, Noel Ellis and Flavell1999; Fig. 1). Primers complementary to 5′ end of the novel postulated 3′ LTRs were designed (Fig. 1 and Table 1). Selective nucleotides at 3′ end of the LTR primer were added to prevent SSAP amplification internal to the retrotransposons (Pearce et al., Reference Pearce, Stuart-Rogers, Knox, Kumar, Noel Ellis and Flavell1999).
Generic scheme of a LTR retrotransposon according to Pearce et al. (Reference Pearce, Knox, Ellis, Flavell and Kumar2000), indicating conserved motifs that were used for isolation and identification of retrotransposon clones from E. maritimum and the structure of RNaseH–PPT–LTR region from the six sequenced E. maritimum Ty1-copia retrotransposons. The Ty1-copia LTR retrotransposons have direct LTRs at each end; gag gene encodes capsid-like protein (CP); pol gene encodes protease (PR), integrase (INT), reverse transcriptase (RT) and RNaseH. MseI or PstI, restriction enzyme site in genomic DNA; solid arrows indicate position of primers for SSAP PCR in the left LTR and at the MseI or PstI adapter; dashed arrow indicates the position of the LTR primers in sequence; asterisks indicate position of selective bases; SSAP fragment denotes the region amplified by LTR and adapter primers. The different sequence elements and primers are not drawn to scale. Nucleotide and amino-acid residues in bold are conserved and correspond to consensus residues reported by Pearce et al. (Reference Pearce, Stuart-Rogers, Knox, Kumar, Noel Ellis and Flavell1999). Hyphens indicate gaps in the sequence, while the number indicates the length of a gap. PPT is directly adjacent to LTR sequence.

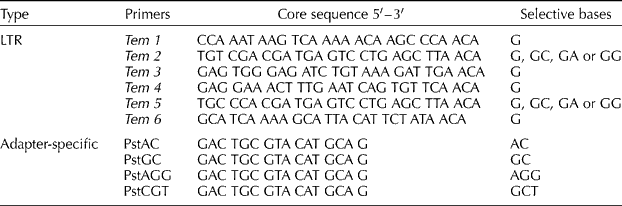
Retrotransposon and adapter-specific primer sequences

SSAP analysis
SSAP analysis was performed according to the protocol of Syed and Flavell (Reference Syed and Flawell2006). E. maritimum genomic DNA (0.5 μg) from 150 individual plants was digested with PstI and Tru1I (an MseI isoschizomer; obtained from Fermentas, Lithuania). Digested DNA was ligated with PstI and MseI adapters (PstI_oligo1 5′-CTCGTAGACTGCGTACATGCA-3′, PstI_oligo2 5′-TGTACGCAGTCTAC-3′, MseI_oligo1 and MseI_oligo2). Pre-amplification was performed using PstI and Tru1I adapter-specific primers with no selective nucleotides (PstI: GACTGCGTACATGCAG, Tru1I (MseI) above) to reduce the complexity of the genome. Selective amplification was carried out on pre-amplification products with primers containing two, three or four selective nucleotides on adapter-specific primer (PstI or Tru1I) and one or two on the [γ33] P-labelled retrotransposon LTR primer. Amplification was performed using touchdown PCR conditions (Vos et al., Reference Vos, Hogers, Bleeker, Reijans, van de Lee, Hornes, Frijters, Pot, Peleman, Kuiper and Zabeau1995). Amplified SSAP fragments were resolved on a 6% polyacrylamide 1 × Tris boric acid ethylenediaminetetraacetic acid gel for 2.5 h at 90 W. SSAP band sizes were determined by comparison to the [γ33] P-labelled 30–330 bp AFLP DNA Ladder (Invitrogen, Carlsbad, CA, USA) and visualized by Fuji FLA-5100 Phosphor Imager (Fuji, Japan).
Data analysis
Combinations of LTR- and adapter-specific primers were screened to select most useful combinations for diversity analysis of E. maritimum populations. Autoradiography images were scored for the presence or the absence of SSAP markers, and utility of particular combination was assessed by estimating the number of polymorphic bands between all 150 samples, total number of bands and overall gel quality and banding pattern. Reproducibility of banding pattern was assessed by repeating SSAP PCR twice on the same DNA sample with subsequent analysis in polyacrylamide gel. If there was ambiguity in any position, the corresponding band was excluded in all samples. Polymorphism information content was calculated for each SSAP band as described (De Riek et al., Reference De Riek, Calsyn, Everaert, Van Bockstaele and De Loose2001), and the average values were determined for each primer combination. Neighbour joining dendrogram was constructed using DARwin 5 software (http://darwin.cirad.fr/darwin) from Dice dissimilarity data.
Results
Isolation of retrotransposon LTR sequences
Putative RNaseH-LTR junctions were amplified from E. maritimum using degenerate PCR primers corresponding to conserved regions in LTR retrotransposons. Forty-eight clones of the putative RNaseH-LTR region were sequenced, and six of them exhibited characteristic structural features of Ty1-copia group LTR retrotransposons, namely the presence of conserved motif 2 of the Ty1-copia retrotransposon RNaseH gene and the polypurine tract followed by the TTG-T sequence motif characteristic of the 5′ end of retrotransposon LTR. The six sequences representing different retrotransposons were named Tem1–Tem6 (transposon E. maritimum). Sequences are deposited in GenBank database under accession numbers HM441069–HM441074.
SSAP marker development
Retrotransposon-specific oligonucleotides with selective nucleotide(s) were designed complementary to terminal sequences of each retrotransposon LTR to amplify sequence outwards from the 5′ LTR. All six LTR oligonucleotides, in conjunction with various restriction site adapter-specific oligonucleotides, were applied to produce retrotransposon insertion profiles by SSAP PCR. In general, better amplification results were obtained with PstI adapter-specific primer comparing to Tru1I (MseI) primer (results not shown); therefore, further SSAP analysis was performed using PstI adapter-specific primers.
In order to reduce the complexity of the genome and the number of SSAP bands per gel, varying number of selective nucleotides added to the LTR- and adapter-specific primer sequences was tested (Table 1). All the retrotransposon primers exhibited different SSAP profiles, except Tem2 and Tem5, which showed similar banding pattern, when the same adapter-specific primers were applied (Fig. 2(a)), which is likely due to the sequence similarity of LTR-specific primers used to amplify Tem2 and Tem5 retrotransposons (Table 1). When comparing band density, Tem2 and Tem5 demonstrated higher numbers of fragments in polyacrylamide gel than Tem1 and Tem4 (Fig. 2(a)), while SSAP amplification of Tem3 and Tem6 did not result in clear gel pattern or amplification was not successful at all with any of adapter-specific primers (not shown). Thus, Tem3 and Tem6 appeared to be unsuitable for diversity analysis in E. maritimum.
(A) SSAP profiles of the four E. maritimum retrotransposons showing different number of fragments on gel using three selective nucleotides (Tem1G+PstTT, Tem2G+PstTT, Tem4G+PstTT and Tem5G+PstTT). Tem3 and Tem6 did not provide scorable bands on gels and are not shown; (a–f) different samples of E. maritimum. (B) Effect of selective nucleotides on the number of bands per gel for Tem2 retrotransposon. The selective nucleotides are indicated for each SSAP primer combination; (a–f) different samples of E. maritimum.

In total, 130 combinations of primers were tested. The optimal SSAP pattern for retrotransposons Tem1 and Tem4 was obtained with three selective nucleotides – one for each of the LTR primers and two for the adapter-specific primer. SSAP PCR with two selective nucleotides for the adapter-specific primer for retrotransposons Tem2 and Tem5 resulted in too many fragments on the gel; therefore, three and four selective nucleotides were tested. Addition of extra selective nucleotides to adapter-specific primers for Tem2 and Tem5 was not effective in reducing the number of fragments; thus, addition of a second selective nucleotide to the LTR primer was tested and resulted in scorable number of bands on gel (Fig. 2(b)).
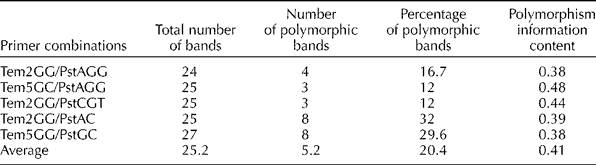
While the quality of SSAP bands from Tem1 and Tem4 was good, the polymorphism level was lower than that of Tem2 and Tem5 (Table 2). Therefore, we conclude that retrotransposons Tem2 and Tem5 are best suited for analysis of intra-specific diversity in E. maritimum. The most informative primer combinations for diversity analysis in sea holly populations, giving highest polymorphism level and clear SSAP banding pattern, were Tem2GG+PstAGG, Tem5GC+PstAGG, Tem2GG+PstCGT, Tem2GG+PstAC and Tem5GG+PstGC (Table 2). The average number of good quality bands per gel was 25.2 for these five primer combinations, while the number of polymorphic bands was on average 5.2 per gel (20.4%) indicating a relatively low level of polymorphism in E. maritimum accessions under study. However, the available polymorphism allowed to distinguish majority of the individual plants from all populations (Fig. 3).
Descriptive statistics for the five most informative SSAP primer combinations

Neighbour joining dendrogram of the 150 E. maritimum individuals from the Northern European populations based on the SSAP genotype data. Samples are identified by country of collection, i.e. EE, Estonia; LT, Lithuania; LV, Latvia; PL, Poland; SE, Sweden; UK, United Kingdom. An inset shows the map of the sample collection sites.

Discussion
The aim of this study was to develop new molecular markers for E. maritimum to improve the analysis of genetic diversity between and within populations on margin of species distribution range in Northern Europe. Six novel putative retrotransposon sequences were isolated; corresponding RNaseH-LTR regions were sequenced and SSAP marker systems were designed. Two retrotransposons demonstrating the highest polymorphism level, Tem2 and Tem5, were identified, together with four adapter-specific selective primers, giving five SSAP primer combinations best suited for analysis of genetic diversity in E. maritimum.
In our study, different E. maritimum retrotransposons exhibited variable SSAP band pattern, abundance and intensity. SSAP banding profile quality was taken into account when evaluating the utility of particular primer combination. Differences within number of fragments per gel of various retrotransposons can indicate different copy number of retrotransposons in the genome, e.g. the larger number of Tem2 and Tem5 SSAP fragments suggests higher copy number in the E. maritimum genome, comparing to Tem1 and Tem4. Poor banding pattern observed with Tem3 and Tem6 could be due to low copy number of particular retrotransposons in the E. maritimum genome, low primer binding success or some other reasons.
The data reported here demonstrate that different Ty1-copia group retrotransposons exhibited different level of polymorphism, e.g. Tem2 and Tem5 were more polymorphic than Tem1 and Tem4 in the E. maritimum genome, possibly indicating differential transpositional activity of various retrotransposons. Similar results were reported by Queen et al. (Reference Queen, Gribbon, James and Jack2004), where three different retrotransposons exhibited various levels of polymorphism in wheat: retrotransposon Thv19 – 13%; Tar1 – 18%; TAGERMINA – 17%. Thereby, the choice of particular retrotransposon can substantially affect the analysis of genetic diversity, and it is advisable to apply several different retrotransposons to achieve acceptable results.
Retrotransposon-based SSAP marker system was more sensitive in detecting polymorphism in E. maritimum Northern European populations compared to previous studies using ISSR markers and chloroplast DNA sequence analysis (Ievina, unpublished data). For instance, only the OC ISSR primer used by Clausing et al. (Reference Clausing, Vickers and Kadereit2000) was polymorphic among 51 plants from the Latvian population of E. maritimum. The polymorphism level for this ISSR primer was 12.5%, i.e. substantially lower than 19.25% for SSAP markers in Latvian population. Similarly, sequence analysis of four non-coding regions (trnD-trnT, trnS-trnG and rpoB-trnC intergenic spacers and rpl16 gene intron) of the sea holly chloroplast genome identified no single nucleotide substitutions or indels in 30 plants from Latvia, Lithuania, Estonia, Poland and UK, indicating that chloroplast DNA sequences may not reveal intraspecific genetic relationships in E. maritimum (data not shown).
Higher level of polymorphism generated with SSAP compared with other marker systems has been observed in many other plant species, e.g. SSAP detected more polymorphic loci than AFLP in cucumber, which has narrow genetic variation (Lou and Chen, Reference Lou and Chen2007). Higher polymorphism level was also detected in different varieties of blue agave, Agave tequilana, resulting in a more confident deduced structure of phylogenetic tree than that of AFLP (Bousios et al., Reference Bousios, Saldana-Oyarzabal, Valenzuela-Zapata, Wood and Pearce2007). Furthermore, although phylogenetic trees generated by AFLP and SSAP markers were similar in Pisum, PDR1 SSAP was more informative than AFLP (Ellis et al., Reference Ellis, Poyser, Knox, Vershinin and Ambrose1998). Lastly, Tam et al. (Reference Tam, Mhiri, Vogelaar, Kerkveld, Pearce and Grandbastien2005) reported that SSAP markers are the most informative among SSAP, AFLP and SSR marker systems, with SSAP showing four- to ninefold higher diversity in tomato and pepper than AFLP and had the highest number of polymorphic bands per assay ratio.
Direct comparison of the polymorphism level generated by SSAP and AFLP marker systems in E. maritimum is complicated by the fact that the few AFLP studies of genetic diversity in E. maritimum sampled the whole species distribution range in Europe, while this SSAP study analyzed genetic diversity of populations on margin of species distribution range in Northern Europe including the Baltic coast. Although the widely used AFLP system, when applied for analysis of genetic diversity in E. maritimum, has shown sufficient level of polymorphism to determine genetic relationship between European populations, it has also found little geographic substructure along the Northern European coast (Kadereit and Westberg, Reference Kadereit and Westberg2007; Westberg and Kadereit, Reference Westberg and Kadereit2009).
Although SSAP has proved to be sensitive in detecting polymorphism in E. maritimum, the number of polymorphic bands (20.4%) found is not high compared to other species. In a doubled haploid barley mapping population BARE-1, SSAP marker polymorphism level was 29.3% (Waugh et al., Reference Waugh, McLean, Flavell, Pearce, Kumar, Thomas and Powell1997), while 42.8% of retrotransposon Tsc SSAP bands were polymorphic between two cucumber, Cucumis sativus, varieties (Lou and Chen, Reference Lou and Chen2007). In nine sweet potato genotypes representing Africa, South- and Central America and Papua New Guinea, SSAP markers were 97–99% polymorphic (Berenyi et al., Reference Berenyi, Gichuki, Schmidt and Burg2002). On the other hand, some species exhibited even lower level of polymorphism, e.g. in cashew Anacardium occidentale, retrotransposons Tao1 and Tao2 resulted in 8 and 7% polymorphic bands, respectively (Syed et al., Reference Syed, Surseshsundar, Wilkinson, Bhau, Cavalcanti and Flavell2005a). The observed relatively low level of polymorphism in E. maritimum can be explained both by a low level of genetic diversity in Northern European populations of E. maritimum and with low activity of selected retrotransposons in species genome.
However, for our purpose, the SSAP marker system provided enough resolution to distinguish the majority of individual E. maritimum plants with an exception of a few plants from Latvian population (Fig. 3), which is consistent with the ISSR marker data and chloroplast DNA sequence analysis (Ievina, unpublished data) that showed that the Latvian population was the least diverse. Overall, there was little differentiation between samples from different populations. While detailed analysis of the genetic structure of Northern European E. maritimum populations is beyond the scope of this study, the development of a new molecular marker system for E. maritimum with sufficient level of polymorphism for assessment of genetic diversity of the species paves a path for future studies on the status of populations in Northern Europe to apply adequate conservation measures.
Acknowledgements
The study was funded by University of Latvia grants ZP-20 and ZP-59 to G. I. and N. R., respectively, a grant from Latvian Environmental Protection Fund to G. I. and core funding from Scottish Executive Environment and Rural Affairs Department. The technical assistance by Karlis Kalviskis with designing the map of sample collection sites is gratefully acknowledged.