Introduction
In common with many of my colleagues, I always thought that research into surfaces could only be conducted in a condition of high vacuum. The reasons are simple: The techniques that provide the most detailed information about surfaces operate in a vacuum. In addition, for surfaces to stay clean, they again require a vacuum. The large numbers of sophisticated techniques and processes that have been developed over the years have established the subfield of surface science in materials sciences and have helped to bring it to its present high level. However, we all recognize that we need to go a step further—to develop the field of surfaces in the presence of gases and liquids at environmentally relevant conditions.
I will start by listing what I consider to be the main challenges of this century. I am sure many would agree with me that energy, and clean energy in particular, is the number one problem. Until recently, we have not paid sufficient attention to clean energy, but now we are beginning to see the effects of burning fossil fuels on the environment and the climatic changes that result from it. This needs to be slowed.
The cleanest way to obtain energy is from the sun—photovoltaics, photocatalysis, and so on. The sources of energy deriving from the sun, including wind, which is a secondary source, have the problem that they are intermittent. The sun is present only during the day, so methods need to be developed to store the energy efficiently, and this introduces the challenge of energy storage, using for example electrochemical batteries. To improve existing technologies, we need to understand a new class of surfaces—the surfaces of electrodes surrounded by electrolytes. Another way to obtain clean energy is to modify abundant but polluting sources of energy such as coal to make them cleaner; for example, converting the coal into gas or liquid fuel. There are processes already developed for that purpose, for example, the Fischer–Tropsch process.
In these processes, we need to understand the structure and dynamics of solid-gas and solid-liquid interfaces at the atomic scale. To achieve this goal, microscopes are needed to observe atoms and molecules at the surface as they react with gases or liquids. Fortunately, many of these techniques exist today, as we see by the progress in transmission electron microscopy (TEM) imaging under realistic conditions. Another technique is scanning tunneling microscopy (STM), which can work in air, liquid, and reactive gases.
Here we focus on spectroscopy—x-ray photoelectron spectroscopy (XPS), x-ray absorption spectroscopy (XAS), and so on. These spectroscopies are extremely surface sensitive or can be made to be surface sensitive; they contain information specific to each element, including the identity of the elements on the surface and their chemical state.
Many researchers in these areas, including myself, are also interested in catalysis. We can examine surfaces using available techniques in vacuum, under liquids, or under gases, but we cannot yet capture the important intermediate species in a catalytic reaction because they are short-lived and probably present in very small concentrations. For that reason, we require very fast techniques. These techniques will become increasingly available in the future thanks to the development of ultrafast sources of x-rays, which are already in an advanced stage.
To restate the problem, catalysis, environmental science, liquids, and wetting all require the study of surfaces in realistic environments. In contrast to traditional surface science in high vacuum, now we must consider what we could call the “pressure force,” which is the entropic term in the Gibbs free energy: kTln(p) at temperature T and pressure p. The 13 orders of magnitude increase in pressure from 10–10 Torr to 760 Torr produce a change in the Gibbs free energy: G atm–G v = 30 kT = 0.77 eV at room temperature, which is even greater at higher temperatures. This completely changes the way surfaces behave in equilibrium with gases. One consequence of this is that unless experiments are conducted under realistic conditions, entire areas of the phase diagram will be missed. We thus need spectroscopy and microscopy techniques that allow us to operate in real environments. The most obvious are optical spectroscopies, but we will not discuss them here.
Electron spectroscopy
X-ray spectroscopies have proved to be a rich source of information, in particular XPS, XAS, and x-ray emission (XES), all of which are best performed in a synchrotron. In XPS, we examine electrons emitted from a surface which, due to their very short mean free path in the solid, contain information about the first few surface atomic layers. However, transport of these photoelectrons through long distances (> cm) in the surrounding gas at pressures of a few Torr and higher poses a substantial problem. The Advanced Light Source, the Berkeley Synchrotron, provided a natural incentive to further develop these techniques, with the goal to extend their operation to ambient pressures.
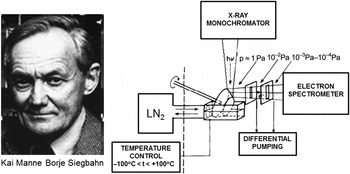
On a historical note, Kai Siegbahn, who was awarded the Nobel Prize in Physics in 1981 for the development of “ESCA” (electron spectroscopy for chemical analysis), or XPS as it is more commonly known today, was well aware that XPS can be performed under gases and vapors.Reference Siegbahn1 The experimental setup in his group is illustrated in Figure 1. A sample of the liquid under study was placed in a reservoir, while a metal support in the form of a rotating cone half immersed in the liquid dragged a layer of the liquid with it.Reference Siegbahn, Svensson and Lundholm2 The photoelectrons emitted by the x-rays incident on this layer traveled through the gas, suffering losses from scattering. To separate the electrons from the gas, he placed an orifice very close to the illuminated spot on the sample cone, such that as many electrons as possible could reach the orifice before they collided with the gas phase. Because the detectors and electron energy analyzers operate in a high vacuum, he arranged a number of chambers, each one separated from the other through a slit or orifice, and each being pumped independently so that the pressure would decrease from the operating vapor pressure of several Torr down to the vacuum required for the spectrometer. This is called differential pumping.
The first ambient pressure photoelectron spectrometer, developed in the group of Prof. Kai Siegbahn, winner of the 1981 Nobel Prize in Physics at Uppsala University. The schematic on the right describes the setup used to study vapors from condensed liquids.Reference Siegbahn, Svensson and Lundholm2 A film was formed on a rotating metallic cone partly immersed in the liquid. The photoelectrons were separated from the gas and driven to the spectrometer through differentially pumped chambers connected by narrow slits.

Surprisingly, relatively few papers on the subject were published in the 1980s. We can understand the problems facing the researchers by considering the mean free path of electrons in 1 Torr of oxygen, for example. For a 200 eV electron, the mean free path is approximately 1 mm, and about 6 mm at 1 keV. These lengths are greatly reduced as the pressure increases, and the count rate of electrons striking the orifice is quickly reduced. We adopted a solution not too different from that of Siegbahn by creating an instrument with the entrance orifice at the apex of a cone. The orifice, with a diameter of less than 1 mm, is located a few mm from the surface. Both ambient gas and electrons pass through it, but since the pressure decays rapidly—two orders of magnitude below the original pressure within one orifice diameter due to pumping—the mean free path becomes large after passing the orifice. Three or more differentially pumped chambers are needed before the detector, which decreases the solid angle of collection, and the count rate. This is one reason why this technique was not widely used and remained dormant for many years, until we developed an electrostatic lens system that focused the electrons from one orifice into the next, making it possible to capture a larger solid angle. As a result, the count rate was increased by nearly three orders of magnitude in our device, thus enabling measurements in a short time.
This development took two years from conception of the idea to first results.Reference Ogletree, Bluhm, Lebedev, Fadley, Hussain and Salmeron3 We called the system ambient pressure photoelectron spectroscopy (APPES), sometimes also called ambient pressure XPS. Later we collaborated with the Fritz Haber Institute in Berlin to develop a second generation of the instrument in conjunction with SPECS, a commercial company.Reference Salmeron and Schlögl4 The new system is now available to users at the Advanced Light Source at the Lawrence Berkeley National Laboratory and at BESSY in Berlin. The advent of commercial instruments has resulted in a vigorous increase in the number of research papers published, a trend that continues today.
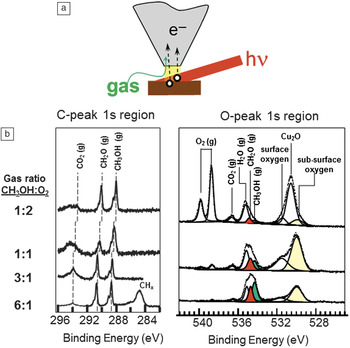
An example that illustrates the capabilities of APPES is shown in Figure 2. We were interested in the surface structure of Cu catalysts during partial oxidation of methanol.Reference Bluhm, Hävercker, Knip-Gericke, Teschner, Eleimenov, Bukhtiyarov, Ogletree, Salmeron and Schlögl5 X-rays illuminate the Cu sample at a grazing angle, and the emitted photoelectrons are collected through an orifice at the end of a conical grounded electrode a few millimeters away (Figure 2a). Since the x-rays also illuminate the gas region in front of the sample, we obtain simultaneously spectra from the gas reactant and product molecules right in front of the sample. In this experiment, the total pressure of methanol and oxygen was approximately 0.5 Torr. The XPS in the oxygen 1s-edge region at 528–540 eV is shown in the right panel of Figure 2b. The gas phase peaks appear at higher binding energies and include reactants O2 (doublet due to its paramagnetic nature) and CH3OH, and products CO2, H2O, and CH2O. The lower binding energy side corresponds to oxygen species bound to the sample. These species appear at lower binding energy due to screening of the core holes by electrons in the sample. For the gas phase molecules, no screening occurs so that the peaks appear at higher binding energies. In the carbon 1s region (left panel), we mainly see the gas phase component of the reactant and product molecules. This example shows how APPES provides the elemental composition, the reactants and products, and the state of the surface as a function of temperature and pressure during the catalytic reaction.
(a) Illustration of the ambient pressure photoelectron spectroscopy principle. The schematic shows the sample in a gas-filled chamber, being illuminated by the x-ray beam. The photoelectrons are collected through an orifice at the end of a cone located a few millimeters away. At pressures of a few Torr, this distance corresponds to the electron mean free path between collisions with the gas phase. The gas leaking through the orifice is pumped away on the other side of the orifice. Electrostatic lenses focus the electrons into other orifices connecting differentially pumped chambers containing the detector. (b) X-ray photoelectron spectroscopy graphs of a Cu catalyst sample that is actively catalyzing the reaction of methanol and O2 to produce formaldehyde and other reaction products (CO2, H2O). Both the gas phase species and the surface species produce well-resolved peaks that make possible the study of the reaction in situ.

The role of catalysts
An important part of the catalytic process is the preparation of a catalyst, which includes removal of contaminants, dispersion on a support, and other chemical treatments. Traditionally, spectroscopic and microscopic characterization of catalysts has been done ex situ before and after the reaction. The question arises as to what the structure is during the reaction. For example, in the CO oxidation reaction of vehicle exhaust catalysts in the presence of O2 and CO, is the catalyst in metallic or oxidized form? As the conditions of oxygen pressure and temperature change, is the oxidation state varying as well?
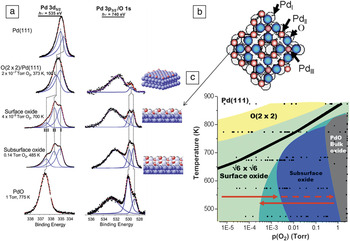
In the following example, we will look at a Pd(111) crystal. Palladium is used in CO oxidation reactions. It is therefore important to determine the structure of the oxide and the phase diagram of the Pd-O system as a function of temperature and pressure. Using APPES, we obtained the XPS spectra shown in Figure 3a, where the left column corresponds to the Pd 3d5/2 region, and the right column to the oxygen peak region, overlapping with the broad Pd 3p3/2 peak around 533 eV.Reference Ketteler, Ogletree, Bluhm, Liu, Hebenstreit and Salmeron6 The top spectrum is for the clean metal in vacuum. The addition of oxygen up to 10–7 Torr at room temperature leads to the formation of an ordered 2 × 2 structure with characteristic XPS peaks. When the pressure reaches 10–6 Torr, and up to several mTorr, a new structure appears in the form of a two-dimensional surface oxide, one atomic layer thick with a  $\surd 6 \times \sqrt 6$ periodicity relative to the substrate and a stoichiometry of Pd5O4. Lundgren et al.Reference Lundgren, Kresse, Klein, Borg, Andersen, De Santis, Gauthier, Konvicka, Schmid and Varga7 first discovered this two-dimensional oxide, shown schematically in Figure 3b. As we increase the oxygen pressure into the Torr regime, the expected thermodynamically stable bulk PdO does not form. Instead, a structure is formed that has XPS peaks at the same binding energy as those from the surface oxide, indicating the same chemical environment. The amount of O has nearly doubled relative to that of the surface oxide, indicating that the surface oxide grows in thickness. We labeled this “subsurface oxide.”Reference Ketteler, Ogletree, Bluhm, Liu, Hebenstreit and Salmeron6 Finally, at pressures of 1 Torr and higher, the XPS peaks change and become similar to those of bulk PdO.
(a) X-ray photoelectron spectroscopy (XPS) spectra in the Pd 3d5/2 and O 1s regions, as a function of O2 pressure, from high vacuum (top) to 1 Torr (bottom). Various Pd oxide structures are identified by characteristic peak positions and intensities. The first structure formed at the lower pressure is a chemisorbed 2 × 2 layer. (b) This is followed by a surface two-dimensional oxide, with a structure shown here schematically. At pressures in the milliTorr to Torr range, a 3D extension of the surface oxide labeled “subsurface oxide” is formed. Finally, at 1 Torr, the bulk stable PdO is formed. The subsurface oxide phase is metastable and is stabilized by slow kinetics. (c) Phase diagram obtained by coloring the areas around each pressure-temperature point according to the XPS spectra acquired under those conditions.Reference Ketteler, Ogletree, Bluhm, Liu, Hebenstreit and Salmeron6

By collecting spectra like these as a function of pressure and temperature, we obtained the phase diagram shown in Figure 3c, where each dot corresponds to an experiment after stabilizing the surface with the gas phase for 10 minutes. The shape of the peak indicates which oxide phase it corresponds to and is used to color the graph accordingly. Although the theoretically predicted PdO stability region is below the dark line, in the experiment, the PdO phase was observed only on the right side of the T-p diagram, followed by the “subsurface oxide” phase, between approximately 1 mTorr and 1 Torr at the lower 500–600 K temperature. There is a large hysteresis in the position of the boundary between the subsurface oxide (light and dark blue) and the surface oxide (green), which depends on whether the experiment was done by increasing the pressure and temperature or decreasing them (see the arrows in Figure 3). This is due to kinetic limitations between metastable phases. The reason for the subsurface oxide growing before it transforms to the lowest energy PdO is that this oxide has a lattice parameter that does not fit that of the Pd crystal, while both the surface and subsurface oxides maintain a commensurate relationship. The subsurface oxide is thus kinetically stabilized by the high activation energy for the rearrangement of Pd and O atoms into the PdO crystal form. We measured this energy by studying the time and temperature dependence of the peak intensities during the transformation and obtained a barrier of 140 kJ/mol. This conclusion is supported by the observation that the subsurface oxide does not form during reduction of PdO by heating, which proceeds directly from bulk to the surface oxide. This is an important example of surface structures that can form during reaction, and that although metastable, are likely to play a role in the catalytic activity. These structures can only be observed in the presence of gases.Reference Ketteler, Ogletree, Bluhm, Liu, Hebenstreit and Salmeron6
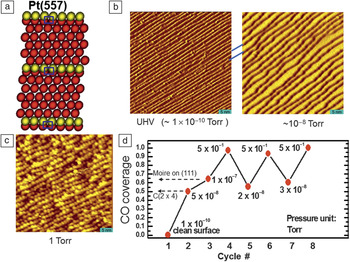
Another example that illustrates the effect of high pressure of gases on the surface structure of materials involves platinum, a catalyst in many reactions, including petroleum refining, hydrogenation, dehydrogenation, and CO oxidation. It is thought that low coordination atoms on the metal surface are active sites. These sites have been modeled by the steps and kinks of vicinal surfaces prepared by cutting a single crystal at small angles from the compact directions, such as those highlighted in yellow in the schematic of Figure 4a. A set of experiments was performed using STM in a reactor cell filled with gases up to atmospheric pressures.Reference Tao, Dag, Wang, Liu, Butcher, Salmeron and Somorjai8 In ultrahigh vacuum (∼10–10 Torr), the images of vicinal surfaces of Pt(111) reveal monoatomic steps separating (111) oriented terraces, 5 nm wide in this example (Figure 4b, left). After adding 10–8 Torr of CO, the surface changed to one with terraces double in width and steps double in height (Figure 4b, right), as found in previous studies at low pressure. It is also known that at this pressure, there are 0.5 monolayers of CO, or one molecule for every two Pt atoms. An unexpected transformation occurred when the pressure was raised to 0.5 Torr at room temperature. The surface broke into clusters of roughly triangular shapes covering the width of the terraces (Figure 4c).Reference Tao, Dag, Wang, Liu, Butcher, Salmeron and Somorjai8 This surprising reconstruction was found to be reversible: If CO is pumped out, the surface returns to its original step-terrace structure. This could be repeated several times, although a slow degradation occurred due to accumulation of impurities, resulting in the progressive blurring of the step structure.
(a) Schematic diagram showing the surface atoms of a stepped Pt(557) surface with (111) oriented terraces. The step atoms are shown in yellow. (b–c) Scanning tunneling microscopy images of the stepped surface as a function of CO pressure. At 10–8 Torr, the step structure changes to one with double width terraces and double height steps. (c) When the pressure reaches above 0.1 Torr, a massive restructuring occurs, where two-dimensional clusters are formed (c). Upon decreasing the CO pressure (all at room temperature), the surface structure recovers the step and terrace structure found at the lower pressures. (d) CO coverage (number of CO molecules per Pt atom), calculated from the x-ray photoelectron spectroscopy peak areas, in the ambient pressure photoelectron spectroscopy instrument.Reference Tao, Dag, Wang, Liu, Butcher, Salmeron and Somorjai8

To explain these observations, we measured the amount of CO present on the surface using APPES to obtain the O, C, and Pt XPS peaks. The areas of these peaks were used to determine the coverage of CO (number of CO molecules per Pt atom) (Figure 4d). Calibration was done using structures of known coverage, such as the c(2 × 2) formed around 10–8 Torr, where the coverage is 0.5,9 and the structure formed at 10–6–10–7 Torr, where the coverage is 0.66 ML.Reference Ertl, Neumann and Streit10 We found that as the pressure reached 0.5 Torr, the coverage of CO approached 1. How can such a massive restructuring of platinum occur at room temperature? There are two important drivers to such restructuring. One is the weakening of the binding of Pt atoms to neighboring Pt atoms by adsorption of CO so that their mobility increases. The other is the large repulsion between molecules, which are now forced to be within Pt–Pt distances (2.77 Å) of each other. This is much closer than the van der Waals diameter of the molecule (in liquid CO at 80 K, the molecular diameter is about 4.8 Å). Experiments with compressed liquid CO in a diamond anvil cell by Lipp et al.Reference Lipp, Evans, Baer and Yoo11 achieved densities more than twice that of the liquid phase at pressures of 5.6 GPa, corresponding to a CO diameter of about 3.8 Å. Although the covalent bonding of CO with Pt changes the spatial electron configuration and makes possible the high densities observed, we still expect a very high lateral compression. One way that the large compression energy can be decreased is by breaking the initially flat structure of Pt into small clusters that exhibit large numbers of edge sites, where CO can attach and fan out. In addition to determining the coverage of CO, the shape and energy shifts of the XPS peaks gave information on the nature of the adsorption sites, confirming the increase in the density of low coordination Pt sites generated by the breaking of the surface into nano-sized clusters.
Nanoparticles
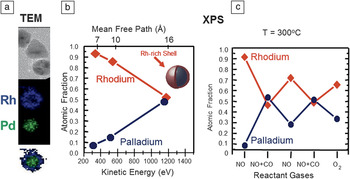
Nanoparticles of noble metals are excellent catalysts for CO oxidation, NO reduction, and hydrogenation reductions. In our study, we used Rh-Pd alloy particles with a 50:50 composition and a diameter of 15 ± 2 nm.Reference Tao, Grass, Zhang, Butcher, Renzas, Liu, Chung, Mun, Salmeron and Somorjai12 After synthesis, the particles have a core enriched in Pd covered by a shell of Rh oxide, as revealed by TEM imaging and energy dispersive x-ray spectroscopy (EDAX) analysis (Figure 5a).Reference Tao, Grass, Zhang, Butcher, Liu, Aloni, Altoe, Alayoglu, Renzas, Tsung, Aksoy, Salmeron and Somorjai13 Similar information was obtained from XPS using photons of different energies. The depth distribution of Rh and Pd inside the particles can be obtained from the different mean free paths of the photoelectrons with different kinetic energies (Figure 5b).
(a) Transmission electron microscopy (TEM) images of Rh0.5Pd0.5 nanoparticles (top) and corresponding energy dispersive x-ray spectroscopy images showing the spatial distribution of Rh (in the shell region) and Pd (in the core region) before reduction. The particle diameters are 15 nm approximately. (b) The atomic fraction of Rh and Pd from the same oxidized particles determined as a function of depth, analyzed using x-ray photoelectron spectroscopy (XPS). Using variable energy x-rays, we obtain photoelectron peaks of various energies (bottom x-axis) and escape depths (top axis). (c) Surface fraction of Rh and Pd obtained from ambient pressure photoelectron spectroscopy as a function of the gas composition at a total pressure of 200 mTorr and 300°C. Under reducing conditions (CO, NO+CO, and H2), Pd is preferentially segregated to the surface, while under oxidizing conditions (NO, O2), Rh is preferentially on the surface forming a shell of Rh2O3.Reference Tao, Grass, Zhang, Butcher, Renzas, Liu, Chung, Mun, Salmeron and Somorjai12,Reference Tao, Grass, Zhang, Butcher, Liu, Aloni, Altoe, Alayoglu, Renzas, Tsung, Aksoy, Salmeron and Somorjai13

We then investigated how the core-shell distribution of the two metal components changed as a function of exposure to different reactant gases and during catalytic reactions. When exposed to reducing species (e.g., CO or H2), we found that the Pd atoms migrated to the shell region, which became roughly 50:50 Rh:Pd. Mixtures of CO and NO were also overall reducing. When exposed to oxidant species, NO or O2, the Rh atoms migrated back to the shell region to form an oxide, while the Pd migrated to the core. These results, summarized in the graph shown in Figure 5c, can be understood by thermodynamic considerations, because Rh2O3 has higher formation energy than PdO and is therefore more stable, so it tends to segregate to the surface. In their metallic state, however, the surface energy of Pd is lower than that of Rh, so Pd moves to the surface. While similar results have been obtained in the past for bulk alloy samples, the question remains that in large macroscopic samples, the surface region does not reach equilibrium with the bulk, which acts as a virtually infinite sink and source of the component atoms. In the nanoparticles, however, the entire material can restructure and change so that the final structure is closer to the true equilibrium distribution. These experiments, performed at 300°C, demonstrate that the catalyst composition changes as the reaction conditions change, and that catalyst structure, composition, and chemical state are the result of a dynamic equilibrium with the gas environment and reaction conditions.
Spectroscopy of liquids
Liquid surfaces and the surface of water in particular are a fascinating topic and a very important one for life sciences and for environmental and wetting phenomena. Liquids provide a unique application for APPES because a free liquid surface will always be in contact with its vapor. For liquid water, the lowest pressure is 4 Torr at the triple point; a value that is accessible with our instrument. Important questions can now be investigated, including composition and cleanliness, orientation of interfacial water molecules, growth of wetting films, and many others.
The first experiment, carried out as soon as our instrument was completed, was aimed at the fascinating problem of the surface structure of melting ice. This has been the subject of a long controversy, started by FaradayReference Faraday14 and Lord Kelvin, about the existence of a pre-melted film at the ice surface close to but below 0°C. The state of the art two decades ago was summarized in a graph compiling measurements of the thickness of the liquid-like layer.Reference Elbaum, Lipson and Dash15 The measured data, using various techniques—ellipsometry, ionic conductivity, nuclear magnetic resonance—have an enormous variation.
As a surface scientist, the first question I ask is, “how clean is the surface?”—which can now be answered by our APPES technique. We know that seawater freezes at a lower temperature than fresh water, so the pre-melting could simply be the result of surface impurities. The next question is how the liquid or ice state of water can be determined. This can be answered using XAS, a technique that measures the absorption probability of a photon as a function of its energy. In water, this probability increases abruptly when the photon energy crosses the ionization threshold of the O 1s core level, at which point an electron is excited into empty molecular orbitals of the molecule. In this manner, we obtain a spectrum that depends on the chemical structure of water and, in particular, its H-bonding configuration,Reference Myneni, Luo, Näslund, Ojamäe, Ogasawara, Pelmenschikov, Väterlein, Heske, Pettersson and Nilsson16 thus making it possible to spectroscopically distinguish between the various phases of water.
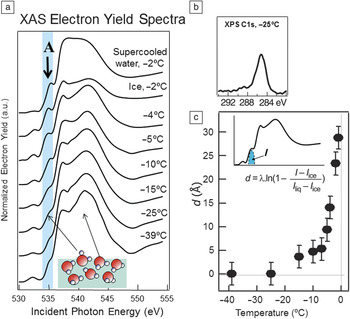
In ice, every water molecule is tetrahedrally coordinated, but in the liquid phase, H-bonds are breaking and forming continuously in a dynamic way. Of course, the gas phase molecules have no H-bonds. The first absorption peak at the threshold is very sensitive to the H-bonding structure and is intense in gas phase water, absent in pure ice, and of intermediate intensity in the liquid.Reference Myneni, Luo, Näslund, Ojamäe, Ogasawara, Pelmenschikov, Väterlein, Heske, Pettersson and Nilsson16 This is the peak labeled A in Figure 6a.Reference Bluhm, Ogletree, Fadley, Hussain and Salmeron17 We measured this peak as the temperature of ice approached its melting point. The ice was formed by condensing a film of water on a cooled copper substrate. In practice, the absorption of x-ray photons that create this peak can be measured in two different ways. One is by collecting the fluorescence photons emitted by the de-excitation of the core hole created by the photon. The other is by collecting Auger or secondary electrons, which can also be produced in the de-excitation. The advantage of collecting electrons instead of photons is that they have short travel distances in the condensed phase, and thus the information they convey is surface sensitive. The spectra obtained in this manner as a function of temperature are shown in Figure 6a. The XAS data show that peak A is small at lower temperatures, its presence due to broken H-bonds of water molecules at the surface. As the temperature approached 0°C, the peak intensity increased, a clear signature of melting. The last two spectra at the same temperature correspond to solid ice and super-cooled water, respectively. From the intensity of this peak and the knowledge of the escape depth of Auger electrons near 500 eV used to collect the spectra, we can obtain the thickness of the liquid layer on the ice surface. The result, shown in Figure 6c, demonstrates that pre-melting takes place when the temperature is within a few degrees of freezing.
(a) X-ray absorption spectra (XAS) of ice as a function of temperature acquired in the electron yield mode to enhance surface sensitivity. The first peak at the absorption threshold, labeled A, is characteristic of water molecules with unsaturated H-bonds, which occur in the liquid phase. In the ice phase, this peak is absent, except for a small contribution of surface molecules. The growth in intensity of peak A is apparent as the temperature approaches the melting point of 0°C and demonstrates that a pre-melting film forms at the surface of ice. The top spectrum corresponds to super-cooled liquid water at –2°C. (b) X-ray photoelectron spectroscopy (XPS) of the ice surface showing the presence of C-containing impurity molecules (about 10% of a monolayer). These molecules modify the extent of pre-melting. (c) Thickness d of the pre-melted film obtained from the intensity I of peak A (inset) and the known mean free path λ of the Auger electrons used to obtain the spectra. At temperatures of –2°C, the liquid film is on the order of a few nanometers.Reference Bluhm, Ogletree, Fadley, Hussain and Salmeron17

Is the water clean? XPS allows us to answer this question because with it we can determine and quantify the presence of contaminants. The most pervasive contaminants in vacuum chambers are carbon-containing molecules, which we could determine from the carbon XPS peak (Figure 6b). This peak was estimated to correspond to less than 10% of an equivalent monolayer. We found that the amount of contamination has an influence on the extent of pre-melting (i.e., in the intensity of peak A in the XAS), but is not solely responsible for pre-melting.Reference Bluhm, Ogletree, Fadley, Hussain and Salmeron17
Interfacial chemistry
The application of APPES to studies of the composition of liquid solutions is a vastly important topic in many areas, including electrochemistry, biology, geochemistry, and atmospheric sciences.
It is thought, for example, that many tropospheric reactions associated with ozone depletion in the troposphere take place on the surface of salty droplets as a result of the segregation of halide ions to the liquid-gas interface.Reference Knipping, Lakin, Foster, Jungwirth, Tobias, Gerber, Dabdub and Finlayson-Pitts18 These droplets, which originate in the oceans, are a prevalent phenomenon in cities close to the coast. Until recently, the most detailed information about their structure came from molecular dynamic simulations, which predicted an increase in anion concentration near the surface of the droplets.Reference Jungwirth and Tobias19 Although indirect support for this prediction has been obtained using optical spectroscopies, no element-sensitive spectroscopic measurements were available in the past.
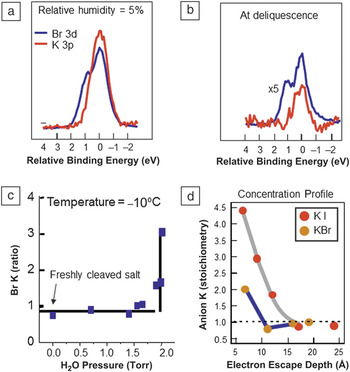
Here again, APPES is an ideal tool to study chemical and physical phenomena at the liquid-gas interface, and therefore we applied it to address the ion segregation problem.Reference Ghosal, Hemminger, Bluhm, Mun, Hebenstreit, Ketteler, Ogletree, Requejo and Salmeron20 We started the experiments by using single crystals of KBr and KI, which we cleaved in a vacuum chamber to expose their pristine (100) surfaces, that contain equal amounts of positive and negative ions. Figure 7a shows the XPS peaks of K (red) and Br (blue), which are superimposed in the graph for easy comparison. Although for a given photon energy, these peaks have different kinetic energies, the synchrotron x-ray energies can be tuned for each element to produce photoelectrons of the same kinetic energy. The composition is somewhat smaller than the expected 1:1 ratio, due to unavoidable x-ray beam damage that desorbs some of the bromine.
(a) X-ray photoelectron spectroscopy (XPS) peaks of Br and K of a KBr crystal under dry conditions and (b) at the deliquescence point, when the crystal has dissolved in the condensed vapor forming a droplet. (c) Br/K ratio obtained from the XPS peak areas as a function of relative humidity. At –10°C, the deliquescence point is reached at a vapor pressure of 2 Torr, at which point the ratio increases to a value between 2 and 3. (d) Anion to cation ratio for KBr and KI in droplets of the deliquesced salts as a function of x-ray photon energy, which gives the ratio at different depths in the solution.Reference Ghosal, Hemminger, Bluhm, Mun, Hebenstreit, Ketteler, Ogletree, Requejo and Salmeron20

Water vapor is introduced into the chamber and peak intensities are measured as a function of the humidity until the deliquescence point is reached (Figure 7b). This is the relative humidity value, where a saturated salt solution is in equilibrium with the vapor. At a temperature of –10°C, the deliquescence point occurs at 2 Torr. Not surprisingly, upon reaching this pressure, the KBr crystal dissolved abruptly, producing a liquid droplet. The XPS peaks obtained after this (Figure 7c) show that the ratio of Br to Kr increased substantially, providing direct proof of the theoretical predictions. A similar result was obtained for KI, although in this case, the I segregation was even larger, again in line with the predicted increase with anion polarizability. Thanks to the ability to change the photon energy in the synchrotron to excite photoelectrons of increasing energy, we could probe deeper inside the solution to measure the anion/cation ratio. The results as a function of increased photon energy are plotted in Figure 7d. They show that the ratio decreases to the bulk 1:1 value after a depth of approximately 15 Å. These experiments provided rich quantitative information that can be used to test and refine models and interaction potentials for a better understanding of the important chemical and physical phenomena at the surface of liquid solutions.
Conclusions and future perspectives
The ambient pressure photoelectron spectroscopy technique (APPES) has demonstrated great potential to solve important problems in disciplines ranging from chemistry and catalysis, to environmental phenomena. This is illustrated with several examples, including the phase diagrams of solid-gas reactions, the structure of surfaces in gas environments near atmospheric gas pressures, the melting of ice, the study of wetting films, and the surfaces of liquid solutions. APPES has helped to bridge the “pressure gap” in surface science, opening the way to realistic environment studies. Many synchrotron facilities in the world have installed APPES end stations or are in the process of doing so.
Acknowledgments
This is the work of a large number of students and postdoctoral researchers in my group and of collaborations with many colleagues in various fields, which would be long and difficult to mention here. Their names appear in the many publications that have resulted from it and are cited here. I am fortunate to have enjoyed the support of the Laboratory Director and of the Advanced Light Source, the Berkeley Synchrotron, during the development and commissioning stages of the APPES project. I also want to thank the Department of Energy, Office of Basic Energy Sciences, Division of Materials Sciences and Engineering of the United States, currently under Contract No. DE-AC02–05CH11231, for its support of my research for more than 30 years.

Miquel Salmeron is a senior scientist at the Lawrence Berkeley National Laboratory in the Materials Science Division, which he directed until August 2012. He is also an adjunct professor in the Materials Science and Engineering Department at the University of California, Berkeley. Salmeron graduated with a degree in physics from the University of Barcelona and obtained his PhD degree in physics from the Autonomous University of Madrid, Spain. His research focuses on the structure, reactions, and mechanical properties (friction, lubrication) of materials surfaces and nanomaterials. He pioneered the development of scanning tunneling microscopy for studies of materials surfaces in vacuum and in atmospheric pressures of gases and liquids. He also developed x-ray photoelectron spectroscopy for studies under gases at ambient pressures. His research interests include the atomic scale origin of friction, nanoparticle structure and reactivity, solid-electrolyte interfaces for energy storage applications, and electronic properties of organic films. Salmeron received the Outstanding Research and the Outstanding Scientific Accomplishment Awards from the US Department of Energy in 1995. He has been a Fellow of the American Physical Society since 1996 and of the American Vacuum Society since 2003. In 2008, he received the Medard Welch Award of the American Vacuum Society and the Langmuir Lectureship Award of the American Chemical Society. Salmeron can be reached by email at mbsalmeron@lbl.gov.