Introduction
There is a flourishing literature aimed at better understanding and measuring economic insecurity. The precise concept of economic insecurity has not been agreed upon, and policy discussions use different definitions and methods to measure it. The influential report on social progress by Stiglitz et al. (Reference Stiglitz, Sen and Fitoussi2009) defined economic insecurity as uncertainty about the material conditions that may prevail in the future, which may generate stress and anxiety. In a more general definition, Bossert and D'Ambrosio (Reference Bossert and D'Ambrosio2013: 1018) define economic insecurity as ‘the anxiety produced by the possible exposure to adverse economic events and by the anticipation of the difficulty to recover from them’. These authors look at the economic insecurity experienced at the individual level instead of any demographic group or country level as is usual in the policy debates. In this paper, we also look at individual insecurity and focus our attention on a rather unexplored dimension: pension insecurity. We attempt to capture pension insecurity based on perceived probability that the government will reduce the generosity of pensions of the individual before retirement or will increase the statutory retirement age. The idea behind this is that the individual who is at an advanced stage of the life-cycle will not have enough time to adequately respond to an adverse policy change in pension regulations (e.g. by increasing savings), which will cause worry and stress. The reduction of future pensions involves a lower level of consumption and living standards, while the obligation to work extra years means a decrease in leisure. Given that present consumption is more valuable than future consumption from the individual's view, a rise in the statutory age of retirement may cause a loss of wellbeing. Our hypothesis is that the probability of losing future consumption and/or leisure due to a change in rules will cause a deterioration in the wellbeing of the individuals who are approaching retirement.
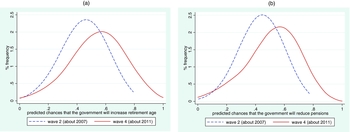
The data used for the empirical analysis are the second and fourth wave of the Survey of Health, Ageing and Retirement in Europe (SHARE) which correspond to 2007 and 2011, i.e. the years before and after the economic crisis. Indeed, this paper is motivated by the patterns depicted in Figures 1a and 1b. These figures show a sharp difference in pension insecurity before and after the economic crisis. The distribution of the subjective probability that the government will adversely affect pension rights clearly indicates higher pension insecurity in 2011 than in 2007.
(a) Predicted probability that the government will increase the retirement age in the future; (b) Predicted probability that the government will reduce pensions in the future

The variation of pension insecurity during the period of analysis offers the opportunity to study the relationship between pension insecurity and subjective wellbeing. We argue that changes in economic conditions affect the formation of subjective probabilities about the response of the government regarding pension rules in the future and, through this channel, subjective wellbeing. It is expected that policies implemented after the economic crisis, such as budget cuts on social expenditures and reduction of safety nets, will also trigger the belief that the government will go further with its austerity measures and will reduce pensions and/or delay retirement. A decrease in pensions can weaken the efforts to fight poverty in old age because pension income represents a large share of total old age income and significantly reduces poverty and income inequality (Marx et al., Reference Marx, Nolan, Olivera, Atkinson and Bourguignon2015). This view is also perceived by European citizens. Results from the opinion survey Eurobarometer (European Commission, 2012) report a large share (57 per cent) of Europeans worrying that their income in old age will be insufficient to live in dignity. This share increased from 50 per cent in July 2009 to 57 per cent in December 2011 in the EU-27, and shows notable differences by country. For example, in Greece, Italy and Portugal, the concern about old age income rose from 60–62 per cent to 75–80 per cent between 2009 and 2011, while in Austria, Finland and the Netherlands, it increased from 28–32 per cent to 36–37 per cent. This paper attempts to improve the understanding of the effects of pension insecurity and allow policy makers to better recognise and understand the demand of pension policies in their countries and offer better policy responses.
We study the relationship between pension insecurity and life satisfaction, which is a widely used measure of subjective wellbeing (Krueger and Schkade, Reference Krueger and Schkade2008) by means of linear regression models (OLS), quintile regressions and Instrumental Variables (IV). Our results indicate a statistically significant, stable and negative association between pension insecurity and life satisfaction. The paper is organised as follows. The next section provides a background on subjective wellbeing and pension reforms in Europe. Section 3 presents the data and methods. Section 4 presents and discusses the results. Finally, section 5 provides a conclusion.
Background
Pension reforms and the economic crisis
In the course of the 2008 economic crisis, governments recorded a sharp increase of public budget deficits due to reduced tax revenues and increased spending on unemployed and inactive individuals (OECD, 2014). As a result, many European countries were under pressure to enact budget cuts on social expenditure and increase taxes or contributions to social protection systems. The sustainability of pension systems is challenged by demographic change and had been therefore under scrutiny even before the crisis. Increased life expectancy and lower fertility rates led to more pensioners, but fewer contributors. The upcoming retirement of the baby-boomer cohorts will aggravate this development. Additionally, past cohorts entered retirement under favourable conditions, which allowed them to exit the labour market quite early without high deductions.
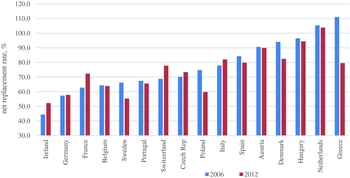
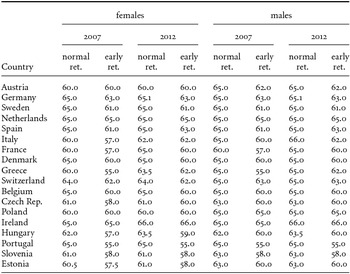
The economic crisis accelerated the need to implement pension policy reforms as quickly as possible since pensions represent a large share of social security spending. In most European countries, austerity measures included the increase of early and normal retirement ages (see Table A1 of the Appendix). In other countries, reforms were already on the agenda and reform planning was accelerated (e.g. Germany and Netherlands). In several countries, early retirement schemes were abolished or suspended before or in the course of the crisis (Denmark, Netherlands, Poland, Ireland and Portugal). Furthermore, the pension model simulations from the OECD, which include the most recent changes in pension rules, indicated a deterioration of pension replacement rates in several countries (OECD, 2007; OECD, 2013). Figure 2 shows the magnitude of these changes between 2006 and 2012. For example, Greece is the country that has experienced the greatest fall in the pension replacement rate, with a decrease of about 30 per cent during this time.
Net pension replacement rates

Policy changes due to the crisis often did not correspond to the country's welfare regimes or to partisan politics (Starke et al., Reference Starke, Kaasch and Van Hooren2014; Shahidi, Reference Shahidi2015). Rather, the reactions of the governments were dependent on the particular national impact of the economic crisis and the already established generosity of the welfare state. No straightforward pattern of expansion or retrenchment was found to be visible.
Most of the pension measures have been introduced to maintain financial sustainability, but sometimes this means a loss of income adequacy in old age provisions (OECD, 2014). Among other European countries, especially in Eastern Europe, the third pillar (voluntary pension plans) was reinforced after the recession to overcome funding gaps in transitional systems like the Pay-As-You-Go system (Drahokoupil and Domonkos, Reference Drahokoupil and Domonkos2012). The same applies for South European countries (Natali and Stamati, Reference Natali and Stamati2014). The reinforcement of private pensions (compulsory occupational plans or voluntary third pillar plans) is not necessarily fostering inequality in old age (Ebbinghaus and Neugschwender, Reference Ebbinghaus, Neugschwender and Ebbinghaus2011). However, persons at risk of old age poverty are those with a non-standard employment career, low-income households and women, as they might not be able to accumulate resources and invest in private pensions or other ways of savings. Furthermore, while younger cohorts have more time to adapt to new pension systems and/or accumulate other types of savings, individuals that will retire in the foreseeable future are at risk of needing to work longer or receive lower pensions.
Pension plans and subjective wellbeing
Next to policy changes, the economic crisis also affected individual retirement behaviour. Studies based on the Health and Retirement Survey (HRS) find differences in retirement behaviour, namely postponing retirement and working longer (Szinovacz et al., 2014; Hurd and Rohwedder, Reference Hurd and Rohwedder2011). Parker et al. (Reference Parker, Carvalho and Rohwedder2013) report that expecting lower pension benefits is associated with plans to retire later instead of opting for early retirement. Interestingly, this last paper relates pension plan decisions to the level of individual cognitive abilities and finds that individuals with better cognitive abilities tend to retire later. Contrary to these studies, Munnell and Rutledge (Reference Munnell and Rutledge2013) report that more senior workers were laid off in the 2008 economic crisis and subsequent Great Recession than in previous recessions, and many of them accelerated their retirement. In the case of Europe, the analysis of the SHARE dataset reveals that the economic crisis is associated with a lower likelihood of retirement of the European older workers (Meschi et al., Reference Meschi, Pasini, Padula, Börsch-Supan, Brandt, Litwin and Weber2013) and a deterioration of health (Bucher-Koenen and Mazzonna, Reference Bucher-Koenen, Mazzonna, Börsch-Supan, Brandt, Litwin and Weber2013). Meschi et al. (Reference Meschi, Pasini, Padula, Börsch-Supan, Brandt, Litwin and Weber2013) show that the direct transition from unemployment to retirement increased notably after the crisis.
Changes in pension regulations may have visible and strong effects on middle age workers. For example, considering the 2006 Dutch pension reform as a natural experiment and exploiting the exogenous variation of changes in pension rights for some cohorts, some studies present robust evidence for strong and negative effects of regulatory changes on job satisfaction and mental health (De Grip et al., Reference De Grip, Lindenboom and Montizaan2012; Montizaan and Vendrik, Reference Montizaan and Vendrik2014). Also in the US, deviation from the expected retirement plans shows negative effects for subjective well-being (Falba et al., Reference Falba, Gallo and Sindelar2009; Clarke et al., Reference Clarke, Marshall and Weir2012).
All these findings suggest that older workers have revised or are in the process of revising their retirement plans. It seems clear that the economic crisis has prompted a reduction in pension generosity. It could also be the case that changes in pension policies are not yet in place in some countries, but the individuals are anticipating the implementation of public policies that will cut old age expenditures. In any case, the evidence presented above is clear about the negative effects of changes in retirement plans on the wellbeing of older workers. In general, different forms of economic insecurity have a negative effect on subjective wellbeing. In this regard, job insecurity is a well-studied type of economic insecurity. It has been found that job insecurity leads to lower life satisfaction (Carr and Chung, Reference Carr and Chung2014; Silla et al., Reference Silla, de Cuyper, Gracia, Peiró and de Witte2009), lower job satisfaction (Artz and Kaya, Reference Artz and Kaya2014; Lange, Reference Lange2013), more mental health complaints (Hellgren and Sverke, Reference Hellgren and Sverke2003; Modrek et al., Reference Modrek, Hamad and Cullen2015; László et al., Reference László, Pikhart, Kopp, Bobak, Pajak, Malyutina, Salavecz and Marmot2010) and more depression (Burgard et al., Reference Burgard, Kalousova and Seefeldt2012; Meltzer et al., Reference Meltzer, Bebbington, Brugha, Jenkins, McManus and Stansfeld2010). Although some studies analyse the effects of changes in pension regulations, there is a lack of research on pension insecurity and its effects on the wellbeing of older workers. By tackling this question, our study contributes to the literature of economic insecurity and subjective wellbeing.
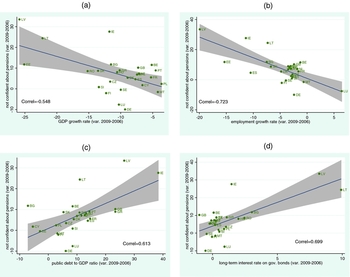
Regarding the effects of changes of macro variables on subjective wellbeing, Deaton (Reference Deaton2012) has documented that life satisfaction in the US was closely related to the evolution of stock market indices during and after the economic crisis. This was particularly significant for individuals close to retirement and participating in funded pension systems because the crisis affected their expected old age income. Hershey et al. (Reference Hershey, Henkens and van Dalen2010) found that income inequality and a higher expected old age dependency ratio are associated with more worries about retirement income in Europe. Lübke and Erlinghagen (Reference Lübke and Erlinghagen2014) show for 19 European countries that individual job insecurity is related to economic situation and country specific context. In Europe, macro fluctuations can also affect the confidence of the individuals in the future of their pensions. Figures 3a–3d show a high correlation between changes (before and after the crisis) in relevant macro outcomes and changes in perceptions about confidence in the future of pensions in the country. For example, those countries where the decrease in employment growth rate was larger also experienced a larger increase in the variation of the share of individuals that reported being unconfident about the future of their pensionsFootnote 1 .
(a) Unconfident about the future of pensions and GDP growth rate (variation 2006–2009); (b) Unconfident about the future of pensions and employment growth rate (variation 2006–2009); (c) Unconfident about the future of pensions and public debt to GDP ratio (variation 2006–2009); (d) Unconfident about the future of pensions and long-term interest rate on gov. bond (variation 2006–2009)

Data and methods
The data
We use the second and fourth wave of the Survey of Health, Ageing and Retirement in EuropeFootnote 2 . This dataset is composed of nationally representative samples of individuals aged 50 and over with comparable information. Our sample is composed of 15,389 individuals who are not yet retired in 18 European countries (Austria, Germany, Belgium, Czech Republic, Denmark, Estonia, France, Greece, Hungary, Ireland, Italy, Netherlands, Poland, Portugal, Slovenia, Spain, Sweden and Switzerland). Wave 2 was collected in 2006/2007 and wave 4 in 2011/2012. Even though some countries have longitudinal data in SHARE, this feature cannot be exploited because pension insecurity is asked only during the first wave of participation. The analytical sample therefore includes a single observation for each individual, taken from either the wave 2 or 4 of SHARE.
Variables
As we are interested in finding the predictors of life satisfaction, the dependent variable employed in our regression analysis is drawn from the question ‘On a scale from 0 to 10 where 0 means completely dissatisfied and 10 means completely satisfied, how satisfied are you with your life?’. The variables age, sex, married or living with a partner and years of education control for socio-demographic background. The number of diagnosed chronic diseases is a proxy for health. Economic variables are income, a dummy indicating whether a person is currently employed or not, and home ownership. The income corresponds to the log of reported household net income equivalised with the square root of the number of members in the household and adjusted by purchasing power parity and prices of the year 2011. Home ownership is included as a proxy for wealth.
Pension insecurity is captured with the questions ‘What are the chances that before you retire the government will reduce the pension which you are entitled to?’ and ‘What are the chances that before you retire the government will raise your retirement age?’ In both questions, the individual must indicate a number between 0 and 100. We argue that these items can capture pension insecurity because they involve notions that emphasise the aspect of stress/anxiety due to uncertainty about economic conditions in the future and potential loss. The literature about insecurity stresses also the aspects of loss and threat, which generate insecurity (Gallie et al., Reference Gallie, Felstead, Green and Inanc2016; Greenhalgh and Rosenblatt, Reference Greenhalgh and Rosenblatt1984). While our items are not asking about the feeling of insecurity directly, the first item measures an expectation of a potential loss of pension. A reduction in pension is certainly connected to the worry of economic hardship in the future. The second item measures a threat to expectations for retirement planning and a loss of leisure. The increase of the age of retirement may reduce the economic wellbeing of the individual because individuals value present consumption more than future consumption. It addresses more the threat perception and the powerlessness to counteract it, since the increase of retirement age cannot be influenced by the individual. As pension insecurity is a fairly new topic in the literature of insecurity, we are adjusting already established concepts to our data.
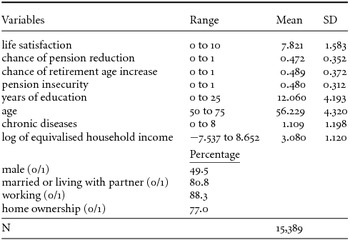
As insecurity is a multidimensional concept, more than one variable is needed to grasp the variation in insecurity (Greenhalgh and Rosenblatt, Reference Greenhalgh and Rosenblatt1984). The aggregation of different dimensions into a joint indicator of insecurity is a standard practice in job insecurity research (Gallie et al., Reference Gallie, Felstead, Green and Inanc2016; Hellgren and Sverke, Reference Hellgren and Sverke2003; Silla et al., Reference Silla, de Cuyper, Gracia, Peiró and de Witte2009). In the case of pension insecurity, we perform a principal component analysis of both mentioned items and predict the first component (explain 74.5 per cent of the variance) as a single latent factor that represents the perceived difficulties of the future regarding a safe and steady pension provision. We labelled this variable pension insecurity Footnote 3 . Table 1 reports the descriptive statistics of the assessed variables.
Descriptive Statistics

Empirical strategy
We run OLS regression models with the pooled data of SHARE. The main specification is as follows:
 $$\begin{equation}
{y_{ict}} = {\beta _0} + {\beta _1}{X_{ict}} + {\beta _2}{Z_{ict}} + {\theta _c} + {\delta _t} + \gamma {X_{ct}} + {\varepsilon _{ict}}
\end{equation}$$
The left-hand side variable yict indicates individual life satisfaction. The subscripts i, c and t represent the individual, country and year, respectively. Xict is our variable of interest and measures pension insecurity as defined above. The set of variables included in Zict are controls typically used in the empirical literature of life satisfaction. We include dummies for countries, years and their interactions in order to control for country specific effects, general time trends, and country-year specific effects. All variables, except dummies, are previously standardised with mean equal to zero and standard deviation equal to one. Note that our results must be interpreted as associations instead of causality from pension insecurity to life satisfaction, although we will enrich our analysis by breaking down the model equations by quintiles of different and relevant variables.
Further, we use another measure of subjective wellbeing available in SHARE. This is a form of eudemonic wellbeing that measures overall quality of life and is captured with the instrument CASP-12 (Control, Autonomy, Self-realisation, Pleasure, see Hyde et al., Reference Hyde, Wiggins, Higgs and Blane2003, and Wiggins et al., Reference Wiggins, Higgs, Hyde and Blane2004). Individuals answer how often they experience 12 different feelings and situations on a 4-point scale. A higher score means a better level of subjective wellbeing. Not surprisingly, the correlation of CASP-12 with life satisfaction is high at 0.55.
In a last step, we employ an instrumental variable (IV) approach to address the potential endogeneity of insecurity and subjective wellbeing. The use of IV can mitigate the problems of omitted variable bias, reverse causality and measurement error. For example, individuals who report low subjective wellbeing can also be more prone to express pessimistic views about the future and, hence, are more likely to report a high probability that the government will reduce the generosity of their pensions. Given the availability of certain administrative information that is exogenous to subjective wellbeing, we can perform IV regressions and explore the robustness of the effect of pension insecurity on subjective wellbeing. One of the instruments will be a variable equal to the statutory retirement age specific to the country, year and sex (see Table A1 of the Appendix) minus the age of the individual. We rely on these variations as a valid instrument for pension insecurity. We expect that the individuals whose age is more distant from the statutory retirement age will feel more pension insecurity. The reason is that this variable is a proxy for a situation in which the statutory age has increased thus extending the length of time to work before retirement. Another IV is the government net lending position over GDP which indicates the amount of financial assets available for lending (if positive) or borrowing (if negative) to finance the government expenditures that are in excess of revenues. A high deficit will indicate problems with the sustainability of public finances. This variable was extracted from the OECD and is country and year specific. We expect that pension insecurity is negatively correlated with net lending position.
While we tried to control for endogeneity of life satisfaction and the subjective measures of insecurity, we cannot rule out a selection bias concerning the sample. As we studied only individuals aged 50 and older, there might be a selection of those that stayed in the labour market. Persons who already left the labour market due to early retirement are not identifiable. Hence, the relation of insecurity and life satisfaction could be even stronger and our results have to be interpreted at a lower bound estimate.
Results
Main results
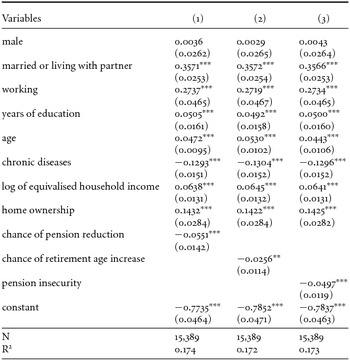
The main results of the estimates for life satisfaction are shown in Table 2. Note that the third column includes our variable of interest, i.e. the latent variable of pension insecurityFootnote 4 . In general, the covariates of each model show the usual associations with life satisfaction. Income is positively associated with life satisfaction. Approximately, the increase of one standard deviation (SD) in the log of income is associated with an increase of 0.06 SD in life satisfaction. Similarly, wealthier individuals – proxied by home ownership – show more satisfaction with life. One SD increase of age or educational attainment increases life satisfaction by 0.05 SD. By contrast, being affected by more chronic diseases is associated with less life satisfaction. There is a decrease of about 0.13 SD in life satisfaction for each SD increase in the number of diseases. Being employed shows a significant association with life satisfaction. Transiting from unemployment or inactivity to employment can increase life satisfaction by 0.27 SD. Being married or living with a partner notably increases life satisfaction by about 0.36 SD. The results show that the relationship between pension insecurity and life satisfaction is negative and significant: an increase of one SD in pension insecurity is associated with a reduction of 0.05 SD in life satisfaction.
OLS estimates of life satisfaction

All specifications include year and country dummies and their interactions. Pension insecurity is the first component of a PCA of both chances of pension changes in the future. All variables, except dummies, are standardised with mean zero and SD equal to one. Robust clustered (by country) errors are in parentheses.
* p < 0.10, ** p < 0.05, *** p < 0.01.
Results by quintiles
Generally, pension reforms are targeted at individuals who are not too close to retirement age in order to avoid a drastic reduction of pension rights and minimise social and political opposition. If this holds, then we can expect differential effects of pension insecurity on life satisfaction depending on how far the individual is from retirement age. As a consequence, individuals whose age is nearer to retirement age can feel more confident that they will not be affected by regulatory changes, while younger individuals may feel more worried. Depending on the institutional and economic conditions of the country, it is also plausible that the close-to-retirement individuals may experience insecurity about their future pensions because they will not have enough time to adjust their savings to keep a desirable living standard in old age. This is particularly relevant in countries where retirement at legal age is compulsory, and labour beyond retirement is heavily taxed or not permitted. Furthermore, we can expect that younger individuals will be less concerned with pension changes because either they have time to adjust their savings and labour decisions or they are myopic about the future. In any case, these conjectures can only be valued empirically.
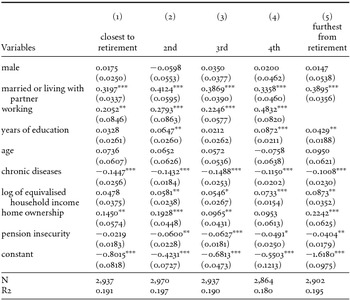
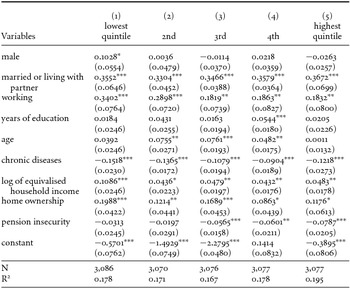
Table 3 shows the life satisfaction estimates of models resulting from categorising the sample by quintiles of years to reach retirement ageFootnote 5 . Once the individuals are categorised into quintiles of these years, we run the same main model regression for each quintile and report the results in Table 3. The first column corresponds to the individuals who are closer to retirement (average age is 60.7 years) while the last column corresponds to the individuals for whom retirement will occur later (average age is 51.6 years). We observe that pension insecurity is statistically significant and negatively related to life satisfaction for every quintile except for the oldest quintile. Individuals of the third quintile are 55.2 years old on average and show the biggest association between pension insecurity and life satisfaction: an increase of one SD in pension insecurity is associated with a reduction of 0.063 SD in life satisfaction. As we postulated earlier, it is possible that the individuals who are very near to retirement are not affected by pension insecurity because the changes in pension regulations are not intended for them. Changes in age eligibility and replacement rates are in general aimed at workers that are not too close to statutory retirement ages. This is why we observe a larger effect of pension insecurity on life satisfaction among the younger individuals.
OLS estimates of life satisfaction per years to reach retirement quintiles

All specifications include year and country dummies and their interactions. Pension insecurity is the first component of a PCA of both chances of pension changes in the future. All variables, except dummies, are standardised with mean zero and SD equal to one. Robust clustered (by country) errors are in parentheses.
* p < 0.10, ** p < 0.05, *** p < 0.01.
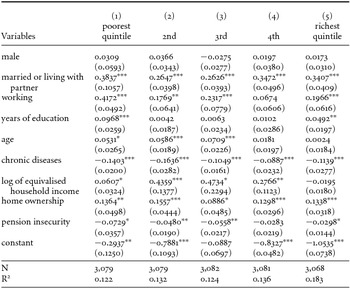
Because economic resources can protect individuals from unexpected pension regulatory changes and allow them to absorb large fluctuations of consumption in old age, we expect to find a lower effect of pension insecurity on life satisfaction for wealthier individuals. The regressions presented in Table 4 correspond to samples of individuals categorised in income quintiles. In all groups, pension insecurity is negatively associated with life satisfaction, with the effect being largest in the poorest quintile. An increase of one SD of pension insecurity in the poorest and richest quintile is associated with a reduction of 0.073 SD and 0.03 SD in life satisfaction, respectively. Pension insecurity has a greater effect on the subjective wellbeing of the poor. Therefore, our results provide evidence for another vehicle of the negative effects of the 2008 economic crisis on subjective wellbeing outcomes.
OLS estimates of life satisfaction per income quintiles

All specifications include year and country dummies and their interactions. Pension insecurity is the first component of a PCA of both chances of pension changes in the future. All variables, except dummies, are standardised with mean zero and SD equal to one. Robust clustered (by country) errors are in parentheses.
* p < 0.10, ** p < 0.05, *** p < 0.01.
It has been shown that expectations about how long we will live play a role in retirement and saving decisions and have a significant predictive power for mortality (Hurd and McGarry, Reference Hurd and McGarry2002). In a recent paper with HRS data, Parker et al. (Reference Parker, Carvalho and Rohwedder2013) report that those individuals expecting to live longer intend to retire later as well, which is consistent with the goal of trying to keep a desirable living standard during an extended length of life. In Europe, Peracchi and Perotti (Reference Peracchi and Perotti2014) find that subjective survival probabilities are higher for individuals who are richer, more educated and healthier, which suggests that income and health are important in the formation of subjective survival evaluations. Our sample of individuals also answer a question intended to capture subjective life survival expectancy: ‘What are the chances that you will live to be age 75/80/85/90. . .?’ Therefore, we are able to categorise individuals according to quintiles of subjective life survival. Respondents who are younger than 65 are asked for their estimated chance of living up to a target age of 75, for those aged 65–69 this target age is 80, for those aged 70–74 this target age is 85 and so on. In order to take into account the differences in subjective longevity related to age, we divide the individual survival expectation by the corresponding official probability, extracted from the Life Tables of Eurostat (which are age, sex, year and country specific). This means that the SHARE's subjective survival expectation has been normalised to official life tables, which is similar to the procedure used by Parker et al. (Reference Parker, Carvalho and Rohwedder2013). After this adjustment, we compute quintiles of the subjective probability of survival and run regressions for each quintile.
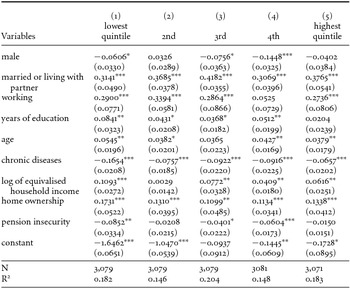
Table 5 shows the results per quintile of subjective survival. The lowest quintile includes the individuals whose beliefs about their survival rates are the smallest. On average, the individuals of this quintile consider their survival rate to be only 41 per cent of the official survival rate, while the individuals of the highest quintile believe that their survival rate is 36 per cent larger than their corresponding official survival rates. Pension insecurity is negatively related to life satisfaction and only significant in the first, third and fourth quintile. For the individuals in the lowest quintile, the effect of pension insecurity is considerable. An increase of one SD in pension insecurity is associated with a decrease of 0.09 SD in life satisfaction. Not surprisingly, the effect of the number of chronic diseases is the largest within this group: an increase of one SD in the number of diseases is associated with a decrease of 0.17 SD in life satisfaction. As underestimated life expectancy may be closely related to poor health, the results show that pension insecurity is more salient for the less healthy individuals.
OLS estimates of life satisfaction per subjective life survival quintiles

All specifications include year and country dummies and their interactions. Pension insecurity is the first component of a PCA of both chances of pension changes in the future. All variables, except dummies, are standardised with mean zero and SD equal to one. Robust clustered (by country) errors are in parentheses.
* p < 0.10, ** p < 0.05, *** p < 0.01.
Parker et al. (Reference Parker, Carvalho and Rohwedder2013) highlight the importance of cognitive abilities on sound decisions about retirement and savings. They find that individuals with better cognitive abilities tend to retire later because they are able to better understand the negative financial consequences of early retirement on future living standards. Furthermore, less cognitively able individuals show more inconsistent retirement decisions, which calls for the need to assist with financial planning. Financial literacy is an increasingly important topic in the literature that attempts to explain poverty in general, and old age poverty in particular (see e.g. Lusardi and Mitchell, Reference Lusardi and Mitchell2008 and Reference Lusardi and Mitchell2014; van Rooij et al., Reference van Rooij, Lusardi and Alessie2012). Banks et al. (Reference Banks, Crawford and Tetlow2015) have shown that financial literacy in old age can lead to obtaining better annuities in the UK pension system. We construct quintiles of cognitive ability with the first component of a Principal Component Analysis (PCA) of four tests of cognitive functioning available in SHARE (immediate and delayed memory recall, verbal fluency and numeracyFootnote 6 ). Table 6 reports the differential effects of pension insecurity by quintile of cognitive ability.
OLS estimates of life satisfaction per cognitive score quintiles

All specifications include year and country dummies and their interactions. Pension insecurity is the first component of a PCA of both chances of pension changes in the future. All variables, except dummies, are standardised with mean zero and SD equal to one. Robust clustered (by country) errors are in parentheses.
* p < 0.10, ** p < 0.05, *** p < 0.01.
Pension insecurity is not statistically associated with life satisfaction for the two lowest quintiles of cognitive ability but it is a significant predictor for the other quintiles. In addition, the size of the negative association between pension insecurity and life satisfaction increases for each quintile. For example, one SD increase of pension insecurity is associated with a 0.08 SD decrease in life satisfaction for the individuals in the top 20 per cent of the cognitive ability distribution, but this effect is not different from zero for those in the bottom 40 per cent. This finding may suggest that the individuals with higher cognitive abilities are more aware of or more able to understand the consequences of changing pension rules on their future sources of old age income, and in this way experience a decline in subjective wellbeing. The underestimation of the effects of increasing pension insecurity in the group of less cognitively able individuals leaves life satisfaction unaffected, but it is at least worrying that these individuals could be taking suboptimal decisions based on limited rationality. Bissonette and van Soest (Reference Bissonette and van Soest2012) point out that overly optimistic beliefs may lead to under-saving in pensions. In the same way, our results for the less cognitively able individuals indicate that their decisions concerning retirement, pensions, savings and labour could be potentially misguided. Bonsang and Dohmen (Reference Bonsang and Dohmen2015) have found, with SHARE data, that risk aversion increases with age and that age-related variation in risk attitude is largely explained by cognitive decline. Therefore, it will be difficult, even for older individuals with better cognitive functioning, to fully adapt to the risks involved by the change of pension rules.
In liberal type countries, like the US and the UK, public pension provisions are usually complemented with private and occupational pension plans, while in many of continental European countries the retirees mostly receive only public pensions as an old-age income (Christelis et al., Reference Christelis, Jappelli, Paccagnella and Weber2009). Of course, individuals may have other sources of wealth in old age, but some studies suggest that the participation of pension wealth within the total wealth of individuals is sizeable. These studies (Frick and Grabka, Reference Frick, Grabka, Gornick and Jantti2013; Crawford and Hood, Reference Crawford and Hood2016; Wolff, Reference Wolff2007) roughly define pension wealth as the present value of the expected pension streams. For example, Frick and Grabka (Reference Frick, Grabka, Gornick and Jantti2013) show that 57 per cent of the wealth of German retirees corresponds to pension wealth, while the rest is mostly composed of housing wealth. For the total population, these authors find that 95 per cent and 87 per cent of the wealth of individuals placed, respectively, in the fourth and fifth decile of the distribution of wealth corresponds to pension wealth. The importance of public pension provision in Europe has also been stressed by the estimation of sizeable crowding-out effects of public pension wealth on household savings (Alessie et al., Reference Alessie, Angelini and van Santen2013).
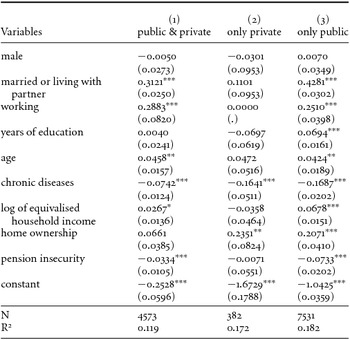
Some individuals have other types of savings and pension plans for old age and not only public pensions and hence will be less affected by changes in public pension rules. For this reason, we run model regressions in samples of individuals who expect private and public pensions, only private pensions, or only public pensions (Table 7). The results clearly show that pension insecurity has a larger detrimental effect on wellbeing for the individuals who rely only on public pensions, which is about two times the effect in the case of individuals who expect both private and public pensions. The table also shows that pension insecurity does not play a role in the wellbeing of the individuals that only expect private pensions, which is obvious.
Pooled OLS estimates of life satisfaction per type of pension entitlement

All specifications include year and country dummies and their interactions. Pension insecurity is the first component of a PCA of both chances of pension changes in the future. All variables, except dummies, are standardised with mean zero and SD equal to one. Robust clustered (by country) errors are in parentheses.
* p < 0.10, ** p < 0.05, *** p < 0.01.
Robustness checks
Another measure of subjective wellbeing
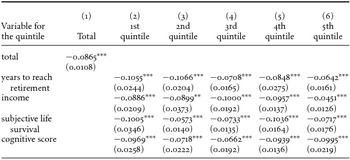
In the following, we will implement the same type of regression analysis we performed in the previous section but this time we replace the dependent variable of life satisfaction by the CASP-12 variable. Table 8 summarises the results of these regressions and only reports the coefficients for pension insecurity.
Pension insecurity estimates of eudemonic wellbeing (CASP-12)

Each cell represents a different regression of eudemonic wellbeing (CASP-12) and contains the coefficient of pension insecurity and its robust clustered (by country) standard error. All specifications include year and country dummies and their interactions. Pension insecurity is the first component of a PCA of both chances of pension changes in the future. All variables, except dummies, are standardised with mean zero and SD equal to one.
* p < 0.10, ** p < 0.05, *** p < 0.01.
Each cell of Table 8 represents a different regression and only shows the coefficient of pension insecurity. The first column shows a significant and negative effect of pension insecurity on eudemonic wellbeing. One SD increase of pension insecurity is associated with a 0.09 SD decrease in the score of eudemonic wellbeing, which is even larger than the effect of life satisfaction reported above (i.e. 0.05 SD). Columns 2 to 6 show the effect of pension insecurity in each quintile of different variables. Different from the results on life satisfaction, we observe that the eudemonic wellbeing levels of individuals whose age is closer to retirement age are more affected by pension insecurity than those whose age is further from retirement. Similar to before, pension insecurity is more salient to explain a deterioration of eudemonic wellbeing in the group of poorer individuals than in the group of wealthier individuals. In the case of subjective life survival rate, the effect of pension insecurity is stronger for the individuals who believe their subjective survival rate is the lowest. The results obtained for the quintiles of cognition do not show a consistent pattern between pension insecurity and eudemonic wellbeing.
Instrumental variables
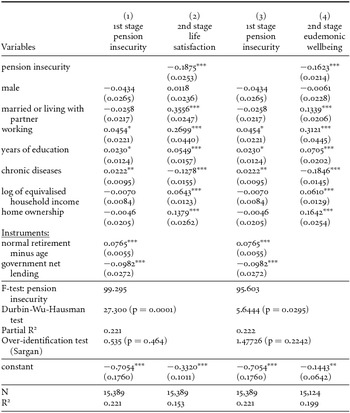
Table 9 shows the results of the IV regressions for life satisfaction and the eudemonic wellbeing measure. The results of the Durbin-Wu-Hausman test at the bottom of Table 9 indicate that we can reject the null hypothesis that pension insecurity is exogenous. Therefore, the IV estimates can be rated as more efficient than the OLS estimates. The F-statistic is considerably larger than the rule of thumb of 10 (Stock et al., Reference Stock, Wright and Yogo2002) and confirms the strength of our instruments. The over-identification test assesses if the instruments are invalid instruments and whether the structural equation is incorrectly specified. In both sets of dependent variables, the results of the Sargan and Barman tests (although the last one is not reported) are statistically not significant and, therefore, we cannot reject the null hypothesis that our instruments are valid. In addition, in the first stage, we find the expected results of the instruments on pension insecurity: i) the variable retirement age minus age is positively correlated with pension insecurity, and ii) a deterioration of public finances is correlated with an increase of pension insecurity. Importantly, the effect of pension insecurity on subjective wellbeing is significant and negative. This effect is -0.187 SD and -0.162 SD for the life satisfaction and the eudemonic wellbeing measure, respectively.
Instrumental variables of subjective wellbeing

Year and country dummies are included. Pension insecurity is the first component of a PCA of both chances of pension changes in the future. All variables, except dummies, are standardised with mean zero and SD equal to one. Robust clustered (by country) errors are in parentheses,
* p < 0.10, ** p < 0.05, *** p < 0.01.
Conclusions
This paper has proposed and explored a concept of pension insecurity as a specific form of economic insecurity suffered by individuals who, being at advanced stages of the life-cycle, will not have enough time to adequately respond to an adverse policy change in pension rules. In particular, we investigate how pension insecurity is connected to subjective wellbeing in a European population. We claim that pension insecurity decreases life satisfaction of the individuals who are approaching retirement, which is exacerbated by unfavourable economic conditions. Indeed, opinion survey data show that worries about pensions increased after the economic crisis. Our results are in line with current research focussed on studying the effects of the economic crisis on retirement behaviour. Our findings reveal that the individuals who are more affected by pension insecurity are those who are further away from their retirement, have lower income, assess their life survival as low, have higher cognitive abilities and do not expect private pension payments. These results also hold under a variety of robustness checks. The IV estimations allow us to exploit the external variation of pension regulations and public finance conditions per country and year, and through this channel we can claim that pension insecurity is influencing wellbeing and not the other way around.
An important result is that life satisfaction is most negatively affected among poor groups. The reason is that these groups have lower savings or other forms of wealth that could protect them from future reductions of pensions. Thus, the policy changes toward reducing pensions or increasing retirement ages do affect lower income groups more than others. In addition, our results indicate that private pensions insulate higher income groups from dependencies on public policy changes. All of these suggest that pension policy changes may exacerbate socio-economic differences among elderly individuals.
We conclude that pension insecurity is another form of economic insecurity, which depends on the individual variation of resources as well as on economic conditions and eventually on the abilities of governments to balance these factors. This is salient for younger seniors today due to the recent crisis and its aftermaths, but it will also be important for the retirement of coming cohorts. What was known for decades suddenly became an emergency situation in the course of the crisis. While some countries launched stimuli to overcome the crisis immediately, e.g. Australia and Sweden, other countries changed from expansion to retrenchment (Starke et al., Reference Starke, Kaasch and Van Hooren2014). Hence, the reactions to economic crises will probably depend on the sustainability of social expenditure. The funding of pension systems will be an issue for the near future, and they are under revision in many European countries. However, with the rise of private pension systems, provisions could be increasingly dependent on market forces which could reinforce pension insecurity in the long run and reflect socioeconomic inequalities in the society.
Acknowledgments
We would like to thank the comments and suggestions made by two anonymous referees. The authors take sole responsibility for the analysis carried out in this study. Valentina Ponomarenko thanks research funding provided by the Fonds National de la Recherche Luxembourg (AFR-PHD). This paper uses data from SHARE Waves 2 and 4 (DOIs: 10.6103/SHARE.w2.260, 10.6103/SHARE.w4.111), see Börsch-Supan et al. (2013) for methodological details. The SHARE data collection has been primarily funded by the European Commission through FP5 (QLK6-CT-2001-00360), FP6 (SHARE-I3: RII-CT-2006-062193, COMPARE: CIT5-CT-2005-028857, SHARELIFE: CIT4-CT-2006-028812) and FP7 (SHARE-PREP: N°211909, SHARE-LEAP: N°227822, SHARE M4: N°261982). Additional funding from the German Ministry of Education and Research, the U.S. National Institute on Aging (U01_AG09740-13S2, P01_AG005842, P01_AG08291, P30_AG12815, R21_AG025169, Y1-AG-4553-01, IAG_BSR06-11, OGHA_04-064) and from various national funding sources is gratefully acknowledged (see www.share-project.org).
Appendix
Normal and early statutory retirement age (2007 and 2012)