






1. Introduction
The study of wall-bounded turbulent flows is still nowadays very active despite being a research topic for several decades. In the effort to understand turbulence as deeply as possible, studies have focused mostly on canonical flows (channel flows, pipe flows and flat-plate boundary layers, for instance). According to Smits (Reference Smits2020), research should focus as well on less canonical flows, not only because of their practical relevance, but also to identify how much the knowledge acquired for canonical flows applies in these flows as well. Thus wall turbulence would be understood more profoundly, and the capability to predict more general flows would be increased.
Reynolds number effects have been identified to play an important role in wall-bounded flows. Studies have shown that there exist some Reynolds-number-dependent effects, which are recalled, for instance, in the work of Smits, McKeon & Marusic (Reference Smits, McKeon and Marusic2011). Turbulent structures of long spatial scales are observable at high Reynolds numbers, with sizes of about 2–3  $\delta$ for the large-scale motions, and 5–6
 $\delta$ for the very large-scale motions in turbulent boundary layers (where
 $\delta$ corresponds to the boundary layer thickness), and they are located in the logarithmic region of the boundary layer. The effect of these structures will not go unnoticed in the profiles of mean quantities, and in particular, they are clearly observable when looking at the premultiplied turbulent-kinetic-energy production term and profiles of streamwise velocity standard deviation,
 $u_{rms}$. For the production of turbulent kinetic energy (TKE) in pre-multiplied form, a plateau develops within the boundary layer around the log region. Regarding the streamwise velocity fluctuation, the levels away from the near-wall peak increase mainly due to the large-scale turbulent structures (a secondary peak may be observable at very high Reynolds numbers; see, for instance, the work of Hultmark et al. Reference Hultmark, Vallikivi, Bailey and Smits2012). This is evidenced clearly when splitting the contribution of small-scale (smaller than
 $\delta$) and large-scale (greater than
 $\delta$) structures to
 $u_{rms}$. Also, there is an amplitude modulation of small-scale structures by the outer large-scales in the inner region of the boundary layer as found by Mathis, Hutchins & Marusic (Reference Mathis, Hutchins and Marusic2009). A review of the organisation of turbulent structures within wall-bounded flows may be found in the work of Jiménez (Reference Jiménez2013).
Another topic that is very commonly present and studied in turbulent boundary layers research is the pressure gradient. Pressure gradient effects are also responsible for some differences in the development of turbulent boundary layers. In the case of an adverse pressure gradient (APG), some of the mentioned aspects have been found to be somewhat similar to high-Reynolds-number effects, such as the increased turbulent activity in the outer part of the boundary layer due to large-scale structures, observed in the  $u_{rms}$ profile and the streamwise energy spectrum (Harun et al. Reference Harun, Monty, Mathis and Marusic2013; Kitsios et al. Reference Kitsios, Sekimoto, Atkinson, Sillero, Borrell, Gungor, Jiménez and Soria2017; Lee Reference Lee2017; Sanmiguel Vila et al. Reference Sanmiguel Vila, Vinuesa, Discetti, Ianiro, Schlatter and Örlü2020). Sanmiguel Vila et al. (Reference Sanmiguel Vila, Vinuesa, Discetti, Ianiro, Schlatter and Örlü2020) studied different boundary layers data sets under moderate APG, intending to separate pressure gradient and Reynolds number effects. They were able to identify that small-scale activity is enhanced in the outer layer by the APG, which is not the case when increasing the Reynolds number in zero pressure gradient (ZPG) (Marusic, Mathis & Hutchins Reference Marusic, Mathis and Hutchins2010). Therefore, contrary to ZPG turbulent boundary layers, small-scale activity is not universal, but it is dependent on the pressure gradient. Another important result concerns the outer peak of
 $u_{rms}$ in high-Reynolds-number ZPG turbulent boundary layers. According to Marusic et al. (Reference Marusic, Mathis and Hutchins2010), the mentioned peak is located in the centre of the logarithmic region, given by
 $y^+ = 3.9 Re_\tau ^{1/2}$ and associated to turbulent structures of length scale
 $\lambda _x \approx 6 \delta$. The symbol
 $+$ is used for variables normalised in wall units, and
 $Re_\tau = \delta u_\tau / \nu$ is the friction Reynolds number, where
 $u_\tau$ is the friction velocity, and
 $\nu$ is the kinematic viscosity. Sanmiguel Vila et al. (Reference Sanmiguel Vila, Vinuesa, Discetti, Ianiro, Schlatter and Örlü2020) found two external peaks (at sufficiently high Reynolds number): one for length scales
 $\lambda _x \approx 6 \delta$ (which corresponds to the high-Reynolds-number ZPG outer peak) and another one for smaller length scales
 $\lambda _x \approx 3 \delta$ resulting from the APG. The second peak has already been observed in APG turbulent boundary layers by Harun et al. (Reference Harun, Monty, Mathis and Marusic2013). Also, Sanmiguel Vila et al. (Reference Sanmiguel Vila, Vinuesa, Discetti, Ianiro, Schlatter and Örlü2020) found that the position of the external peak due to the APG is dependent not on the Reynolds number when normalised in outer units (contrary to ZPG), but only on the APG intensity, in the range of Reynolds numbers considered in their study, which is
 $10^3 \lesssim Re_\theta \lesssim 2\times 10^4$. The results of Schatzman & Thomas (Reference Schatzman and Thomas2017) using embedded shear scaling parameters are in accordance with Sanmiguel Vila et al. (Reference Sanmiguel Vila, Vinuesa, Discetti, Ianiro, Schlatter and Örlü2020) for similar values of the Reynolds number, and their discussion of data at higher Reynolds numbers suggests the same conclusion.
The study of turbulence dynamics in wall-bounded canonical flows has also shown some differences in the behaviour of the inner layer and the outer layer. Jiménez (Reference Jiménez1999) performed a numerical experiment in a turbulent channel flow simulation in which turbulent structures were removed from the outer layer. Despite the absence of outer layer turbulence, the inner layer turbulent structures were still present, suggesting that the turbulence generation process in the inner layer is autonomous, although there is an interaction with the outer layer turbulence such as the amplitude modulation (Mathis et al. Reference Mathis, Hutchins and Marusic2009). In the work of Flores & Jiménez (Reference Flores and Jiménez2006), the dynamics of the buffer layer is artificially removed, but the turbulence observed further away is barely changed. In line with this work, Flores & Jiménez (Reference Flores and Jiménez2010) showed that the turbulence dynamics is self-sustained in the logarithmic region. Indeed, the dynamics in this region survives in spite of the suppression of both the larger scales located further from the wall and the buffer layer dynamics. Similar results were also obtained by Hwang & Cossu (Reference Hwang and Cossu2010), who showed that large-scale and very-large-scale structures exist in turbulent channel flows even when smaller-scale structures are quenched (only the dissipation induced by the smaller-scale structures is considered). Also, Hwang & Cossu (Reference Hwang and Cossu2011) pursued their previous research by isolating structures in the logarithmic region, and they concluded that a self-sustained process also exists for scales that range from the buffer layer characteristic scale to the large scales.
All of the studies mentioned in the previous paragraph have been made for canonical flows, i.e. in near-equilibrium conditions. Regarding the behaviour of turbulent boundary layers in non-equilibrium conditions, most studies rely on the perturbation of the boundary layer either by wall disturbances (wall roughness or wall tripping devices) or by external flow conditions such as the streamwise pressure gradient. A change in wall roughness will mainly perturb in a direct manner the inner layer of the boundary layer. On the contrary, despite an indirect change of intensity, there is no direct change of the nature of the turbulence dynamics in the outer layer provided that the size of roughness elements is small enough not to disturb the logarithmic layer significantly (in practice, as long as the inverse blockage ratio is  $\delta /k_R > 40\unicode{x2013}80$, where
 $k_R$ is the roughness height) (Jiménez Reference Jiménez2004). When greater perturbations are considered, the evolutions of the inner and outer layers are quite different: the inner layer reaches a new near-equilibrium state faster than the outer layer (Clauser Reference Clauser1956; Marusic et al. Reference Marusic, Chauhan, Kulandaivelu and Hutchins2015; Sanmiguel Vila et al. Reference Sanmiguel Vila, Vinuesa, Discetti, Ianiro, Schlatter and Örlü2017). Marusic et al. (Reference Marusic, Chauhan, Kulandaivelu and Hutchins2015) used rods to disturb the boundary layer with heights of the order of the boundary layer thickness. The effect was noticeable directly in the outer layer, where more energetic structures developed as a result, which was also observed by Sanmiguel Vila et al. (Reference Sanmiguel Vila, Vinuesa, Discetti, Ianiro, Schlatter and Örlü2017), and a faster recovery happened in the near-wall region. An external pressure gradient may also lead to non-equilibrium conditions in the boundary layer. However, this is not necessarily the case since near-equilibrium conditions may be obtained for a given family of streamwise pressure gradient distributions (Rotta Reference Rotta1962; Mellor & Gibson Reference Mellor and Gibson1966; Townsend Reference Townsend1976; Bobke et al. Reference Bobke, Vinuesa, Örlü and Schlatter2017; Vaquero, Renard & Deck Reference Vaquero, Renard and Deck2019b).
In the present work, the non-equilibrium conditions are introduced by a rounded backward-facing step with a height similar to the boundary layer thickness so that the outer layer will be perturbed directly. The non-equilibrium state of the outer layer is thus obtained, employing a boundary layer separation over the rounded step. Near the separation region, pressure gradient effects become important and contribute to the boundary layer's perturbation. The study focuses on the redevelopment after reattachment, where the boundary layer will be in strong non-equilibrium conditions. Also, in the redevelopment region, the pressure gradient will remain close to zero for simplicity and because a null pressure gradient belongs to the family of pressure gradient distributions allowing for near-equilibrium conditions. Therefore, the strongly disturbed boundary layer downstream of the reattachment region will be developing under flow conditions compatible with near-equilibrium, which would eventually lead back to a canonical state.
When a turbulent boundary layer separates from the wall, the shear rate increases significantly in the outer region, resulting in an increase of turbulent production. An inflexion point appears in the mean velocity profile upstream of separation at the point of maximum shear rate, which moves further away from the wall as we get closer to the separation point. The structure of the detached region is sketched by Simpson (Reference Simpson1989) with two clearly separate regions: one close to the wall where the mean flow is reversed, and another further away where a shear layer forms. In the back-flow region, turbulent fluctuations exist that are of the same order of magnitude as the mean back-flow velocity (Simpson Reference Simpson1989). However, these fluctuations result not from turbulence production, but rather from turbulent diffusion from the large-scale structures lying in the shear layer (Simpson, Chew & Shivaprasad Reference Simpson, Chew and Shivaprasad1981). In fact, in the back-flow region, the Reynolds shear stress is negligible compared to the normal Reynolds stresses (Song Reference Song2002). Thus the back-flow does not come from permanently reversed flow starting downstream; instead, it seems to result from intermittent reversed flow induced locally by large-scale structures located right above the mean back-flow region. In the shear layer, the Kelvin–Helmholtz instability develops, and coherent structures in the shape of roll-up vortices are created and grow by vortex pairing as they are convected downstream. Turbulent structures may complicate the identification of roll-up vortices due to turbulent diffusion. However, they have still been observed both numerically and experimentally as, for instance, in the works of Na & Moin (Reference Na and Moin1998), Song & Eaton (Reference Song and Eaton2004) and Fadla et al. (Reference Fadla, Alizard, Keirsbulck, Robinet, Laval, Foucaut, Chovet and Lippert2019).
In the study of turbulent separation bubbles, three modes have been identified to be relevant to their dynamics. The first mode is the shear layer mode associated with the Kelvin–Helmholtz instability resulting from the inflexion point in the mean velocity profile across the shear layer. As reported by Hasan (Reference Hasan1992), this mode does not scale with the ramp geometry or the separation length. Instead, it scales with the properties of the shear layer or the boundary layer before separation. In particular, Hasan (Reference Hasan1992) indicates that the Strouhal number corresponding to this mode is  $St_\theta = 0.012$, where
 $\theta$ is the momentum thickness of the boundary layer at the point of separation. It is also found that, using the vorticity thickness
 $\delta _\omega$ and the average between the maximum and minimum velocity, the Strouhal number is
 $St_\omega =0.135$ (Huerre & Rossi Reference Huerre and Rossi1998). The second mode is the shedding mode associated with the vortex pairing in the shear layer. According to Hasan (Reference Hasan1992) and the recent numerical and experimental results of Fadla et al. (Reference Fadla, Alizard, Keirsbulck, Robinet, Laval, Foucaut, Chovet and Lippert2019), its frequency seems to scale with the step/ramp height such that
 $St_H=0.2$. The last mode is the flapping mode. It corresponds to a low-frequency mode that Eaton & Johnston (Reference Eaton and Johnston1981) associated with an instantaneous imbalance between the entrainment of fluid from the shear layer and the re-injection of fluid into the separation bubble in the proximity of the reattachment point. The size of the recirculation region seems to be the relevant length scale for the frequency normalisation. Indeed, Dandois, Garnier & Sagaut (Reference Dandois, Garnier and Sagaut2007) summarised several previous works in the literature and found the Strouhal number to be around
 $St=0.12\unicode{x2013}0.18$ (with
 $St=f L_R /U_\infty$, where
 $f$ is the frequency,
 $L_R$ is the mean recirculation length, and
 $U_\infty$ is the free stream velocity upstream of separation), a result that is also confirmed for instance in the recent work of Fadla et al. (Reference Fadla, Alizard, Keirsbulck, Robinet, Laval, Foucaut, Chovet and Lippert2019).
As already mentioned, in a turbulent separation bubble, turbulence production is enhanced in the shear layer and negligible in the back-flow region. Coleman, Rumsey & Spalart (Reference Coleman, Rumsey and Spalart2018) performed direct numerical simulation of a turbulent separation bubble with varying pressure gradient intensities and Reynolds numbers. They analysed the turbulent kinetic energy budget across a separation bubble on a flat plate, and they showed the strong non-equilibrium between the production term and the dissipation term both near separation and in the reattachment region. Similar results have also been observed in the case of turbulent boundary layer separation over a rounded step, for instance, in the work of Bentaleb, Lardeau & Leschziner (Reference Bentaleb, Lardeau and Leschziner2012). However, in the latter, the peak of the ratio between production and dissipation is larger, and it is noticeable further downstream. Such an imbalance between production and dissipation suggests that after reattachment, the boundary layer is in strong non-equilibrium conditions.
In the present work, a high-Reynolds-number turbulent boundary layer is studied by means of a wall-modelled large-eddy simulation (WMLES) utilising the zonal detached-eddy simulation (ZDES) approach (Deck Reference Deck2012), which has already been used in other high-fidelity simulation studies (Deck & Laraufie Reference Deck and Laraufie2013; Deck et al. Reference Deck, Renard, Laraufie and Weiss2014b). The study focuses on the outer layer, which is driven by a self-sustained process (Flores & Jiménez Reference Flores and Jiménez2010; Hwang & Cossu Reference Hwang and Cossu2010, Reference Hwang and Cossu2011). In particular, the flow considered is a turbulent boundary layer redeveloping from non-equilibrium conditions caused by a turbulent separation bubble. Similarly to the procedure of Hwang & Cossu (Reference Hwang and Cossu2010), the turbulent activity in the inner layer is quenched, but the dissipation is still present by using a Reynolds-averaged Navier–Stokes (RANS) model, and the turbulence is solved in the outer part of the boundary layer utilising the large-eddy simulation (LES) approach.
When simulating this kind of flow, the reliability of the RANS approach in the outer layer has been shown to be limited. For instance, Coleman et al. (Reference Coleman, Rumsey and Spalart2018) applied different RANS models to their turbulent separation bubble and compared them to a direct numerical simulation (DNS). Turbulence models of different families were considered. Most of them showed quite similar results regarding the separation point, which is explained by Coleman et al. (Reference Coleman, Rumsey and Spalart2018) by the fact that these models behave similarly near the wall. However, the eddy-viscosity fields were quite different, especially downstream of separation, and the behaviour of the models was still quite similar. All of them showed greater deviation from DNS results in the friction coefficient in the redevelopment region.
Higher reliability could be obtained by wall-resolved large-eddy simulation (WRLES) or DNS of the flow. However, there is an important limitation on the computational effort, limiting these approaches to low or moderate Reynolds number flows (Piomelli Reference Piomelli2008; Deck et al. Reference Deck, Renard, Laraufie and Sagaut2014a). For instance, in the recent DNS of Abe (Reference Abe2017), Coleman et al. (Reference Coleman, Rumsey and Spalart2018) and Wu, Meneveau & Mittal (Reference Wu, Meneveau and Mittal2020), the Reynolds numbers based on the momentum thickness ( $Re_\theta$) were respectively 900, 3121 (they also performed simulations at lower Reynolds numbers in the same work) and 490. In the present work, due to the interest of high-Reynolds-number effects in the research community, the Reynolds number is significantly greater (
 $Re_\theta = 13{,}200$ in the reference station and reaching up to
 $Re_\theta =24{,}000$). The increase of the computational effort with the Reynolds number of the flow makes such high-Reynolds-number flows not affordable to be reproduced by DNS or WRLES, which again justifies the use of ZDES.
Following the past extensive validation of ZDES at somewhat lower Reynolds numbers (Deck et al. Reference Deck, Renard, Laraufie and Sagaut2014a,Reference Deck, Renard, Laraufie and Weissb; Renard & Deck Reference Renard and Deck2015a; Deck, Weiss & Renard Reference Deck, Weiss and Renard2018), the present study contributes to better understanding and quantifying the applicability of scale-resolving approaches to predict the properties of out-of-equilibrium wall-bounded turbulence at Reynolds numbers that may not be reached easily by DNS.
The present work is structured as follows. The numerical simulation is described in § 2. In § 3, the instantaneous and mean flow fields are analysed, and spectral analysis of streamwise velocity fluctuations is performed as well. The turbulence dynamics of the outer layer in the recovery region is analysed in § 4, through the spectral analysis and the streamwise evolution of turbulent kinetic energy production, together with a statistical study of the friction coefficient evolution. The long-lasting non-equilibrium state in the separation and relaxation region is identified as the likely reason for the lack of accuracy of the RANS approaches in this region.
2. Numerical simulation description
2.1. Flow configuration
The experimental study from Song & Eaton (Reference Song and Eaton2004) is reproduced numerically for the Reynolds number  $Re_{\theta,ref}=13{,}200$. The boundary layer undergoes separation over a rounded step, then reattaches and develops downstream. A representation of the flow configuration is sketched in figure 1. Several works in the literature have simulated this kind of flow but at lower Reynolds numbers. For instance, in the works of Lardeau & Leschziner (Reference Lardeau and Leschziner2011) and Bentaleb et al. (Reference Bentaleb, Lardeau and Leschziner2012), WRLES is performed for a similar geometry (although slightly modified) at almost
 $Re_\theta =1200$. Radhakrishnan et al. (Reference Radhakrishnan, Piomelli, Keating and Lopes2006) simulated the same flow at higher Reynolds number,
 $Re_\theta = 13{,}200$, the same as in the present study, but with a much coarser grid than the one considered in ZDES, and employing the standard detached-eddy simulation (DES) as in Nikitin et al. (Reference Nikitin, Nicoud, Wasistho, Squires and Spalart2000) as a WMLES approach. The length of the round step is
 $L$, the height is
 $h=0.3L$, and the
 $^\prime$ symbol is used in length-type variables when normalised by the step length (for instance,
 $x^\prime = x/L$). The reference station is placed at
 $x^\prime =-2$, where
 $Re_{\theta,ref}=13{,}200$ as mentioned earlier. An illustration of the flow configuration is given in figure 4 below, and
 $x$,
 $y$ and
 $z$ are respectively the streamwise, vertical and spanwise directions. It is important to mention that the geometry of the top wall is slightly modified in the present study, as explained in § 2.2.
Schematic representation of the flow configuration.

2.2. Numerical set-up
In the present work, the outer part of the boundary layer is resolved by means of an LES approach using ZDES mode 3 (Deck Reference Deck2012; Renard & Deck Reference Renard and Deck2015a). This method, which is described in Appendix A, employs the Spalart–Allmaras (Spalart & Allmaras Reference Spalart and Allmaras1994) turbulence model as a subgrid-scale (SGS) model, in order to link the SGS stress tensor to the mean field variables. In addition, a thin near-wall RANS layer is acting as a wall model. This method has already been used in other high-fidelity simulation studies, such as in Deck et al. (Reference Deck, Weiss, Pamiès and Garnier2011, Reference Deck, Renard, Laraufie and Sagaut2014a,Reference Deck, Renard, Laraufie and Weissb) and Deck & Laraufie (Reference Deck and Laraufie2013). Figure 2 illustrates the results obtained from a quasi-incompressible ZPG turbulent boundary layer at high Reynolds number employing ZDES mode 3, where very good agreement with experimental data is observed for the mean velocity profile.
Mean velocity profile of a ZPG turbulent boundary at  $Re_\theta =15{,}500$ and
 $Re_\tau = 4900$, from a ZDES mode 3. Experimental results of Vallikivi, Hultmark & Smits (Reference Vallikivi, Hultmark and Smits2015) (
 $Re_\tau = 4635$) and Österlund (Reference Österlund1999) (
 $Re_\tau = 4758$) are also included.

This work focuses mainly on the outer layer turbulent structures in out-of-equilibrium conditions. Even though turbulence resolving methods are essential for this type of study, simulations based on the RANS approach have also been carried out in the present work for mean field comparisons. The two eddy-viscosity models considered for the RANS simulations are the Spalart–Allmaras (SA) model (Spalart & Allmaras Reference Spalart and Allmaras1994) and the  $k$-
 $\omega$ shear stress transport (SST) from Menter (Reference Menter1994). Regarding the Reynolds stress model (RSM), the SSG-LRR-
 $\omega$ (Launder, Reece & Rodi Reference Launder, Reece and Rodi1975; Speziale, Sarkar & Gatski Reference Speziale, Sarkar and Gatski1991; Cécora et al. Reference Cécora, Radespiel, Eisfeld and Probst2015) model is employed in this study. The Reynolds average of a variable
 $\bullet$ is denoted in this work by
 $\langle \bullet \rangle$.
The geometry of the computational domain (top wall) has been modified slightly to take into account the side-wall effects present in the wind tunnel, without simulating the side-wall boundary layers. This allows us to reduce the computational effort in ZDES, while keeping the proper pressure coefficient evolution. The method detailed in Vaquero, Renard & Deck (Reference Vaquero, Renard and Deck2019a) has been employed, for which the results are presented in figure 3 for both the Spalart–Allmaras model and ZDES. Also, a comparison is made against a RANS simulation with a flat top and the side-wall boundary layers (SA 3-D), and very accurate results are obtained with ZDES, thus validating the geometry of the top wall for the statistically two-dimensional (2-D) simulations. Moreover, it is interesting to point out the good prediction of the pressure coefficient by ZDES, especially in the separation region.
Pressure coefficient evolution over the bottom wall for different top wall geometries, including a full three-dimensional (3-D) computation with a flat top wall.

Table 1 gathers the grid parameters for ZDES mode 3. Parameters for the other simulations are not included since these are two-dimensional and the grid in the  $(x,y)$ plane is identical, i.e.
 $\Delta x = 0.0108L$ and
 $\Delta y |_w = 0.000054L$. In the present case, we have taken
 $L_z = 3.8\delta _{10}$ for the ZDES computation (leading to
 $N_{xyz} = 290 \times 10^6$, see table 1), which has been verified to be enough to avoid any spanwise correlation. As we remarked in the Introduction, such an investigation at high Reynolds number cannot be tractable with DNS or WRLES, for which it is estimated
 $N_{xyz}=320\times 10^9$ and
 $N_{xyz}=16\times 10^9$, respectively. Radhakrishnan et al. (Reference Radhakrishnan, Piomelli, Keating and Lopes2006) also simulated the experiment of Song & Eaton (Reference Song and Eaton2004) using standard DES at the same Reynolds number, but the span was less than half the span in the present work (
 $L_z = 3 \delta _{ref}$), and the mesh was coarser as well (
 $N_{xyz}=5.7 \times 10^6$).
Grid parameters and numerical domain specifications for ZDES. Here,  $\Delta y |_w$ is the spacing in the
 $y$ direction for the first cell away from the wall. The values given in wall units (superscript
 $+$) are taken at the most restrictive region of the domain. Quantities
 $\delta _{in}$,
 $\delta _{ref}$,
 $\delta _{0}$ and
 $\delta _{10}$ correspond to the boundary layer thickness at the inlet, at
 $x^\prime =-2$ (reference station), at
 $x^\prime =0$ and at
 $x^\prime =10$, respectively.

In the ZDES computation, the position of the inlet of the domain is different than in RANS simulations. Instead, the inlet is placed at  $x^\prime =-15.7$, whereas in the RANS simulations, the inlet is located further upstream (
 $x^\prime =-43$). The reason for the inlet being placed further downstream in the ZDES computation is to reduce computational effort since the simulation is three-dimensional. Also, turbulent inflow conditions are used due to the presence of resolved turbulence when using ZDES mode 3. In particular, the synthetic-eddy method (Pamiès et al. Reference Pamiès, Weiss, Garnier, Deck and Sagaut2009; Deck et al. Reference Deck, Weiss, Pamiès and Garnier2011; Laraufie & Deck Reference Laraufie and Deck2013) is employed to generate turbulent structures, and it is coupled with a dynamic forcing method as presented by Laraufie, Deck & Sagaut (Reference Laraufie, Deck and Sagaut2011) that allows accelerating the transition of the injected turbulent structures to become proper turbulent structures of the actual simulation. Regarding the outlet, even though the last station where experimental data of Song & Eaton (Reference Song and Eaton2004) are available is placed at
 $x^\prime =7$, in all the simulations it is located at
 $x^\prime =14$, thus allowing for a greater relaxation region.
Two different solvers have been used in the present work. The RANS simulation with the Spalart–Allmaras turbulence model and ZDES mode 3 have been carried out with the solver FLU3M developed at ONERA, which has already been used for high-fidelity simulations (see, for instance, the work of Deck & Laraufie Reference Deck and Laraufie2013; Deck et al. Reference Deck, Renard, Laraufie and Weiss2014b, Reference Deck, Weiss and Renard2018). The simulations with the  $k$-
 $\omega$ SST model and the RSM have been performed utilising the ONERA solver elsA (Cambier, Heib & Plot Reference Cambier, Heib and Plot2013). Even though different solvers are used in this study, the numerics employed in all the simulations are very similar. Moreover, a comparison between FLU3M and elsA simulations using the Spalart–Allmaras model has been made keeping the same numerics, and differences were not noticeable. This allows excluding the use of different solvers as a possible source of error.
The numerics employed in the RANS simulations are the same regardless of both the turbulence model and the solver. The spatial integration is performed through the finite volume method using Roe's scheme and the MUSCL (Monotonic Upstream Scheme for Conservation Laws) approach for flux reconstruction at the cell faces. RANS simulations are steady, and the pseudotemporal integration is computed through an implicit Euler's scheme.
For ZDES, the finite volume method is also used. In the numerical domain, only the lower-wall boundary layer is solved with ZDES mode 3, and the upper-wall boundary layer is treated in RANS (with the Spalart–Allmaras model) thanks to the zonal feature of ZDES. The numerical scheme applied is the AUSM  $+$ (P) suggested by Liou (Reference Liou1996) and modified according to Mary & Sagaut (Reference Mary and Sagaut2002). The temporal integration in the ZDES computation is made by means of a Gear's scheme with time step
 $\Delta t=2.67\times 10^{-7}$ s. In the present simulation,
 $\Delta t^+ = {\Delta t u_\tau ^2}/{\nu }$ is below 0.2 in the whole domain, which is in accordance with the requirement
 $\Delta t ^+ < 0.4$ proposed by Choi & Moin (Reference Choi and Moin1994). Also, the inner RANS region is located within
 $0.1\delta$ from the wall in attached regions, which corresponds to the whole inner layer, as in previous studies (Deck et al. Reference Deck, Renard, Laraufie and Sagaut2014a, Reference Deck, Weiss and Renard2018; Renard & Deck Reference Renard and Deck2015a). Due to the presence of local mean pressure gradients in the flow, the boundary layer thickness is evaluated by employing a method inspired by that used in the work of Spalart & Watmuff (Reference Spalart and Watmuff1993) or Kitsios et al. (Reference Kitsios, Sekimoto, Atkinson, Sillero, Borrell, Gungor, Jiménez and Soria2017). Within the recirculation bubble, the RANS region extends up to a distance from the wall of about
 $0.1\delta _{x^\prime = 0}$. The mean field comparison to the experimental measurements presented in both § 3.2 and Appendix B confirms the accurate flow prediction obtained using the mentioned definition of the RANS region location.
3. Turbulent flow field analysis
3.1. Visualisation of the instantaneous flow field
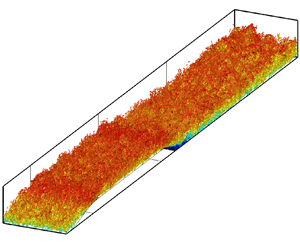
An insight into the flow is presented through the instantaneous field obtained from ZDES. Figure 4 shows the  $Q$-criterion (Hunt, Wray & Moin Reference Hunt, Wray and Moin1988) of the flow, and figure 5 presents a numerical schlieren. From the
 $Q$-criterion, it is observed that turbulence is resolved finely in the outer layer, and the typical hairpin-like structures are recognisable. Also, the boundary layer is thicker than upstream of separation, and turbulent structures are more easily observable in the redevelopment region due to the high increase in Reynolds number (
 $Re_\theta \approx 13{,}200$ at
 $x^\prime =-2$, and
 $Re_\theta \approx 24{,}000$ at
 $x^\prime =8$). In the numerical schlieren (figure 5), it is possible to identify the typical elongated turbulent structures inclined in the flow direction due to the streamwise velocity shear, which for ZPG turbulent boundary layers are inclined at angle
 $14^\circ$ according to Marusic & Heuer (Reference Marusic and Heuer2007). Those structures correspond to the large-scale structures of high-Reynolds-number turbulent boundary layers since their sizes are commensurable to the boundary layer thickness. Indeed, as already mentioned, large-scale motions have streamwise lengths
 $\lambda _x$ of approximately 2–3
 $~\delta$.
Isosurface of  $Q$-criterion for
 $Q=0.16 ({U_{e}}/{\delta } )_{ref}^2$ coloured by the instantaneous streamwise velocity.

Numerical schlieren  $( \sqrt {({\partial \rho }/{\partial x_i})({\partial \rho }/{\partial x_i})} )$ in the
 $(x^\prime,y^\prime )$ plane, where
 $\rho$ is the fluid density.

3.2. Comparison to experimental measurements
Integral properties of the mean flow boundary layer as well as mean velocity and Reynolds stress profiles are presented in this section. Comparisons are made not only to the experimental data but also to popular RANS eddy-viscosity models and one RSM (see § 2.2). Regarding the mean quantities displayed in figure 6, ZDES gives excellent agreement with experimental results for the shape factor in the whole domain. Very good agreement is also obtained for the friction coefficient, especially after reattachment, in the redevelopment region, which is the main region of interest in the present study.
Friction coefficient (a) and shape factor (b) evolutions in the streamwise direction.

Concerning the results from the RANS models computations, there are some discrepancies in reproducing the friction coefficient in the redevelopment region. In particular, both the Spalart–Allmaras and  $k$-
 $\omega$ SST models underestimate the friction coefficient and give an increasing trend. This very likely results from the flow being out of equilibrium, whereas these models are calibrated in near-equilibrium conditions. Some differences are also present in the shape factor, where the Spalart–Allmaras model underestimates the shape factor in the recirculation bubble, whereas the other RANS models (and ZDES) are very accurate. This difference for the Spalart-Allmaras model results from a less satisfactory prediction of the displacement and momentum thicknesses (not shown) compared to the other models. Indeed, the friction coefficient is related to the momentum thickness and the shape factor through the Von Kármán equation.
Figures 7–10 present the mean velocity and Reynolds stress profiles for  $x^\prime =4$ and
 $x^\prime =7$, which are located downstream of reattachment, in the relaxation region, which is the main focus of this study. Predictions of mean velocity profile and Reynolds shear stress (figure 7) by ZDES match the experimental measurements very accurately. The boundary layer is not in canonical conditions, as evidenced clearly by the external peak observed in the outer layer for the Reynolds shear stress, which results from the increased turbulent activity in the shear layer after separation. Further downstream, at
 $x^\prime =7$ (figure 9), ZDES results are again in strong agreement with experimental measurements. The boundary layer is recovering from non-equilibrium induced by excess turbulent activity resulting from the shear layer in the separated region, although canonical conditions have not been reached yet. This is observable in the profile of Reynolds shear stress, where the outer peak is still present (both in the experiment and in the ZDES computation), although it has decreased significantly compared to station
 $x^\prime =4$. Also, in the mean velocity profile at
 $x^\prime =7$, the log region is more clearly identifiable, and extends in a vast extension of the mean velocity profile due to the high Reynolds number at this station, which is about
 $Re_\theta = 23{,}400$.
Mean velocity (a) and Reynolds shear stress (b) profiles at  $x^\prime =4$. The dashed vertical line indicates the position of the RANS/LES interface. For ZDES, the Reynolds shear stress profile is split into modelled (dotted) and resolved (dashed) contributions.

Streamwise (a) and wall-normal (b) velocity fluctuations profiles at  $x^\prime =4$. The inner RANS region for ZDES is shaded in grey.

Mean velocity (a) and Reynolds shear stress (b) profiles at  $x^\prime =7$. The dashed vertical line indicates the position of the RANS/LES interface. For ZDES, the Reynolds shear stress profile is split into modelled (dotted) and resolved (dashed) contributions.

Streamwise (a) and wall-normal (b) velocity fluctuations profiles at  $x^\prime =7$. The inner RANS region for ZDES is shaded in grey.

RANS results in the reattachment region are less accurate. The mean velocity profile at  $x^\prime =4$ presents a small underestimation in the inner layer for both eddy-viscosity models, and is better reproduced by the RSM. Regarding the Reynolds shear stress at this same station, all the models give an outer peak, but its level is clearly underestimated by the Spalart–Allmaras model. The peak from the
 $k$-
 $\omega$ SST model is closer to the experiment, but still underestimated, whereas the RSM predicts a slightly overestimated Reynolds shear stress for the peak. An important discrepancy between RANS computations and ZDES is observed regarding the position of the mentioned outer peak. In fact, ZDES adequately predicts the peak to be around
 $y\approx 0.32\delta$, which is very similar to the experiment, but RANS computations provide a lower location of the peak, being at about
 $y\approx 0.24\delta$ for the three RANS models considered. This misprediction of the peak location is very likely responsible for the departure from experimental data in the RSM mean velocity profile, with an underestimation around
 $y\approx 0.1\delta$ followed by a minor overestimation around
 $y\approx 0.5\delta$.
At  $x^\prime =7$, predictions from RANS models are closer to the experiment because the boundary layer is relaxing from non-equilibrium conditions. However, the same discrepancy as the one just described for
 $x^\prime =4$ is still observed for RANS computations compared with ZDES and the experiment, although to a lesser extent. Predictions of Reynolds shear stress levels from RANS models are in better agreement at this station, but the position of the peak remains moderately shifted closer to the wall. Concerning the mean velocity profile, a better agreement is also observed at this station from RANS simulations, and discrepancies are limited to a small underestimation of the mean velocity in the log region by the
 $k$-
 $\omega$ SST model, and a slight overestimation in the wake region by the Spalart–Allmaras model.
The profiles of  $u_{rms}$ and
 $v_{rms}$ at
 $x^\prime =4$ and
 $x^\prime =7$ are displayed in figures 8 and 10, respectively. The wall-normal velocity fluctuations at
 $x^\prime =4$ are reproduced accurately by ZDES, and fluctuations in the streamwise direction are slightly underestimated below
 $y\approx 0.5\delta$. Further downstream, at
 $x^\prime =7$, the velocity fluctuations in both the streamwise and wall-normal directions are fairly well reproduced, although there is a moderate underestimation compared to the experimental results. The RSM, conversely, does not properly predict velocity fluctuations at these stations, regarding both the levels and the trend. At both stations,
 $u_{rms}$ and
 $v_{rms}$ are below the experimental values in the whole profile, and a faster decay away from the wall is predicted by this model.
Profiles of mean velocity and Reynolds shear stress at two stations upstream of separation and at the recirculation region are discussed further in Appendix B, for the sake of conciseness. Results from the ZDES computation are again in fairly good agreement with the experimental measurements, and some non-canonical features of the flow are well reproduced in this simulation, which is not the case for all the RANS simulations considered. Also, in the recirculation bubble, the inflexion point is well reproduced by ZDES in terms of both velocity magnitude and position from the wall, whereas less accurate results are provided by the RANS computations. Another interesting aspect to point out is the prediction of negative Reynolds shear stress ( $-\langle u^{\prime } v^{\prime } \rangle < 0$) very near the wall, which is observed in neither the ZDES profile nor the experiment (see figure 23).
3.3. Spectral analysis of streamwise velocity fluctuations
The spectral content of velocity fluctuations in the streamwise direction is studied in this subsection at different domain stations. In the study of turbulent boundary layers, it is common to focus on the spatial length scales of coherent structures. However, the evolution of the boundary layer in the streamwise direction makes this a non-homogeneous direction, therefore the analysis of streamwise coherent structures is performed by utilising time signals of the streamwise velocity at a given spatial position and a link between frequency and streamwise wavenumber, which is given assuming Taylor's hypothesis; see, for instance, the work of Renard & Deck (Reference Renard and Deck2015b).
The one-sided power spectral density (PSD) for  $\langle u^{\prime 2} \rangle = (u_{rms})^2$ is given by
 $G_{uu;f}(f)$, expressed such that
 \begin{equation} \langle u^{\prime 2} \rangle = \int_{0}^{+\infty} G_{uu;f}(f) \,\mathrm{d} f. \end{equation}
It is very common to present the PSD in logarithmic scale for the frequency. It is then usually chosen to plot the pre-multiplied PSD,  $f\,G_{uu;f}(f)$, because the area under the curve of
 $f\, G_{uu;f}(f)$ in a semi-logarithmic scale at a given position
 $d_w/\delta$ is proportional to the contribution to
 $\langle u^{\prime 2} \rangle$ at the considered
 $d_w/\delta$.
In the present study, the signal of streamwise velocity has been collected from ZDES for a total time  $T\approx 430 ( \delta / U_e )_{ref}$. That recording time is long enough to capture the low-frequency dynamics of the flow since it corresponds to around 30 periods of time for the flapping mode. Figures 12 and 13 display the distribution of the pre-multiplied PSD, estimated using Welch's method (Welch Reference Welch1967), at positions
 $P_1$,
 $P_3$ and
 $P_6$, located at
 $x^\prime = 0$,
 $x^\prime = 1$ and
 $x^\prime = 7$ (and following the mesh lines, see figure 11). The boundary layer quantities
 $\delta$,
 $U_e$ and
 $\nu /u_\tau$ employed for normalisation at station
 $P_3$ (figure 13) are taken from station
 $P_1$ since station
 $P_3$ is located within the recirculation bubble. In fact, in the recirculation bubble, the boundary layer is completely separated, and
 $\delta$ and
 $\nu /u_\tau$, though calculable, do not play the same role in the normalisation from a physical point of view. Hence in order to make proper comparisons, the values at
 $P_1$ have been employed at
 $P_3$, but
 $P_6$ is located downstream of reattachment, therefore at
 $P_6$, values of
 $\delta$,
 $U_e$ and
 $\nu /u_\tau$ are computed locally.
Positions of data extraction for spectral analysis.

Pre-multiplied spectrum of streamwise velocity fluctuations at  $P_1$ (see figure 11). The shaded area indicates the RANS region.

Pre-multiplied spectrum of streamwise velocity fluctuations at  $P_3$ (a) and
 $P_6$ (b) (see figure 11). The shaded area indicates the RANS region. The values of
 $\delta$,
 $U_e$ and
 $\nu /u_\tau$ at
 $P_3$ are taken as those from
 $P_1$ since the
 $P_3$ station is located within the recirculation bubble.

The convection velocity could be evaluated by using the local mean velocity, or even more sophisticated convection velocities such as the one proposed by Deck et al. (Reference Deck, Renard, Laraufie and Sagaut2014a) based on the two-point two-time correlation coefficient, or the one suggested by Renard & Deck (Reference Renard and Deck2015b), which is dependent on turbulent structures length scale. Even though we have mentioned the use of Taylor's hypothesis for linking frequency content and spatial length scales, such a hypothesis cannot be applied in the backward flow region since turbulent velocity fluctuations and the mean back-flow velocity are of the same order of magnitude (Simpson Reference Simpson1989). For this reason, plots in figures 12 and 13 are given in frequency content (even for  $P_1$ and
 $P_6$), with
 $f^+=f \nu / u_\tau ^2$. However, since
 $\lambda _x / \delta = U_c /(f\delta )$, it has been chosen to plot the PSD as a function of the inverse of the frequency because
 $U_e/(f\delta )$ is representative of
 $\lambda _x/\delta$ when Taylor's hypothesis may be applied (as with
 $P_1$ and
 $P_6$). Even though it is not strictly the same because using
 $U_c(d_w/\delta )=U_e$ as the convection velocity would not be very suited,
 $U_c$ remains a fraction of
 $U_e$ even in the near-wall region (Deck et al. Reference Deck, Renard, Laraufie and Sagaut2014a; Renard & Deck Reference Renard and Deck2015b).
At stations  $P_1$ and
 $P_6$, analysis of the pre-multiplied PSD as a function of the wavenumber (
 $k_x\,G_{uu;k_x}(k_x)$) has been performed using the two-point two-time correlation coefficient for the convection velocity as described by Deck et al. (Reference Deck, Renard, Laraufie and Sagaut2014a). However, it is not shown since changes to the figures presented are limited to a slight shift of the energy content to lower wavelengths. Nevertheless, values of
 $\lambda _x/\delta$ from the plot of
 $k_x\,G_{uu;k_x}(k_x)$ will be indicated in the discussion.
The turbulent content before separation, presented in figure 12, shows a quite homogeneous distribution in a wide range of scales at  $d_w \approx 0.2\delta$, with length scales from
 $\lambda _x = 0.4\delta$ to
 $\lambda _x = 40\delta$. It is interesting to notice that turbulent fluctuations at large scales are still present within the RANS region, but small structures present in the LES region are dissipated in the RANS region. This is not surprising because, as recalled by Renard & Deck (Reference Renard and Deck2015c), the fraction of resolved Reynolds shear stress decreases gradually within the RANS region. As already mentioned,
 $U_e \geq U_c$ across the boundary layer profile, so
 $U_e/(f\delta ) \geq \lambda _x / \delta$, which causes the PSD in figure 12 to be shifted slightly towards greater values in the vertical axis, when plotted against
 $U_e/(f\delta )$ instead of
 $\lambda _x/\delta$. For instance, the length scale associated with
 $U_e/(f\delta ) \approx 10$ is
 $\lambda _x/\delta \approx 8\unicode{x2013}9$ instead. It is also important to notice that values of
 $\lambda _x/\delta$ with important energy content are significantly higher than those for very large-scale motions (VLSM) in ZPG turbulent boundary layers (for which
 $\lambda _x$ is 5–6
 $\delta$).
The spectral content is very different within the recirculation bubble, as illustrated in figure 13. Again, energy is distributed in a broad range of scales. It is important to mention that for this station,  $U_e/(f\delta )$ may not be as accurate as at
 $P_1$ for estimating
 $\lambda _x/\delta$ because the values of
 $\delta$,
 $U_e$ and
 $\nu /u_\tau$ used are those from
 $P_1$. It is recalled that this choice is made for the sake of comparison because the boundary-layer-like thickness and the friction velocity at
 $P_3$ do not represent an adequate scaling within the recirculation bubble. Energy levels at
 $P_3$ are much more important than at
 $P_1$ (the range of values in the colourbar is not the same), and we can observe three localised energy sites for
 $U_e/(f\delta )=10$ and above that likely correspond to the shear layer mode and the shedding mode, as will be described later, in § 4.2. Regarding the flapping mode, the present flow configuration does not discern clearly this mode from the others. Indeed, the flapping mode is characterised by
 $St=fL_R/U_{\infty } = 0.12\unicode{x2013}0.18$, and the shear layer mode by
 $St_\theta = f\theta _{sep}/U_{\infty } =0.012$. In the flow field studied,
 $U_\infty = U_{ref}$ and
 $\theta _{sep}/L_R \sim 0.1$, hence although the shear layer mode and the flapping mode have certainly distinct Strouhal numbers, in the present case, their absolute characteristic frequencies are very close to each other.
In the relaxation region (figure 13), the PSD changes significantly with respect to the separated region, and some similarities to the  $P_1$ station are recovered. In particular, energy in the RANS region is observable again, and energy levels are lowered with respect to those in the separated region, and they are closer to, yet greater than, those upstream of separation. In the outer layer, energy is more concentrated for structures whose length scales range from
 $\lambda _x = 1.5\delta$ to
 $\lambda _x = 9\delta$. However, the peak location related to VLSM falls within the RANS region and is not observed, evidently, as was the case at
 $P_1$. The energy in the outer layer at
 $P_6$ is significantly greater and more broadly distributed across the boundary layer. There is still some important turbulent activity even at
 $d_w = 0.5\delta$. This is probably the result of the high Reynolds number at this station, which is
 $Re_\theta =23{,}400$ and
 $Re_\tau = 6285$, but some trace of the high outer layer activity from the shear layer at separation probably influences the turbulent content at this station. Indeed, the mean velocity profile is close to canonical ZPG conditions, but the Reynolds shear stress profile still shows an external peak as a consequence of the excess of turbulence created by boundary layer separation (see figure 9).
4. Analysis of boundary layer relaxation
The relaxation process of the boundary layer downstream of reattachment is assessed in this section through in-depth analysis of the turbulent kinetic energy (TKE) production and friction coefficient evolutions. As already stated, the boundary layer after reattachment is perturbed strongly due to the separation process. The evolution downstream of reattachment occurs at almost ZPG conditions on a plane wall, which should lead the boundary layer back to equilibrium.
4.1. Spatial evolution of turbulence production
The shear layer in the separated region creates an excess of turbulence that is convected in the outer part of the boundary layer once reattachment takes place. In order to analyse better the extent of the shear layer trace, the mean field of the whole TKE production term as in equation (4.1) is here presented. The production term for the turbulent kinetic energy  $k$ in a statistically two-dimensional flow is given by
 \begin{equation} \mathcal{P}_k ={-}\langle u^{\prime} v^{\prime} \rangle \left( \frac{\partial \langle u \rangle}{\partial y} + \frac{\partial \langle v \rangle }{\partial x}\right) + (\langle v^{\prime 2} \rangle - \langle u^{\prime 2} \rangle) \frac{\partial \langle u \rangle}{\partial x}. \end{equation}
Results from RANS simulations are included as well, for comparison purposes. In the case of the two eddy-viscosity models (Spalart–Allmaras and  $k$-
 $\omega$ SST), for which Boussinesq's hypothesis (A1) is considered, the TKE production may be written as
 \begin{equation} \mathcal{P}_k=\nu_t \left( \frac{\partial \langle u \rangle}{\partial y} + \frac{\partial \langle v \rangle}{\partial x} \right)^2 + 2 \nu_t \left( \frac{\partial \langle u \rangle}{\partial x} - \frac{\partial \langle v \rangle}{\partial y} \right) \frac{\partial \langle u \rangle}{\partial x}, \end{equation}
where  $\nu _t = \mu _t /\rho$, with
 $\mu _t$ the eddy viscosity and
 $\rho$ the fluid density. It is important to mention that the production of TKE considered in (4.1) corresponds to the true production, and in (4.2) to its evaluation with Boussinesq's hypothesis, which may differ from the production term considered for the transport equation of TKE,
 $k$, in the
 $k$-
 $\omega$ SST model.
The field of  $\mathcal {P}_k$, as in (4.1) and (4.2), is displayed in figure 14 for all the RANS simulations and ZDES. For the latter, the total production is considered, i.e. the sum of the resolved production, as in (4.1), and the modelled one, as in (4.2). The results obtained are significantly different depending on the RANS model considered. In all cases, there is a clear excess of
 $\mathcal {P}_k$ away from the wall resulting from the turbulence enhancement happening in the shear layer. Such an excess results in a second peak in the outer part of wall-normal profiles of TKE production. However, this excess of
 $\mathcal {P}_k$ disappears in shorter distances for the two eddy-viscosity models, which seem to be too diffusive, especially in the Spalart–Allmaras computation. Indeed, the last position of the outer peak of
 $\mathcal {P}_k$ detected for ZDES is located at
 $x^\prime \approx 11$, whereas for the
 $k$-
 $\omega$ SST and Spalart–Allmaras models, the secondary peak disappears beyond
 $x^\prime \approx 6$ and
 $x^\prime \approx 3.5$, respectively, and for the RSM the outer peak is still present at the end of the computational domain. The discrepancies observed in the friction coefficient after reattachment, where RSM and ZDES are significantly more accurate than the two eddy-viscosity models (see figure 6), are very likely related to the higher dissipation of
 $\mathcal {P}_k$ for the eddy-viscosity models. In fact, TKE production plays a key role in the friction coefficient, which has been evidenced explicitly, for instance, in the mean skin friction decomposition suggested by Renard & Deck (Reference Renard and Deck2016).
Mean field of TKE production  $\mathcal {P}_k$ with all terms considered as in (4.1). From (a)–(d): Spalart–Allmaras model,
 $k$-
 $\omega$ SST model, RSM and ZDES. Pink dots indicate the position of the outer peak. Yellow-filled dots indicate the position of the furthest-downstream outer peak. The white line corresponds to the boundary layer thickness (
 $y^\prime = \delta ^\prime$, with
 $\delta ^\prime = \delta /L$ the normalised local boundary layer thickness). The vertical axis is magnified for visualisation purposes.

Quite similar results are obtained between the RSM computation and ZDES, despite some discrepancies being present. Even though for both simulations the excess of  $\mathcal {P}_k$ disappears very far downstream, the RSM appears to be not diffusive enough since the field is narrower around the secondary peak. This is consistent with the profiles of normal Reynolds stresses in the redevelopment region (figures 8 and 10), which are also narrower for RSM than for ZDES and the experiment. Also, the furthest position for the outer peak detected in ZDES is at
 $x^\prime \approx 11$, whereas the outer peak seems to be still present at the end of the computational domain for the RSM simulation. Moreover, in the RSM computation, the outer peak is positioned further away from the wall (in outer scale) in the boundary layer until
 $x^\prime \approx 7$, and then it seems to be placed at
 $y/\delta \approx 0.5$. Thus the distance between the wall and the outer peak is monotonically increasing with
 $x^\prime$, whereas in ZDES, the wall-normal distance of the peak does not change significantly beyond
 $x^\prime =6$. This means that the further downstream of
 $x^\prime = 6$, the lower the outer peak is located within the boundary layer in outer scale since the boundary layer thickness keeps increasing.
The production term of turbulent kinetic energy presented in figure 14 has been integrated in the  $y$ direction in order to analyse the streamwise evolution of the bulk production of TKE,
 $\mathbb {P}_{k}$. As illustrated in figure 15, different evolutions of the bulk TKE production are provided by the different models. More precisely, it is interesting to notice the underestimation obtained from the Spalart–Allmaras model, which could have been inferred from the previous analysis of figure 14. On the contrary, a more surprising result is obtained from the
 $k$-
 $\omega$ SST model. This model predicts an evolution of the bulk TKE production that is not only in better agreement with ZDES, but also very close to the evolution obtained from the RSM model, despite the important differences between the two models regarding the spatial distribution of the TKE production (figure 14), mainly concerning the outer peak. One may suppose that the fact of having the same transport equation for the specific TKE dissipation rate in both models is partly responsible for the close behaviour between them. It is also observed that even though both models provide an accurate prediction of the bulk TKE production levels with respect to ZDES, there is a slight discrepancy in the trend, which results in minor underestimation and overestimation at the beginning and the end of the redevelopment region, respectively.
Streamwise evolution of the bulk production of TKE,  $({\mathbb {P}_{k}}/{U_{ref}^3})\times 10^3$, where
 $\mathbb {P}_{k} (x^\prime ) = \int _0 ^{+\infty } \mathcal {P}_k (x^\prime,y) \,\mathrm {d} y$.

4.2. Spectral analysis of turbulence production
In the previous subsection, it was observed that there is a trace in production of turbulent kinetic energy from the shear layer in the separated region that is still visible far downstream, until  $x^\prime \approx 11$. In this subsection, the production term of TKE is studied by means of a spectral analysis of turbulence at some stations in the flow. For ZPG turbulent boundary layers, some of the terms may be neglected in (4.1), and the production can be expressed as (considering
 $y$ the wall-normal direction)
 \begin{equation} \mathcal{P}_k ={-}\langle u^{\prime} v^{\prime} \rangle\,\frac{\partial \langle u \rangle}{\partial y}, \end{equation}
which is the expression that will be employed in the spectral analysis presented here. Indeed, for the flow studied in this work, the term considered in (4.3) remains the most dominant term in the whole domain.
The spectral analysis of  $\mathcal {P}_k$ is performed through the Reynolds shear stress according to (4.3). Signals of
 $u(t)$ and
 $v(t)$ are recorded for the same duration
 $T \approx 430 ( \delta /U_e )_{ref}$ as in subsection 3.3. According to Deck et al. (Reference Deck, Renard, Laraufie and Weiss2014b), one can write
 \begin{equation} \langle u^\prime v^\prime \rangle = \int_{0}^{+\infty} 2\,\mathrm{Re} (S_{uv;f}(f))\, \mathrm{d} f = \int_{0}^{+\infty} G_{uv;f}(f) \,\mathrm{d} f , \end{equation}
where  $\mathrm {Re}(\bullet )$ denotes the real part, and
 $G_{uv;f} = 2\,\mathrm {Re} ( S_{uv;f} )$ is the real part of the cross-PSD. Finally, according to (4.3) and (4.4), the production may be expressed as
 \begin{equation} \mathcal{P}_k ={-}\int_{0}^{+\infty} \frac{\partial \langle u \rangle}{\partial y}\,G_{uv;f}(f)\, \mathrm{d} f. \end{equation}
The co-spectrum of  $\mathcal {P}_k$ is presented at stations
 $P_1$,
 $P_3$ and
 $P_6$ in figures 16, 17(a) and 17(b), respectively. In these figures, the cross-PSD is pre-multiplied by the frequency as explained previously in § 3.3 for
 $G_{uu;k_x}$, and by the wall distance as well. Indeed, the total production of TKE across the whole boundary layer profile (per boundary layer thickness) is
 \begin{equation} \mathcal{P}_{tot} =
\int_0 ^{+\infty} \mathcal{P}_k \,\mathrm{d}\!\left(
\frac{d_w}{\delta} \right) = \int_{-\infty} ^{+\infty}
\frac{d_w}{\delta}\,\mathcal{P}_k \,\mathrm{d}\!\left( \ln
\left( \frac{d_w}{\delta} \right)
\right),\end{equation}
thus the area under the curve of  $({d_w}/{\delta })\,\mathcal {P}_k( d_w /\delta )$ in logarithmic scale is directly proportional to the contribution to the whole TKE production across the boundary layer profile.


Pre-multiplied co-spectrum of  $\mathcal {P}_k$ at
 $P_3$ (a) and
 $P_6$ (b) (see figure 11). The shaded area indicates the RANS region. The solid lines show the pre-multiplied PSD of
 $\langle u^{\prime 2} \rangle$ as in figures 13(a) and 13(b). The white dashed lines indicate
 $U_e/(f\delta )=8.5$, 17 and 34. The values of
 $\delta$,
 $U_e$ and
 $\nu /u_\tau$ at
 $P_3$ are taken as those from
 $P_1$ since the
 $P_3$ station is located within the recirculation bubble.

As in the case of the spectral analysis of streamwise velocity fluctuations (§ 3.3), analysis of the cross-PSD as a function of the wavelength has also been performed at stations  $P_1$ and
 $P_6$, and the relevant results are recalled in the present discussions even if figures are not shown. In particular, even though the order of magnitude of
 $U_e /(f \delta )$ is representative of
 $\lambda _x/\delta$ at stations
 $P_1$ and
 $P_6$, true values of the wavelength will be given. At
 $P_3$, the values of
 $U_e$,
 $\delta$ and
 $\nu /u_\tau$ employed are those of station
 $P_1$ for the same reasons exposed in § 3.3.
The spectral content of  $\mathcal {P}_k$ upstream of separation, displayed in figure 16, evidences an important activity of turbulent structures of sizes ranging from
 $\lambda _x \approx 0.7\delta$ to
 $\lambda _x \approx 5\delta$ located around
 $d_w = 0.13\delta$. The contributions of VLSM, which were identified clearly in the PSD of
 $\langle u^{\prime 2} \rangle$, are also observed, with wavelengths reaching
 $\lambda _x = 20 \delta$, although levels are slightly lower. There is also some weak activity in
 $\mathcal {P}_k$ at higher locations in the boundary layer, mainly between
 $d_w=0.3\delta$ and
 $d_w=0.8\delta$.
When looking at the spectral content of  $\mathcal {P}_k$ within the recirculation bubble, the distribution changes completely. Figure 17(a) displays the cross-PSD of
 $\mathcal {P}_k$ at station
 $P_3$. Similarly to the case of
 $G_{uu;f}$ discussed in § 3.3, turbulent activity is concentrated in the outer part, where the shear layer resulting from separation is located. It is important to point out that levels in the legend are much greater than in figures 16 and 17(b). A broad range of frequencies (scales) participates in the production of TKE. As observed, frequencies from
 $U_e/(f\delta )=1$ to
 $U_e/(f\delta )=7$ contribute the most in terms of cross-PSD levels, but important values are observed even beyond
 $U_e/(f\delta )=100$. According to the frequency of the shear layer, three peaks on the cross-PSD are highlighted. Based on the Strouhal number
 $St_\omega =f\delta _\omega / \bar {U}$ (where
 $\bar {U}=0.5( \langle u \rangle _{min} + \langle u \rangle _{max} )$ denotes the shear velocity), the corresponding frequency is represented in figure 17(a), for which
 $U_e/(f\delta )= 8.5$, and also
 $U_e/(f\delta )= 17$ and
 $U_e/(f\delta )= 34$ are indicated. Thus the two lower-frequency peaks (higher values of
 $U_e/(f\delta )$) likely correspond to the subharmonics due to vortex pairing since the frequency is respectively twice and four times that of the shear layer mode (
 $St_\omega = 0.135$).
Downstream of reattachment (figure 17b), the cross-PSD of  $\mathcal {P}_k$ recovers some of the mentioned features for the station
 $P_1$. A contribution to production around
 $d_w=0.13\delta$, which is negligible in figure 17(a), is again present, for which large structures are responsible; structures in this region have sizes from
 $\lambda _x \approx \delta$ up to
 $\lambda _x \approx 10 \delta$. The largest structures correspond to VLSM, already identified in § 3.3, and a small peak appears for slightly smaller structures, for which
 $\lambda _x = 3\delta$. Even if the present station is located far enough away to recover the mentioned features, the main contribution to
 $\mathcal {P}_k$ remains the high turbulent activity in the outer part, which is the trace of the shear layer at separation. The levels of the cross-PSD are much higher than at
 $d_w=0.13\delta$, and the contribution is quite broadly distributed in a wide range of wavelengths. The longest structures have
 $\lambda _x /\delta >10$, and smaller structures, of
 $\lambda _x /\delta$ down to
 $0.2$, are observable. Small structures of
 $\lambda _x = 0.4 \delta$ are also observed upstream of separation (figure 16), but in the recovery region, they are located further away from the wall.
4.3. Friction coefficient
Even though the friction coefficient is a wall quantity, several studies have focused on the interaction between the outer layer and the inner layer, as well as on the contribution to the friction coefficient of large turbulent motions located in the outer layer. According to Balakumar & Adrian (Reference Balakumar and Adrian2007), at high Reynolds numbers, about 40–50 % of the contribution to the Reynolds shear stress at  $y>0.1\delta$ comes from turbulent structures with wavelength
 $\lambda _x > 3\delta$, and in the present study, the LES region corresponds approximatively to
 $y>0.1\delta$. Also, studies on the friction coefficient decomposition (see, for instance, Fukagata, Iwamoto & Kasagi Reference Fukagata, Iwamoto and Kasagi2002; Renard & Deck Reference Renard and Deck2016) have highlighted the relevance of the Reynolds shear stress contribution. As an example, Deck et al. (Reference Deck, Renard, Laraufie and Weiss2014b) employed the decomposition from Fukagata et al. (Reference Fukagata, Iwamoto and Kasagi2002) to identify that turbulent structures for which
 $\lambda _x > \delta$ contribute to more than
 $60\,\%$ of the second term of the friction coefficient decomposition from Fukagata et al. (Reference Fukagata, Iwamoto and Kasagi2002), which is the most relevant term in the friction coefficient, since it represents more than
 $80\,\%$ of the total friction coefficient.
Before studying the friction coefficient, the reverse flow is analysed by the fraction of time for which the flow moves downstream,  $\gamma _u = t( u > 0 ) / T$, and it is displayed in figure 18, for the first cell away from the wall, because of the no-slip condition at the wall. According to Simpson (Reference Simpson1981), there are several states of boundary layer separation that may be identified: incipient detachment (ID) for
 $\gamma _u = 0.99$, intermittent transitory detachment (ITD) for
 $\gamma _u = 0.80$, and transitory detachment (TD) for
 $\gamma _u = 0.50$. Simpson (Reference Simpson1981) defined another state as detachment (D), based on the mean wall shear stress
 $\langle \tau _w \rangle$, instead of the fraction of time for which the flow moves downstream. Thus detachment appears when
 $\langle \tau _w \rangle = 0$, and several studies have shown that TD and D take place at the same location (see, for instance, the work of Simpson Reference Simpson1989; Na & Moin Reference Na and Moin1998). The parameter
 $\gamma _u$ is a classical quantity very often analysed in turbulent boundary layer separation studies (Simpson Reference Simpson1989; Na & Moin Reference Na and Moin1998; Driver, Seegmiller & Marvin Reference Driver, Seegmiller and Marvin1987; Mohammed-Taifour & Weiss Reference Mohammed-Taifour and Weiss2016, Reference Mohammed-Taifour and Weiss2021; Elyasi & Ghaemi Reference Elyasi and Ghaemi2019), and according to Simpson (Reference Simpson1989), it is a feature that should be documented in this kind of work. It may also be a quantity of practical interest for the experimental detection of separation onset and reattachment (see, for instance, Mohammed-Taifour et al. Reference Mohammed-Taifour, Schwaab, Pioton and Weiss2015; Weiss, Mohammed-Taifour & Schwaab Reference Weiss, Mohammed-Taifour and Schwaab2015).
Evolution of the fraction of time for which the flow moves downstream ( $\gamma _u$) at the first cell away from the wall, and friction coefficient skewness near the reattachment region and further downstream. Here,
 $S_{{C_f}^\prime, ZPG}$ is taken from a ZPG turbulent boundary layer at
 $Re_\theta = 13{,}000$.

The skewness of the friction coefficient is also presented in figure 18, normalised by the value obtained for a ZPG turbulent boundary layer at  $Re_\theta =13{,}000$ also using ZDES mode 3. Since the focus is set on the redevelopment and relaxation of the boundary layer towards ZPG canonical flow, the authors have chosen to use the mentioned normalisation. The analysis of this quantity gives relevant information about the near-wall fluctuations, and it is an essential quantity to study the influence of outer layer large scales on inner layer small scales in high-Reynolds-number wall-bounded turbulent flows (Mathis et al. Reference Mathis, Marusic, Hutchins and Sreenivasan2011).
As observed in figure 18,  $\gamma _u$ is significantly low within the recirculation bubble, reaching values of about 0.17 for the small plateau at
 $1.1< x^\prime < 1.3$. Downstream,
 $\gamma _u$ increases monotonically, even after reattachment (where
 $\gamma _u=0.5$), and reaches
 $\gamma _u=1$ at some point between
 $x^\prime =1.7$ and
 $x^\prime =2.5$, downstream of which almost no reverse flow is observed. It is interesting to notice that in the recirculation bubble, there is still some downstream flow (
 $\gamma _u >0$), something that is also observed, for instance, in the DNS of Na & Moin (Reference Na and Moin1998), because the velocity fluctuations and the mean velocity are of the same order of magnitude in the recirculation bubble (Simpson Reference Simpson1989). Another aspect worth mentioning is the high values of
 $\gamma _u$ upstream of
 $x^\prime =1.1$, that reach
 $\gamma _u > 0.5$. It is the consequence of a very tiny recirculation bubble located in the corner of the rounded step resulting from this sharp geometry change, and it is similar to the secondary recirculation identified in backward-facing step studies (such as in Le, Moin & Kim Reference Le, Moin and Kim1997).
An increase of the skewness of the friction coefficient ( $S_{{C_f}^\prime }$) within the recirculation bubble in the streamwise direction is observable as well. As already specified, the skewness is normalised by the value in a ZPG turbulent boundary layer flow, simulated with the same approach. In figure 18, the skewness varies significantly: within the recirculation bubble, it takes mainly negative values and increases from
 $S_{{C_f}^\prime } \approx -3S_{{C_f}^\prime,ZPG}$ until reaching
 $S_{{C_f}^\prime } \approx S_{{C_f}^\prime,ZPG}$ at the reattachment point. Contrary to
 $\gamma _u$, downstream of
 $x^\prime =1.05$, the skewness seems to increase monotonically inside the recirculation bubble, even surpassing the ZPG value downstream of reattachment, up to a maximum of about
 $3S_{{C_f}^\prime,ZPG}$, and then it decreases, almost reaching the ZPG level, although it is not yet attained at
 $x^\prime =7$. It is interesting to notice that it is around
 $x^\prime =7$ where the outer peak in
 $\mathcal {P}_k$ changes its trend in the way described in § 4.1. This shows that non-equilibrium conditions are significant upstream of
 $x^\prime \approx 7$, and downstream the boundary layer is close to near-equilibrium. Such a result is evidenced in the evolution of both the outer peak of
 $\mathcal {P}_k$ and
 $S_{{C_f}^\prime }$, contrary to that of
 $\gamma _u$. Near
 $x^\prime =1$, the skewness is significantly greater than it is around
 $x^\prime =1.1$, and it decreases right downstream, which is in contrast with the behaviour described earlier, but this is likely due to the presence of the small secondary recirculation bubble mentioned before.
The probability density function (PDF) of the friction coefficient is presented in figure 19 around the reattachment region and at three different locations downstream (stations  $P_4$,
 $P_5$ and
 $P_6$), and in figure 20 as normalised profiles at different streamwise positions. The PDF is very narrow near
 $x^\prime =1$ and then broadens (
 $C_{f,rms}$ increases) in the recirculation bubble until
 $x^\prime =1.3$, downstream of which it seems to maintain a similar width that changes very slowly. Very far downstream, at
 $x^\prime =7$, the PDF has clearly narrowed (
 $C_{f,rms}$ has decreased) and resembles the most what is observed in a ZPG turbulent boundary layer from ZDES. For
 $1.1 < x^\prime < 1.3$, the flow is reversed and the friction coefficient increases in magnitude (it decreases in figure 19), which suggests that a stronger reversed flow develops. However, the PDF is broader and
 $C_{f,rms}$ increases as well in this region, which indicates that some downstream flow is still present, as already mentioned. The increase in
 $C_{f,rms}$ is enough to compensate the stronger reversed flow such that a plateau is observed for
 $\gamma _u$.
Probability density function of the mean friction coefficient near the reattachment region and further downstream. The continuous line indicates streamwise evolution of the mean friction coefficient. The dashed lines indicate streamwise evolution of the friction coefficient root-mean-square. Stations  $P_4$,
 $P_5$ and
 $P_6$ are located respectively at
 $x^\prime = 2.5$,
 $x^\prime = 4$ and
 $x^\prime =7$.

Probability density function of the friction coefficient at different streamwise positions. The black dashed line corresponds to a ZPG turbulent boundary layer at  $Re_\theta = 13{,}000$.

From figure 20, it is possible to observe the change in the position of the peak of the PDF. At  $x^\prime =1.2$, the peak is located the most to positive values of
 $\tau _w^\prime = \tau _w - \langle \tau _w \rangle$ when normalised with
 $\tau _{w,rms}$, and it shifts to negative values upstream of
 $x^\prime =1.63$. Then from
 $x^\prime =2.5$ to
 $x^\prime =7$, the peak is shifted again back to higher values of
 $\tau _w^\prime /\tau _{w,rms}$, although it remains at negative levels of
 $\tau _w^\prime /\tau _{w,rms}$. This behaviour corresponds to what has already been described for the skewness in figure 18. Indeed, for this kind of PDF distribution, a negative skewness will result in a shift of the peak position to positive values of
 $\tau _w^\prime /\tau _{w,rms}$, and vice versa. At the furthest position presented, the PDF resembles very accurately that of the ZPG boundary layer. Moreover, the high values of skewness identified in figure 18, which overcome by far the ZPG value, are also evidenced clearly in the shape of the PDF at
 $P_4$ in figures 19 and 20. In particular, in figure 20, the relaxation towards near-equilibrium conditions is clearly evidenced. It is also interesting to notice that at the position of minimum friction coefficient, which is
 $x^\prime =1.3$, the skewness is
 $S_{{C_f}^\prime }\approx -S_{{C_f}^\prime,ZPG}$, which means that the skewness is the same as in ZPG conditions, but with the opposite sign due to the contrary flow direction.
5. Conclusions
The non-equilibrium dynamics of a high-Reynolds-number turbulent boundary layer recovering from a strong disturbance caused by separation at a rounded step is studied utilising ZDES mode 3. The simulation resolves finely the outer layer turbulence and its relaxation towards near-equilibrium at high Reynolds numbers ranging from  $Re_\theta = 22{,}800$ to 24,300, and
 $Re_\tau = 5900$ to 6600, along the redevelopment region, which are probably non-affordable for DNS or WRLES. After reattachment, the boundary layer redevelops under almost ZPG conditions, but the outer layer contains an excess of turbulent activity generated in the shear layer above the recirculation bubble. The simulation shows very good agreement with experimental profiles, and in particular, it has been observed that the outer peak in the Reynolds shear stress in the relaxation region, following the excess of turbulent activity above the separated region, is very well predicted in terms of both levels and position within the boundary layer.
The spectral analysis of the streamwise turbulent fluctuations has evidenced the substantial modification of energy distribution between scales due to the separation of the boundary layer. Upstream of separation, large turbulent structures have been identified to carry most of the contribution to  $u_{rms}$, and the Reynolds number seems great enough so that activity from very large structures, longer than the typical VLSM of ZPG turbulent boundary layers, is observable. At the recirculation bubble, the energy levels are increased sharply due to the turbulence generated in the shear layer, and three spots (one corresponding to the shear layer mode and two to the shedding mode) are observed. Far downstream of reattachment, the PSD recovers lower levels, close to those obtained upstream of separation, but turbulent fluctuations are spread broadly between structures ranging from
 $\lambda _x = 1.5\delta$ to
 $\lambda _x = 9\delta$. Also, turbulent activity is more important than upstream of separation due to both the effect of the high Reynolds number (
 $Re_\theta = 23{,}400$) and the imprint of the shear layer from the recirculation bubble.
The spectral analysis of turbulent kinetic energy production has manifested a wide range of turbulent scales involved in the excess of production in the shear layer. Dominating this broadband content, the shear layer and the shedding modes are again identified. For station  $P_6$, despite its location being far downstream of reattachment, the excess of TKE production from the shear layer is still clearly visible in the outer part of the boundary layer, mainly between
 $y=0.25\delta$ and
 $y=0.8\delta$, which is significantly higher in the boundary layer profile than what is observed in canonical conditions. The wavelengths of the structures participating in this excess of
 $\mathcal {P}_k$ range from
 $\lambda _x = 0.2\delta$ to
 $\lambda _x> 10\delta$, with the large scales (
 $\lambda _x > \delta$) comprising the main contribution. This results in a non-canonical secondary peak in
 $\mathcal {P}_k$ moving away from the wall until
 $x^\prime =6$, beyond which its wall distance does not change significantly up to
 $x^\prime \approx 11$, where the peak disappears.
The fraction of downstream flow at the first cell away from the wall,  $\gamma _u$, and the friction coefficient skewness
 $S_{{C_f}^\prime }$, have shown interesting behaviours within the recirculation bubble and in the recovery region. A plateau for
 $\gamma _u$ is obtained inside the recirculation bubble, but
 $\gamma _u$ remains positive, which means that there is still some downstream flow happening right above the wall. The skewness near the reattachment point is very close to values in ZPG canonical conditions, and downstream it continues to grow until a maximum around
 $3S_{{C_f}^\prime,ZPG}$. Beyond this,
 $S_{{C_f}^\prime }$ decreases, and it is very close to ZPG values around
 $x^\prime =7$ (although still slightly larger than
 $S_{{C_f}^\prime,ZPG}$), which is more or less the same location where the behaviour of the outer peak location of
 $\mathcal {P}_k$ changes. Therefore, upstream of
 $x^\prime =7$, the boundary layer is in strong non-equilibrium conditions, but the relaxation is evidenced, even if at
 $x^\prime =7$, near-equilibrium is not yet reached completely. The PDF of the friction coefficient has been analysed further, showing an important change throughout the recirculation bubble and downstream of it. Indeed, the normalised PDF tends to the distribution obtained in ZPG canonical conditions, which is almost reached at
 $x^\prime =7$.
The capacity of three RANS models of increasing complexity to reproduce the mean flow has also been assessed, namely two classical RANS eddy-viscosity models (the Spalart–Allmaras and the  $k$-
 $\omega$ SST) and a Reynolds stress model (RSM). Upstream of separation, results from all the RANS models are quite satisfactory. However, in the recovery region, results from both eddy-viscosity models are perfectible, and the trend of the friction coefficient is well captured only by the RSM. Nevertheless, the levels of the Reynolds normal stresses after reattachment, not provided by the eddy-viscosity models, are underestimated significantly by the RSM. In the relaxation region, all RANS models predict a secondary peak of the Reynolds shear stress at position
 $y\approx 0.24\delta$, which is lower than
 $y\approx 0.32\delta$ obtained in both the ZDES computation and the experiment.
The field of production of TKE has also been assessed through the different RANS models. Both eddy-viscosity models, particularly the Spalart–Allmaras model, are too dissipative, and the secondary peak disappears at shorter distances downstream than in the case of ZDES. The RSM model, in turn, is less dissipative than the Spalart–Allmaras and  $k$-
 $\omega$ SST models; however, it happens to be too little dissipative compared to ZDES. Also, the streamwise evolution of the outer peak location is only partially well reproduced by the RSM.
For the first time, the recovery of a separated turbulent boundary layer at high Reynolds number has been studied numerically in detail with experimental validation, thanks to the ZDES mode 3 approach. The Reynolds number is too high for DNS or WRLES, and quite high even for lower-resolution methods. This is a major step forward in terms of understanding and quantifying the applicability of scale-resolving approaches to predict the properties of out-of-equilibrium wall-bounded turbulence at Reynolds numbers that may not be reached easily by DNS. More precisely, the present investigation confirms the long-lasting impact of perturbations of the outer layer in high-Reynolds-number wall-bounded flows. It is shown that the relaxation distance depends on the observed quantity. In particular, the wall quantities seem to converge faster towards near-equilibrium values than outer layer quantities such as the secondary peak of the production of turbulent kinetic energy. Also, the significant region where the turbulence is out of equilibrium induces difficulties for RANS modelling. This adds to the ever-broadening range of results suggesting that the study of non-canonical flows will be a pacing item in turbulence research in the coming years, as advocated by Smits (Reference Smits2020).
Acknowledgements
The authors are thankful to all the people involved in the evolution of the FLU3M and elsA solvers. The thesis of J. Vaquero is partly funded by DGA (French defence procurement agency). Support from the framework of the ONERA research project FROTTEMENT is also acknowledged. The authors would also like to thank the reviewers of the present paper for their suggestions.
Declaration of interests
The authors report no conflict of interest.
Appendix A. ZDES mode 3: a WMLES approach
The outer layer turbulence is resolved using an LES approach by means of ZDES mode 3 (Deck Reference Deck2012). The Spalart–Allmaras turbulence model (Spalart & Allmaras Reference Spalart and Allmaras1994) plays the role of the SGS model, linking the filtered component of the Reynolds stress tensor to the mean field according to Boussinesq's hypothesis:
 \begin{equation} -\rho \langle u^\prime_i u^\prime_j \rangle = 2 \mu_t \langle S_{ij} \rangle - \dfrac{2}{3}\rho k \delta_{ij}, \quad \langle S_{ij} \rangle = \dfrac{1}{2} \left( \dfrac{\partial \langle u_i \rangle}{\partial x_j} + \dfrac{\partial \langle u_j \rangle}{\partial x_i} \right), \end{equation}
where  $\rho$ is the density,
 $\mu _t$ is the eddy viscosity,
 $k$ is the turbulent kinetic energy, and
 $\delta _{ij}$ is the Kronecker delta (tensor). Equation (A1) gives Boussinesq's hypothesis for incompressible flows, which may be applied to the flow studied in the present work, and the operator for the LES filter is denoted by
 $\langle \bullet \rangle$. The Reynolds average is a particular case of operator. It is important to note that the Spalart–Allmaras model does not provide the turbulent kinetic energy field, and therefore the second term on the right-hand side of (A1) is not included in ZDES, but this is not problematic for quasi-incompressible flows. For LES, the Spalart–Allmaras model shows behaviour similar to the Smagorinsky SGS model in equilibrium conditions. Indeed, when the length scale of the model
 $d_w$ is substituted with
 $C_{DES} \varDelta$ (where
 $C_{DES}$ is a constant, and
 $\varDelta$ is the filter length scale) and it is assumed that there is equilibrium between production and destruction of
 $\nu _t$, it is obtained that
 $\nu _t \sim S \varDelta ^2$, where
 $S$ is the local deformation rate (Spalart et al. Reference Spalart, Jou, Strelets and Allmaras1997; Deck Reference Deck2012; Sagaut, Deck & Terracol Reference Sagaut, Deck and Terracol2013). According to Deck (Reference Deck2012), a better LES behaviour is obtained when modifying some of the functions included in the model of Spalart & Allmaras (Reference Spalart and Allmaras1994):
 $f_{v1}=1$,
 $f_{v2}=0$,
 $f_w=1$. Moreover, ZDES has already been used by Deck et al. (Reference Deck, Renard, Laraufie and Weiss2014b) for a wall-resolved LES of a high-Reynolds-number turbulent boundary layer.
In this study, the inner layer turbulent structures are less resolved the closer to the wall they are located. As presented by Renard & Deck (Reference Renard and Deck2015a), the resolved fraction of the Reynolds shear stress gradually decreases within the RANS region. Nevertheless, a RANS approach is considered, again using the Spalart–Allmaras turbulence model, in the inner layer region of the boundary layer, to take the effect of the inner layer structures on resolved structures and mean field into account. Thus ZDES mode 3 may be seen as a WMLES, and it has already been employed in this form in several studies (Deck et al. Reference Deck, Weiss, Pamiès and Garnier2011, Reference Deck, Renard, Laraufie and Sagaut2014a; Renard & Deck Reference Renard and Deck2015a). The separation between the RANS region (near the wall) and the LES region (in the remainder of the domain) is defined explicitly by an interface  $d_{w}^{interface}$ specified by the user (typically a fraction of the boundary layer thickness, as defined in § 2.2). The modified length scale
 $\tilde {d}_{ZDES}^{III}$ considered in the Spalart–Allmaras equation for ZDES mode 3 can be expressed as (Deck Reference Deck2012)
 \begin{equation} \tilde{d}_{ZDES}^{III}
= \left\{\begin{array}{@{}ll} d_w & \text{if} \ d_w <
d_{w}^{interface},\\
\min(d_w,C_{DES}\varDelta_{vol}) & \text{if}
\ d_w \geq d_{w}^{interface}, \end{array} \right.
\end{equation}
where  $d_w$ is the wall distance,
 $C_{DES}=0.65$,
 $\varDelta _{vol}=\mathcal {V}^{{1}/{3}}$ and
 $\mathcal {V}$ is the cell volume. A recent improvement of ZDES mode 3 has been proposed by Renard & Deck (Reference Renard and Deck2015c), aiming to regularise the binary switch from RANS to LES in (A2) through a smooth function
 $f_\delta$. Finally,
 $\tilde {d}_{ZDES}^{III}$ is written as
 \begin{equation} \tilde{d}_{ZDES}^{III} = ( 1-f_\delta ) \times d_w + f_\delta \times \min ( d_w, C_{DES} \varDelta_{vol} ), \end{equation}
and the modified functions become
 \begin{equation} \left.\begin{aligned} & f_{v1}^{III} = ( 1-f_\delta ) \times f_{v1} + f_\delta, \\ & f_{v2}^{III} =( 1-f_\delta ) \times f_{v2}, \\ & f_{w}^{III}= ( 1-f_\delta ) \times f_{w} + f_\delta. \end{aligned}\right\} \end{equation}
Appendix B. Further comparisons of mean flow quantities
For the sake of clarity in the paper, comparisons of the mean field to the experimental measurements at different stations upstream of the region of interest of this study are not shown in § 3.2, but are recalled here. Figures 21 and 22 display the mean velocity and Reynolds shear stress profiles at two different stations upstream of separation, more precisely at  $x^\prime =-2$ and
 $x^\prime =0$. For both stations, the wake region and the log layer are barely distinguished in the mean velocity profiles, and a small excess in the Reynolds shear stress appears in the outer layer due to the curvature effects experienced upstream. ZDES slightly underestimates the experimental results in the log region of the mean velocity at
 $x^\prime =-2$. However, this difference is small, and the prediction of the Reynolds shear stress is very satisfying for ZDES, especially considering the outer peak that is not well reproduced by RANS models (it is even absent for the two eddy-viscosity models). At station
 $x^\prime =0$, ZDES is in excellent accordance with the experiment, and there is still a minor disagreement in the log region between RANS models and ZDES, where RANS models overestimate the mean velocity. Again, the Reynolds shear stress is fairly well reproduced by ZDES. It is possible to observe that ZDES reproduces the slight excess of Reynolds shear stress in the outer layer, almost at the edge of the boundary layer.
Mean velocity (a) and Reynolds shear stress (b) profiles at  $x^\prime =-2$. The dashed vertical line indicates the position of the RANS/LES interface. For ZDES, the Reynolds shear stress profile is split into modelled (dotted) and resolved (dashed) contributions.

Mean velocity (a) and Reynolds shear stress (b) profiles at  $x^\prime =0$. The dashed vertical line indicates the position of the RANS/LES interface. For ZDES, the Reynolds shear stress profile is split into modelled (dotted) and resolved (dashed) contributions.

Mean velocity (a) and Reynolds shear stress (b) profiles at  $x^\prime =1$.

Profiles of mean velocity and Reynolds shear stress are given in figure 23 at  $x^\prime =1$, which corresponds to the end of the round step. These profiles are placed within the recirculation bubble, and they are normalised by the inflexion velocity
 $U_{infl}$, which is the mean velocity at the inflexion point of the shear layer, and the distance from the inflexion point to the wall,
 $y_{infl}$. The values of
 $y_{infl}$ and
 $U_{infl}$ are given in table 2, and they are reproduced satisfactorily by ZDES, whereas RANS models are less accurate. In particular, the Spalart–Allmaras model predicts the inflexion point too close to the wall. ZDES reproduces the mean velocity profile satisfactorily (figure 23), and the minimum value appears to be well positioned despite the mean velocity underestimation (in absolute value). In the experiment, the minimum value is located at
 $y\approx 0.1y_{infl}$, and ZDES gives
 $y\approx 0.13y_{infl}$. Regarding the Reynolds shear stress profile, the prediction of ZDES is very accurate compared to experimental measurements, although there is a moderate underestimation for
 $y\approx 0.6 y_{infl}$.
Inflexion point position and streamwise mean velocity at  $x^\prime =1$. Here,
 $U_{e,ref}$ corresponds to the external velocity at the reference station
 $x^\prime =-2$.

When looking at RANS results in the mean velocity profile, the  $k$-
 $\omega$ SST model and RSM give very close results above
 $0.5y_{infl}$, but they do not reach the levels of ZDES above
 $1.2y_{infl}$. Greater discrepancies are found for the Spalart–Allmaras model, which underestimates strongly the mean velocity profile away from the wall. In the near-wall region, the RSM shows the same underestimation as observed for ZDES. However, the trend obtained from the three RANS models is quite different from the experiment, and the minimum value of the mean velocity is located closer to the wall, around
 $y=0.05y_{infl}$ compared to
 $y \approx 0.1y_{infl}$ in the experiment. Much more discrepancies with the experiment are evidenced in the profiles of Reynolds shear stress for the RANS models. The observed peak and values below it are underestimated significantly, and in the near-wall region, all RANS models predict negative levels of the Reynolds shear stress
 $-\langle u^\prime v^\prime \rangle$, contrary to ZDES and the experiment. This is probably a modelling issue for both RSM and the eddy-viscosity models. Indeed, for the eddy-viscosity models, it is common practice to ensure that the eddy viscosity is always positive, and at this location, the term
 $\langle S_{12} \rangle$ of the stain-rate tensor takes negative values. Above the peak, RSM results are quite satisfactory, but both eddy-viscosity models overestimate the Reynolds shear stress, especially the Spalart–Allmaras model. It is important to mention that the position of the peak in the Reynolds shear stress is reasonably well reproduced by all the computations, but this is not surprising due to the normalisation by the inflexion point position of the mean velocity profile. Indeed, the inflexion point corresponds to the position of maximum mean shear, hence turbulent production is large at this location.



