Introduction
Haemaphysalis longicornis (Acari: Ixodidae) is one of the most common and important arthropod disease vectors for human and animal health in Japan. This species is known to be a carrier of the causative agents of Japanese spotted fever (Mahara, Reference Mahara1997) and bovine theileriosis (Ishihara, Reference Ishihara1968; Kamio et al., Reference Kamio, Fujisaki and Minami1989). This species has a wide distribution in Far East Asia and has also been introduced into the Australian and Oceania regions (Hoogstraal et al., Reference Hoogstraal, Roberts, Kohls and Tipton1968). Its distribution extends over all of Japan (Yamaguchi et al., Reference Yamaguchi, Tipton, Keegan and Toshioka1971), and it has a variety of animal hosts, ranging from small to large mammals and birds (Yamaguchi et al., Reference Yamaguchi, Tipton, Keegan and Toshioka1971).
Grazing cattle are the major hosts of H. longicornis in grasslands, including on pastures in Japan (Kitaoka et al., Reference Kitaoka, Morii and Fujisaki1975; Yamane et al., Reference Yamane, Nishiguchi, Kobayashi and Zeniya2006), and sika deer (Cervus nippon, Artiodactyla: Cervidae) in forested areas is considered to be one of the most important wild host species for this tick species at all developmental stages (Mori et al., Reference Mori, Tsunoda and Fujimagari1995; Inokuma et al., Reference Inokuma, Fujimoto, Hosoi, Tanaka, Fujisaki, Okuda and Onishi2002; Yamauchi et al., Reference Yamauchi, Tabara, Kanamori, Kawabata, Arai, Katayuama, Fujita, Yano, Takada and Itagaki2009). Sika deer is the only native species of the family Cervidae in Japan (Ohdachi et al., Reference Ohdachi, Ishibashi, Iwasa and Saitoh2009) and has recently expanded in range and numbers (Takatsuki, Reference Takatsuki2009), causing serious problems such as agricultural damage (Yamane et al., Reference Yamane, Nakamura and Tsukada2009; Tsukada, Reference Tsukada2011), destruction of natural vegetation (Takatsuki, Reference Takatsuki2009), and deterioration of ecosystem function (Takatsuki & Maeyama, Reference Takatsuki and Maeyama2007). Likewise, the expansion of areas with tick-borne endemic diseases and an increase in disease occurrences related to the drastic changes in distribution and density of the host sika deer are of concern from the perspective of animal health (Inokuma et al., Reference Inokuma, Fujimoto, Hosoi, Tanaka, Fujisaki, Okuda and Onishi2002, Reference Inokuma, Seino, Suzuki, Kaji, Takahashi, Igota and Inoue2008). Although sika deer has not been confirmed to be a reservoir of the causative agent of bovine theileriosis (Inokuma et al., Reference Inokuma, Tsuji, Kim, Fujimoto, Nagata, Hosoi, Arai, Ishihara and Okuda2004) and Japanese spotted fever (Inokuma et al., Reference Inokuma, Seino, Suzuki, Kaji, Takahashi, Igota and Inoue2008), sika deer can be an amplifier host of the tick carrying these pathogens (Yamauchi et al., Reference Yamauchi, Tabara, Kanamori, Kawabata, Arai, Katayuama, Fujita, Yano, Takada and Itagaki2009; Inokuma & Yokoyama, Reference Inokuma and Yokoyama2010).
While some studies on tick fauna have shown that there is a higher abundance of adult and nymphal H. longicornis in areas with higher densities of sika deer (Yamauchi et al., Reference Yamauchi, Tabara, Kanamori, Kawabata, Arai, Katayuama, Fujita, Yano, Takada and Itagaki2009), another has shown that the abundance of larval H. longicornis is also negatively affected by the decrease in plant coverage, plant height, and litter depth caused by the presence of sika deer in high density (Tsunoda, Reference Tsunoda2007b ). These previous studies suggest that sika deer density can have different effects on the abundances of questing H. longicornis in different stages. In addition, the abundance of H. longicornis is influenced by various abiotic factors, including temperature (Fujisaki et al., Reference Fujisaki, Kitaoka and Morii1975; Heath, Reference Heath1981; Sutherst & Bourne, Reference Sutherst and Bourne1991; Fujimoto, Reference Fujimoto1993), rainfall (Yamane et al., Reference Yamane, Nishiguchi, Kobayashi and Zeniya2006), humidity (Heath, Reference Heath1981; Fujimoto, Reference Fujimoto1988; Tsunoda, Reference Tsunoda2008), and photoperiod (Fujimoto, Reference Fujimoto2000, Reference Fujimoto2008).
In order to develop effective control measures against bovine theileriosis among grazing cattle on livestock farms in Japan, it is important to determine the relative contribution of sika deer density and other biological and abiotic factors, including climatic and geographical parameters, on H. longicornis individuals questing at each stage. Here we use generalized linear mixed model (GLMM) analysis to evaluate these effects at three sites in the central region of Honshu.
Materials and methods
Study area
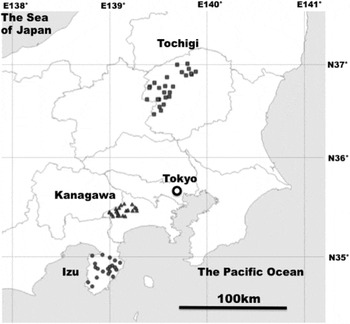
The study was conducted in the three regions in central Japan (fig. 1): Tochigi Prefecture and Izu Peninsula in Shizuoka Prefecture in 2008, and in Kanagawa Prefecture in 2009. These regions were selected from areas in which population density surveys of sika deer were already being conducted by each respective prefectural government. Within each sampling area, 27 (mean size, 1.41 km2; range, 0.78–2.09 km2), 21 (size data are not available; line transects totaling 300 m were surveyed in each area) and 22 (mean size, 1.65 km2; range, 1.20–2.09 km2) sampling sites, respectively, were used for analysis (fig. 1). These sampling sites are all located in forested areas of various types (Supplementary data) and did not include any pasture land used for grazing cattle.
Locations of tick sampling sites in three regions of central Japan: Tochigi Prefecture, Izu Peninsula, and Kanagawa Prefecture. Sampling sites in each region are represented by the same symbol, and thin lines indicate the prefecture borders.

Deer population density
We used data from prefectural surveys of sika deer in Tochigi Prefecture, Izu Peninsula, and Kanagawa Prefecture.
Tochigi Prefecture
In Tochigi Prefecture, deer population surveys had been conducted annually at 30 sites by the block count method (Maruyama & Furubayashi, Reference Maruyama and Furubayashi1983) from August to October since 2003. We selected 27 sites for our tick sampling survey, excluding three sites that were inaccessible for tick sampling. We used averaged density of sika deer at each sampling site over the period of 2003–2007 for GLMM analysis because we assumed that there was annual fluctuation in the population as well as sampling error.
Izu Peninsula
On Izu Peninsula in Shizuoka Prefecture, sampling surveys to estimate the density of sika deer had been performed annually at about 10–20 sites out of 72 sites since 2001 using the fecal pellet count method and analysis by the program FUNRYU (Iwamoto et al., Reference Iwamoto, Sakata, Nakazono, Kaoka, Ikeda, Nishishita, Tokida and Doi2000) along line transects (300 m site−1). We selected the 21 sites where deer fecal pellet count surveys had been performed twice from December 2006 to January 2007 and February to March 2007 for our tick sampling survey, excluding one sampling site that was difficult to access (fig. 1). We used sika deer densities averaged over two samplings for each site for later GLMM analysis, and these data were calculated using the program FUNRYU (Iwamoto et al., Reference Iwamoto, Sakata, Nakazono, Kaoka, Ikeda, Nishishita, Tokida and Doi2000).
Kanagawa Prefecture
In Kanagawa Prefecture, deer population surveys had been conducted annually at 11–24 sites out of 52 sites by the block count method (Maruyama & Furubayashi, Reference Maruyama and Furubayashi1983) during the winter (December–January) from 2003 to 2008 (Wildlife Management Office, 2009). We selected 22 out of 27 sites where the deer population survey had been conducted in 2008 for our tick sampling survey, excluding five sites that were inaccessible for tick sampling (fig. 1). We used averaged densities of sika deer at each sampling site in the period of 2004–2008 for our later analysis because we assumed that that there was annual fluctuation in the population as well as sampling error.
Ticks
The locations of the deer sampling sites in the three regions were entered into in a handheld GPS (GPSMAP 60CSx, Garmin, Ltd, Olathe, KS) in advance of tick sampling, and the exact location of each sampling survey was recorded. Questing ticks were collected by flagging with a white cotton flannel cloth (0.7×0.7 m) on the vegetation for 30 min at each tick sampling survey site in spring (May–June), summer (July–August), and autumn (September–October) in order to sample for seasonal activity and tick stages (Fujimoto, Reference Fujimoto2000, Reference Fujimoto2004; Tsunoda, Reference Tsunoda2007a ). Tick-sampling surveys were conducted daily (weather permitting) for about a week in each season, and sampling was conducted in the daytime but with variation in the timing among the sites due to logistical limitations. The ticks collected during each sampling survey were placed in vials with 70% ethanol for later examination in the laboratory. Ticks were examined for morphological characteristics, identified by stage, sex, and species according to references (Fujita & Takada, Reference Fujita and Takada2007; Yamaguchi et al., Reference Yamaguchi, Tipton, Keegan and Toshioka1971), and then enumerated.
Climatic and geographical data
A total of six climatic and geographical variables were analyzed as potential abiotic factors for the local abundance of ticks: (1) altitude, (2) mean temperature, (3) rainfall, (4) duration of sunshine without shading, (5) global solar radiation without shading, and (6) depth of snow cover. Data sets for these parameters were obtained from the Mesh Climatic Data 2000 (Japan Meteorological Agency, 2002). The data sets include various climatic variables in a 1-km mesh for the period 1971–2000 that were used as Japanese climate normals until May 2011 by the Japan Meteorological Agency.
Model development
We adopted a model selection approach to assess the factors influencing the abundance of ticks at each stage (Burnham & Anderson, Reference Burnham and Anderson2002; Johnson & Omland, Reference Johnson and Omland2004). We made several sets of working hypotheses, including that local H. longicornis tick abundance at each stage (response variables: abundance of larval, nymphal, and adult H. longicornis) was influenced by three biological factors: (1) density of sika deer, (2) abundance of H. longicornis in the previous stage, and (3) abundance of Haemaphysalis megaspinosa ticks of the same stage, and six climatic-geographical factors: (1) altitude, (2) mean temperature, (3) rainfall, (4) duration of sunshine without shading, (5) global solar radiation without shading, and (6) depth of snow cover. To investigate these working hypotheses, we applied a GLMM with a negative binomial error structure to the data, which were log transformed with the statistical software R (ver. 2.13.2, R Development Core Team, 2011) using the glmmADMB package (Skaug et al., Reference Skaug, Fournier, Nielsen, Magnusson and Bolker2012). In these models, the three regions (Tochigi Prefecture, Izu Peninsula, and Kanagawa Prefecture) were regarded as a random effect, along with the density of sika deer, which had random variable intercepts and slopes. Since the methods of estimating the density of sika deer differed among the regions, we assumed that the association between tick abundance and deer density also varied among the regions. As a preliminary analysis, we set the abundance of ticks in each stage as the response variable in a generalized linear model (GLM) and assumed three error distributions: normal, Poisson, and negative binominal. We confirmed that the GLM with a negative binominal error distribution showed the lowest Akaike information criterion (AIC) values in all stages.
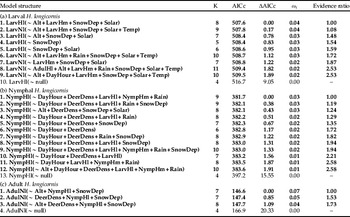
We used AIC adjusted for small sample size (AICc; Burnham & Anderson, Reference Burnham and Anderson2002) to identify the subsets of parameters for the GLMM (table 1). AICc was calculated for all possible additive models starting with the full model, and models were ranked by AICc values. From the differences in AICc values (ΔAICc), AIC weights (ω i ) were calculated. For ΔAICc<2, which indicates approximately equal parsimony of models, all variables considered in the full model were ranked according to importance (predictor weights, ω+(j); Burnham & Anderson, Reference Burnham and Anderson2002). Unless a single model had a ω i >0.9, all other models were considered when interpreting the data (Burnham & Anderson, Reference Burnham and Anderson2002). To estimate the relative importance of predictor variables, x j (relative variable importance, RVI), the sum of the Akaike weights across the best models (ΔAICc<2) in the sets where variable j occurs was calculated. Using the RVI, the importance of all the variables was ranked (Burnham & Anderson, Reference Burnham and Anderson2002).
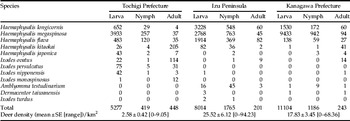
Species and number of ixodid ticks collected by the flagging method in three regions of central Japan.

Results
Tick species and stage distribution
In total, 6144, 9980, and 12,533 ticks were collected in Tochigi Prefecture, Izu Peninsula, and Kanagawa Prefecture, respectively. The ticks (all Acari: Ixodidae) were morphologically classified into 4 genera and 12 species (table 1). H. megaspinosa (63.8%) was the most abundant species, followed by H. longicornis (21.9%), Haemaphysalis flava (11.3%), Haemaphysalis kitaokai (1.4%), Ixodes ovatus (0.6%), and Ixodes persulcatus (0.4%). The three major species comprised 96.9% of all ticks. Other species (all Acari: Ixodidae), such as Amblyomma testudinarium, Haemaphysalis japonica, Ixodes nipponensis, Ixodes monospinosus, Dermacentor taiwanensis, and Ixodes turdus, were collected in fewer numbers. The three major species were found in all three regions, but some species, such as I. persulcatus, I. monospinosus, and I. turdus, were site-specific.
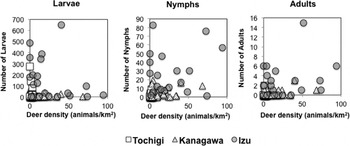
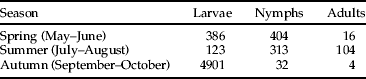
The number of H. longicornis ticks in each stage was plotted against the deer density (fig. 2). This simple nonparametric correlation analysis showed that the abundance of nymphs and adults was positively correlated with deer density (nymph, Kendall's τ = 0.28, P < 0.001; adult, Kendall's τ = 0.19, P < 0.05), but the abundance of larvae was not (Kendall's τ = 0.05, P>0.5). The seasonal abundance of H. longicornis varied with stage, with larvae, nymphs, and adults being collected mainly in autumn, spring, and summer, respectively (table 2).
Relationship between H. longicornis tick abundance by stage (larval, nymphal, and adult) and sika deer density at each tick-sampling site.

Total number of H. longicornis larvae, nymphs, and adults collected by season

GLMM analysis of factors influencing the abundance of questing ticks
A total of 9, 12, and 3 best-ranked models (that is, ΔAICc < 2) were identified for larval, nymphal, and adult stages, respectively (table 3). No single model emerged as the top-ranking model (that is, ω i > 0.9) among all stages. Therefore, the differences among these best-ranked models are considered not to be substantial (Burnham & Anderson, Reference Burnham and Anderson2002). The ω i of the null model including only the intercept were almost all 0 for all tick stages, and the differences of AICc between the least AICc of the best model and the null model were 7.2, 13.6, and 19.2 for larval, nymphal, and adult stages, respectively. The differences of AICc among these stages indicate that the best-ranked models are better than the null model for all tick stages.
AICc ranking of full models using biological and abiotic factors to estimate dependence of total number of H. longicornis larvae, nymphs, and adults in GLMMs. Null models including only the intercept are also shown for each tick stage.

K, Number of parameters; ΔAICc, difference in AICc between best and the actual model; ω i , Akaike's weight; Evidence ratios, ratio of Akaike's weight of the best and the actual model. Bold letters indicate models with ΔAICc<2. LarvHl: tick abundance of larval H. longicornis; NympHl: tick abundance of nymphal H. longicornis; AdulHl: tick abundance of adult H. longicornis; Deer Dens: density of sika deer; LarvHm: tick abundance of larval H. megaspinosa; NympHm: tick abundance of nymphal H. megaspinosa; Alt: altitude; Temp: mean temperature; Rain: rainfall; DayHour: duration of sunshine without shading; Solar: global solar radiation without shading; SnowDep: depth of snow cover.
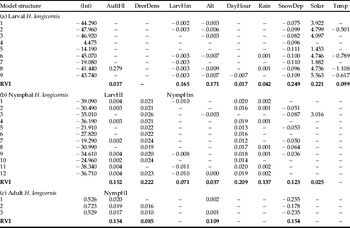
The estimated coefficients for the best-ranked models for each tick stage and the RVI of each predictor variable are shown in table 4. Deer density was positively associated with nymphal and adult but not with larval stages. For larvae, snow depth, altitude, and the larval abundance of H. megaspinosa had negative associations and solar radiation had a positive association with tick abundance, all showing relatively high RVIs. Mean temperature and duration of sunshine without shading had negative associations, while rainfall and adult abundance had positive associations with larval abundance, all showing relatively low RVIs. For nymphs, larval abundance, duration of sunshine without shading, and rainfall were positively associated and snow depth was negatively associated with tick abundance, all showing high RVIs. Nymphal abundance of H. megaspinosa and altitude had negative associations while solar radiation without shading had a positive association with the nymphal abundance, all showing low RVIs. In adults, nymphal abundance and altitude were positively associated and snow depth was negatively associated with tick abundance, all showing high RVIs.
A parameter estimate of each factor relative to the best model (table 3) in the case of equally parsimonious models. Estimates of the relative importance of predictor variables (RVI) were calculated by summing the Akaike weights across the set of all models in which the variable occurs. Model structure IDs correspond to those in table 3.

See table 3 for model structure's numbers; RVI: relative variable importance; Int: Intercept; LarvHl: tick abundance of larval H. longicornis; NympHl: tick abundance of nymphal H. longicornis; AdulHl: tick abundance of adult H. longicornis; Deer Dens: density of sika deer; LarvHm: tick abundance of larval H. megaspinosa; NympHm: tick abundance of nymphal H. megaspinosa; Alt: altitude; Temp: mean temperature; Rain: rainfall; DayHour: duration of sunshine without shading; Solar: global solar radiation without shading; SnowDep: depth of snow cover
Discussion
The density of sika deer was confirmed to be positively associated with the local abundance of questing nymphal and adult H. longicornis through statistical analysis using model comparison with GLMM. These results are well anticipated. Since the range of movement of H. longicornis is limited to only several meters (Mori & Tsunoda, Reference Mori and Tsunoda1996), its distribution depends almost entirely on host movement. Ticks are virtually sessile organisms that depend greatly on host movement to act as a kind of vehicle (Ruiz-Fons & Gilbert, Reference Ruiz-Fons and Gilbert2010). The local abundance of tick species, including various species of ticks that target deer, was previously found to be affected by host density (Rand et al., Reference Rand, Lubelczyk, Lavigne, Elias, Holman, Lacombe and Smith2003; Stafford et al., Reference Stafford, Denicola and Kilpatrick2003; Elias et al., Reference Elias, Lubelczyk, Rand, Lacombe, Holman and Smith2006; Tagliapietra et al., Reference Tagliapietra, Rosà, Arnoldi, Cagnacci, Capelli, Montarsi, Hauffe and Rizzoli2011). However, questing larval abundance was not associated with deer density and was also not strongly associated with questing adult tick abundance. This result is unexpected at first glance; however, it indicates that questing larval abundance is much more strongly regulated by local environmental conditions, which are likely correlated with survival potential rather than by the major supplier factors (i.e., host and adult abundance). As the host range of H. longicornis is known to be relatively large (Hoogstraal et al., Reference Hoogstraal, Roberts, Kohls and Tipton1968), other host species (i.e., other than sika deer) may serve as suppliers of adult ticks that in turn lay eggs. The small sample size of adult ticks collected in this study might also affect the weak association with adult tick abundance. Larval abundance was shown to be negatively associated with the larval abundance of H. megaspinosa, which is another major parasite of wild sika deer (Inokuma et al., Reference Inokuma, Fujimoto, Hosoi, Tanaka, Fujisaki, Okuda and Onishi2002; Tsunoda & Tatsuzawa, Reference Tsunoda and Tatsuzawa2004) and quests high on plants by climbing up on a stalk of grass or on a bush and waiting for a host to pass as does H. longicornis. Tsunoda (Reference Tsunoda2007c ) revealed that the height in the grass above which H. longicornis larvae and nymphs quest is significantly decreased by the presence of H. megaspinosa. This previous interspecific interaction found between these two species was corroborated by our current results.
Larval abundance was strongly associated with several abiotic factors, including snow depth, solar radiation, altitude, and temperature. The positive solar radiation and negative temperature associations were unique to the larval stage, as low temperature could reduce larval activity and egg survival (Fujimoto, Reference Fujimoto1993), and it could prolong the duration of egg development and hatching (Fujisaki et al., Reference Fujisaki, Kitaoka and Morii1975; Sutherst & Bourne, Reference Sutherst and Bourne1991). Solar radiation, however, had not been shown to affect larval H. longicornis abundance in previous studies. There are few reports of the positive effect of solar radiation on larval feeding and adult questing activity of American dog tick, Dermacentor variabilis (Acari: Ixodidae) (Atwood & Sonenshine, Reference Atwood and Sonenshine1967), and there is a report of a positive effect of solar radiation with low temperature but a negative effect with high temperature on Ixodes ricinus (Acari: Ixodidae)–man interactions in Demark (Jensen & Jespersen, Reference Jensen and Jespersen2005). Although we could not identify the exact reason for the positive association between solar radiation and questing larval tick abundance in our study, solar radiation may indirectly affect larval abundance by suppressing harmful fungal activity through the damaging effects of ultraviolet B (UVB) radiation (Inglis et al., Reference Inglis, Goettel, Butt, Strasser, Butt, Jackson and Magan2001). Some species of eumycete and deuteromycete fungi are known to attack and kill ixoid ticks (Benjamin et al., Reference Benjamin, Zhioua and Ostfeld2002; Ostfeld et al., Reference Ostfeld, Price, Hornbostel, Benjamin and Keesing2006). In fact, the entomopathogenic fungi Beauveria bassiana (Sordariomycetes: Cordycipitaceae) and Metarhizium anisopliae (Sordariomycetes: Clavicipitaceae) were found to cause 100% mortality in Rhipicephalus appendiculatus and Amblyomma variegatum (both Acari: Ixodidae) larvae in laboratory tests (Kaaya & Hassan, Reference Kaaya and Hassan2000). Strong UVB radiation often severely reduces the persistence of fungal conidia in the field (Fernandes et al., Reference Fernandes, Bittencourt and Roberts2012). For example, the entomopathogenic fungi B. bassiana can be sterilized under exposure to direct sunlight for less than 3 h (Yamashiro, Reference Yamashiro2000). Although approximately 90% of solar UVB radiation can be absorbed by ozone, water vapor, oxygen, and carbon dioxide through the atmosphere (World Health Organization, 2002), global solar radiation is highly correlated with UVB radiation on the ground in Japan (Motokuni et al., 1999; Shimizu et al., Reference Shimizu, Yoshizawa, Egashira, Hidaka and Yamamoto2006).
Except for the association with adult abundance and deer density, H. longicornis nymphal abundance was positively associated with the duration of sunshine and rainfall. Fujimoto (Reference Fujimoto1995, Reference Fujimoto2000, Reference Fujimoto2008) experimentally clarified that host attachment activity of unfed nymphs was significantly suppressed by exposure to the short-day photoperiod and suggested that nymphs show low activity in autumn around Saitama Prefecture, central Japan. Such behavioral diapause or quiescence in unfed nymphs was also related to the positive association with the duration of sunshine on the questing nymphal abundance at our study sites. H. longicornis larvae were greatly affected by relative humidity, as they cannot molt at relative humidity <74% (Fujimoto, Reference Fujimoto1988). Many other tick species are vulnerable to desiccation in off-host conditions (Needham & Teel, Reference Needham and Teel1991; Chilton & Bull, Reference Chilton and Bull1993; Sutherst & Bourne, Reference Sutherst and Bourne2006), and their abundance and activities were also affected by relative humidity (Oorebeek & Kleindorfer, Reference Oorebeek and Kleindorfer2008; Ruiz-Fons & Gilbert, Reference Ruiz-Fons and Gilbert2010; Tagliapietra et al., Reference Tagliapietra, Rosà, Arnoldi, Cagnacci, Capelli, Montarsi, Hauffe and Rizzoli2011). Such sensitivity to moisture explains the positive effect of rainfall on questing nymphal abundance observed here.
The abundance of questing H. longicornis adults was positively correlated with altitude, which is contrary to the negative effect observed for larvae. As temperature decreases with higher altitude, the negative effect of altitude on larvae could be attributed to the negative effect of temperature. In other tick species, the negative effect of altitude on abundance could be explained by delayed activation of already molted individuals (Jouda et al., Reference Jouda, Perret and Gern2004). Low temperature has also been reported to result in delayed development of eggs and larvae of H. longicornis (Fujisaki et al., Reference Fujisaki, Kitaoka and Morii1975; Sutherst & Bourne, Reference Sutherst and Bourne1991). In contrast, temperature did not show a clear effect on questing adult abundance. Another possible explanation is an indirect effect of host movement on questing adult distribution. The distribution of adult ticks partly depends on the movement of hosts infested with engorged nymphs. The unfed nymphs are usually found questing high on plants from spring to early summer (Tsunoda, Reference Tsunoda2007a ) and then infest a primary host, sika deer. In central Japan from early spring to early summer, some populations of sika deer move to areas that are higher than 2000 m above sea level (asl) to forage in alpine meadows and then move down to lower altitudes for overwintering (Izumiyama & Mochizuki, Reference Izumiyama and Mochizuki2008). Similar seasonal movements of sika deer have also been observed in the northern part of Japan (Takatsuki et al., Reference Takatsuki, Suzuki and Higashi2000). Such seasonal host movement may indirectly affect adult abundance through the positive effect of altitude. In a spatially stratified large-scale tick study, significant negative effects of altitude were observed on host-seeking Ixodes scapularis (Acari: Ixodidae) abundance while controlling for temperature-derived variables (Diuk-Wasser et al., Reference Diuk-Wasser, Vourc'h, Cislo, Hoen, Melton, Hamer, Rowland, Cortinas, Hickling, Tsao, Barbour, Kitron, Piesman and Fish2010). The abundance of this tick was also reported to be related to deer abundance in previous studies (Daniels et al., Reference Daniels, Fish and Schwartz1993; Duffy et al., Reference Duffy, Campbell, Clark, Dimotta and Gurney1994; Stafford et al., Reference Stafford, Denicola and Kilpatrick2003).
Snow depth showed a negative association with abundance at all tick stages. Snow cover appears to act as insulation and thus protects against low temperature and desiccation, giving a positive effect on the abundances of other tick species (McEnroe, Reference McEnroe1984; Drew & Samuel, Reference Drew and Samuel1986). However, in this study, no tick sampling was conducted during times of snow cover, and the opposite effect was observed. A possible explanation is that sika deer are limited to less snowy areas due to the heavy load on the hooves (Takatsuki, Reference Takatsuki1992; Igota et al., Reference Igota, Sakuragi, Uno, McCullough, Kaji and Takatsuki2008; Yabe & Takatsuki, Reference Yabe, Takatsuki, McCullough, Kaji and Takatsuki2009). Although larval abundance is not directly affected by deer density, snow depth might have an indirect effect through its effects on deer or other host species distributions.
H. longicornis is a known vector of Japanese spotted fever and bovine theileriosis. In the case of Japanese spotted fever, the causative agent, Rickettsia japonica (Alphaproteobacteria: Rickettsiaceae), infects all stages of H. longicornis. However, in a review of 101 cases of human infestation with this tick reviewed by Okino et al. (Reference Okino, Ushirogawa, Matoba and Hatsushika2008), most cases were caused by adults (n = 83), while larvae and nymphs were responsible for only 10 and 2 cases, respectively. In the case of bovine theileriosis, only adults and nymphs can transmit the causal agent, Theileria sergenti (Aconoidasida: Theileriidae), because transovarial transmission of T. sergenti does not occur in this tick species.
Our GLMM analysis showed that a high density of sika deer along with specific biological and abiotic factors could increase the risk of vector-borne Japanese spotted fever and bovine theileriosis through increased local abundance of questing H. longicornis nymphs and adults, but not larvae. Therefore, the positive relationship between the abundance of questing adult and nymphal H. longicornis and the density of sika deer revealed in our study suggests that the recent expansion of sika deer in Japan is directly correlated with the expansion of Japanese spotted fever and bovine theileriosis. Sika deer can serve as an amplifier host of the tick carrying these diseases.
The supplementary material for this article can be found at http://www.journals.cambridge.org/BER
Acknowledgements
Dr Hiromi Fujita and Dr Hideo Ootake kindly provided advice on tick species identification. This study was supported by a Grant-in-Aid for Research and Development Projects for Application and Promoting New Policy of Agriculture, Forestry and Fisheries (grant number 1910, 2007–2009) by the Ministry of Agriculture Forestry and Fisheries, Japan.